Vorbeugende Maßnahmen zum Schutz vor einer Bleibelastung von Kindern in Haushalten
Referencias
References to studies included in this review
References to studies excluded from this review
Additional references
References to other published versions of this review
Characteristics of studies
Characteristics of included studies [ordered by study ID]
Ir a:
| Methods | RCT Overall, 24/41 from randomised groups analysed (11 intervention and 13 control) Power calculation performed to determine number of participants (required number not recruited) | |
| Participants | 63 children (41 randomised) under four years from Boston located from screening program, mean age 24.5 months, BL blood lead level 16.9 µg/dL | |
| Interventions | Intervention ‐ Low technology lead hazard reduction: Control ‐ universal outreach and educational activities for both | |
| Outcomes | Blood lead level six months from baseline | |
| Notes | Blood lead level and dust levels dropped in both intervention groups compared to control (crude and adjusted) but no statistical significance Control group and both intervention groups different baseline characteristics and small sample size Several participants had non‐study interventions and were excluded from analysis in the article | |
| Risk of bias | ||
| Bias | Authors' judgement | Support for judgement |
| Random sequence generation (selection bias) | Low risk | Quote from correspondence with author: "an open list of random numbers" |
| Allocation concealment (selection bias) | High risk | Quote: "open list" |
| Blinding (performance bias and detection bias) | Low risk | Quote: "lab analysers were blinded" |
| Blinding (performance bias and detection bias) | Low risk | Quote: "lab analysers were blinded" |
| Incomplete outcome data (attrition bias) | Low risk | Missing outcome data balanced in numbers across groups, with similar reasons for missing data across groups |
| Incomplete outcome data (attrition bias) | Low risk | Missing outcome data balanced in numbers across groups, with similar reasons for missing data across groups |
| Selective reporting (reporting bias) | Unclear risk | Insufficient information |
| Other bias | Low risk | The study appears to be free from other sources of bias |
| Methods | RCT Intention to treat (available case analysis) Power calculation performed to determine number of participants (required number not recruited) | |
| Participants | 90 children aged 1.5 to 5.8 years with blood lead level 15 to 29µg/dL on routine screening in Broken Hill, Australia, mean age 3.5 years, mean blood lead level 19.4 µg/dL | |
| Interventions | Intervention ‐ Home remediation work was performed on intervention households and varied depending on assessment of need to provide each house with a "similar level of lead safety". Work may have included: ceiling dust removal, sealing of ceilings, paint stabilisation, replacement of floor coverings/windows and cleaning. Control ‐ Universal information about minimising lead hazards was provided to both groups. | |
| Outcomes | Blood lead level six months from baseline | |
| Notes | Control group received remediation after completion of study. To examine dose response effect, indoor dust levels were measured to examine the extent in which indoor lead levels were associated with changes in blood lead level. No significant change in blood lead level between groups. | |
| Risk of bias | ||
| Bias | Authors' judgement | Support for judgement |
| Random sequence generation (selection bias) | Low risk | Quote from author, "Children were matched in pairs and then a coin tossed to see which would be the 'case' and have their home re‐mediated first" |
| Allocation concealment (selection bias) | Unclear risk | Insufficient information |
| Blinding (performance bias and detection bias) | Low risk | Nurses collecting blood samples were involved but lab analysers were blinded |
| Blinding (performance bias and detection bias) | Low risk | Technical officers collecting dust samples and lab analysers were blinded |
| Incomplete outcome data (attrition bias) | Low risk | Missing outcome data balanced in numbers across groups, with similar reasons for missing data across groups |
| Incomplete outcome data (attrition bias) | Low risk | Missing outcome data balanced in numbers across groups, with similar reasons for missing data across groups |
| Selective reporting (reporting bias) | Low risk | The study protocol is not available but it is clear that the published reports include all expected outcomes, including those that were pre‐specified and confirmed by investigator |
| Other bias | Low risk | The study appears to be free from other sources of bias |
| Methods | RCT | |
| Participants | 175 children under 28 months with blood lead level 15 to 19 µg/dL on routine screening in Rhode Island, mean age 19 months, mean blood lead level 16.5 µg/dL | |
| Interventions | Intervention ‐ Parental Education (with nursing care plan) via five home visits during one year period Control ‐ one to two educational visits by outreach worker available for both | |
| Outcomes | Blood lead level 12 months from baseline | |
| Notes | blood lead level decrease overall over study in participants but no statistical significance | |
| Risk of bias | ||
| Bias | Authors' judgement | Support for judgement |
| Random sequence generation (selection bias) | Low risk | Quote: "Random numbers table was used to assign cases to either the intervention or the comparison group, sequentially" |
| Allocation concealment (selection bias) | Low risk | Quote: "Group assignments were sealed into envelopes and unknown to either study personnel or the families until after parental consent was obtained" |
| Blinding (performance bias and detection bias) | Low risk | Quote: "The nurses who provided follow up to comparison group children were blinded and nurses that provided care to intervention group were not blinded" and outcome (laboratory) assessors were blinded. |
| Blinding (performance bias and detection bias) | Low risk | Quote: Laboratory analysers were " unaware of group assignment." |
| Incomplete outcome data (attrition bias) | Low risk | Missing outcome data balanced in numbers across groups, with similar reasons for missing data across groups |
| Incomplete outcome data (attrition bias) | Low risk | Missing outcome data balanced in numbers across groups, with similar reasons for missing data across groups |
| Selective reporting (reporting bias) | Low risk | The study protocol is not available but it is clear that the published reports include all expected outcomes, including those that were pre‐specified and confirmed by investigator |
| Other bias | Low risk | The study appears to be free of other sources of bias. |
| Methods | RCT Blinding of outcome assessors not clear Children: 314/314 (100%) enrolled 279/314 (88.9%) blood lead levels analysed at 12 months of age Households: 310/310 (100%) enrolled 110/310 (35.5%) Households evaluated at 12 months Intention‐to‐treat (not performed) Power calculation performed to determine number of participants (required number recruited) | |
| Participants | 314 newborn children from outpatient practices in low income neighbourhoods of Philadelphia (no history of elevated blood lead levels) | |
| Interventions | Intervention ‐ Standard lead poisoning prevention education plus additional extensive education regarding maintaining home in lead‐safe condition and vitis from trained staff at baseline, 6 and 12 months. Cleaning materials provided. Control‐ Standard lead poisoning prevention education | |
| Outcomes | blood lead levels at 12 months Housing lead dust levels Parental Knowledge Assessment | |
| Notes | No significant difference in blood lead levels between groups at 12 months (baseline reading). A two‐year follow‐up is planned for blood lead levels. A matched comparison group was included in results, receiving community standard for prevention of elevated blood lead levels. This group was not part of the randomisation process. Number of households with positive dust wipe results (>40 μg/sq.ft. and window >250μg/sq.ft.) not significantly different. Large number households (65%) lost to follow‐up. Study did not demonstrated an impact on parental knowledge in the children's first blood lead levels at 12 months of age. | |
| Risk of bias | ||
| Bias | Authors' judgement | Support for judgement |
| Random sequence generation (selection bias) | Low risk | Quote: "Randomised blocks using computer‐generated random numbers" |
| Allocation concealment (selection bias) | Unclear risk | Quote: "Study coordinator selected next card in the random sequence to randomise that family" |
| Blinding (performance bias and detection bias) | High risk | No information provided on blinding |
| Blinding (performance bias and detection bias) | High risk | No information provided on blinding |
| Incomplete outcome data (attrition bias) | Low risk | Majority of children enrolled (88.9%) had blood lead levels measured at 12months. Not clear if missing outcome data was balanced in numbers across groups. |
| Incomplete outcome data (attrition bias) | Low risk | Missing outcome data balanced in numbers across groups, with similar reasons for missing data across groups (59/149 treatment and 51/157 Control) |
| Selective reporting (reporting bias) | Low risk | blood lead levels outcome data for the Intervention vs Control groups as pre‐specified in the methods not fully included in text. Comparison of blood lead levels at analysis stage was between intervention and control groups combined and a matched comparison group not included in initial randomisation process. This analysis however was pre‐specified in the Methods. |
| Methods | Quasi‐RCT (even/odd clinic no. assignment) | |
| Participants | 78 children 15 to 72 months from lead poisoning clinic with blood lead level 30 to 49 µg/dL, mean age 43 months, mean blood lead level 38.6 µg/dL | |
| Interventions | Intervention ‐ Dust control team to wet mop all rooms twice per month and parental education to clean more frequently over 12 months period Control ‐ Routine advice dust control by mopping given at clinic. Paint stabilisation for both groups | |
| Outcomes | Vblood lead level 12 months from baseline | |
| Notes | Significant change in blood lead level in intervention gp | |
| Risk of bias | ||
| Bias | Authors' judgement | Support for judgement |
| Random sequence generation (selection bias) | High risk | Allocation method alternate based on "even or odd clinic number" |
| Allocation concealment (selection bias) | High risk | Not used |
| Blinding (performance bias and detection bias) | Low risk | Blinding of outcome assessors (laboratory) |
| Incomplete outcome data (attrition bias) | Low risk | Missing outcome data balanced in numbers across groups, with similar reasons for missing data across groups |
| Selective reporting (reporting bias) | Unclear risk | Insufficient information |
| Other bias | Unclear risk | Insufficient information |
| Methods | Cluster RCT by neighbourhoods | |
| Participants | 408 children living in the included neighbourhoods of Baltimore six months to six years, mean blood lead level 11 µg/dL | |
| Interventions | Intervention ‐ Soil abatement Control ‐ External paint stabilisation for all in study | |
| Outcomes | Blood lead level two‐year from baseline | |
| Notes | Blood lead level decreased in both groups at follow up but no statistical significance Baseline soil lead levels lower than hypothesised with 54% >1000ppm | |
| Risk of bias | ||
| Bias | Authors' judgement | Support for judgement |
| Random sequence generation (selection bias) | Low risk | Quote "Coin toss" |
| Allocation concealment (selection bias) | Unclear risk | Insufficient information |
| Blinding (performance bias and detection bias) | Unclear risk | Quote: "Specimen collectors and laboratory personnel were blinded to group allocation and analyses were done by the State laboratory which had no interest in the outcome of the study" |
| Incomplete outcome data (attrition bias) | Unclear risk | Reasons for missing data not provided |
| Selective reporting (reporting bias) | Unclear risk | Insufficient information |
| Other bias | Unclear risk | Insufficient information |
| Methods | Cluster RCT (households in blocks of six stratified by area and blood lead level) | |
| Participants | 122 households with children under six years in high risk areas (active smelter) identified by 1992 blood screen, mean age 32 months, mean blood lead level 11.6 µg/dL | |
| Interventions | Intervention‐ HEPA vacuuming (seven times in a ten‐month period) Control ‐ Routine advice regarding maintenance and general lead education provided to both groups | |
| Outcomes | Blood lead level ten months from baseline | |
| Notes | No statistical or clinical significant change in blood lead level even with multiple regression analysis for baseline blood lead level and area No clinical significance in dust and lead levels Potential for unit of analysis error | |
| Risk of bias | ||
| Bias | Authors' judgement | Support for judgement |
| Random sequence generation (selection bias) | Low risk | Quote: "Drew concealed slips of paper numbered 1‐6 without replacement" and assigned blocks and then "coin toss" determined that "odds would be treatment blocks" |
| Allocation concealment (selection bias) | Low risk | Quote: "Done in central office" |
| Blinding (performance bias and detection bias) | Low risk | Quote: "blood specimen collector and lab personnel did not know of group assignments" |
| Blinding (performance bias and detection bias) | Low risk | Quote: "Lab personnel analysing the carpet dust samples were not aware of group assignment" |
| Incomplete outcome data (attrition bias) | Low risk | Missing outcome data balanced in numbers across groups, with similar reasons for missing data across groups (55/61 treatment and 56/61 control) |
| Incomplete outcome data (attrition bias) | Low risk | Missing outcome data balanced in numbers across groups, with similar reasons for missing data across groups |
| Selective reporting (reporting bias) | Low risk | The study protocol is not available but it is clear that the published reports include all expected outcomes, including those that were pre‐specified and confirmed by investigator |
| Other bias | Low risk | The study appears to be free of other sources of bias. |
| Methods | RCT | |
| Participants | 594 pregnant women and mothers of children zero to three years in neighbourhood of Phillips, Minneapolis, yielding 607 children recruited by door knocking and community information, mean blood lead level <10 µg/dL | |
| Interventions | Intervention ‐ 20 biweekly culturally specific educational session by peer leaders provided individually and three‐monthly boosters until child = three years Control ‐ Routine state health brochures and home lead assessment and feedback to both groups | |
| Outcomes | blood lead level (capillary until 12 months, venous >12 months) three years from baseline | |
| Notes | No statistically significant change in blood lead level Dichotomous data | |
| Risk of bias | ||
| Bias | Authors' judgement | Support for judgement |
| Random sequence generation (selection bias) | Low risk | Quote: Random number generator" |
| Allocation concealment (selection bias) | Low risk | Quote: "Central office" |
| Blinding (performance bias and detection bias) | Low risk | Outcome assessors "laboratory" blinded according to author |
| Incomplete outcome data (attrition bias) | Low risk | Missing outcome data balanced in numbers across groups, with similar reasons for missing data across groups and "no evidence that a missing data pattern that differed by randomization group" |
| Selective reporting (reporting bias) | Low risk | The study protocol is not available but it is clear that the published reports include all expected outcomes, including those that were pre‐specified and confirmed by investigator |
| Other bias | Low risk | The study appears to be free of other sources of bias. |
| Methods | RCT | |
| Participants | 104 children 12 to 31 months recruited from Lead in Dust Study in Rochester, NY, mean age 20 months, mean blood lead level 6.7 µg/dL | |
| Interventions | Intervention ‐ trained interviewer provided brief lead reduction information, cleaning products to families, demonstration on cleaning and instructions on frequency for household cleaning Control ‐ Brochures on lead poisoning provided to both | |
| Outcomes | Blood lead level seven months from baseline | |
| Notes | No statistical significant difference noted in change in median blood lead level at follow up | |
| Risk of bias | ||
| Bias | Authors' judgement | Support for judgement |
| Random sequence generation (selection bias) | Low risk | Quote: "Computer random number generator" |
| Allocation concealment (selection bias) | Low risk | Quote: "Sealed opaque envelopes" |
| Blinding (performance bias and detection bias) | Low risk | Quote: "Yes, blood lead specimen collectors and analysers were blinded to group allocation." |
| Blinding (performance bias and detection bias) | Unclear risk | Author was unable to recall this information |
| Incomplete outcome data (attrition bias) | Low risk | Missing outcome data balanced in numbers across intervention groups, with similar reasons for missing data across groups and small numbers (8/104) |
| Incomplete outcome data (attrition bias) | Low risk | Missing outcome data balanced in numbers across intervention groups, with similar reasons for missing data across groups; |
| Selective reporting (reporting bias) | Low risk | The study protocol is available and all of the study's pre‐specified outcomes reported in the pre‐specified way. |
| Other bias | Low risk | The study appears to be free of other sources of bias. |
| Methods | RCT (also non‐study control to rule out Hawthorne effect) | |
| Participants | 275 children, six months in Rochester area identified by birth data from five urban hospitals, mean age 6 months, mean blood lead level 2.8ug/dL | |
| Interventions | Intervention ‐ Up to eight visits by dust control advisors, cleaning equipment and supplies in 24 month period Control ‐ Baseline four home visits to both groups | |
| Outcomes | Vblood lead level measured at 6‐ (baseline), 12‐, 18‐, 24‐, 36‐ and 48‐months | |
| Notes | No statistical significant difference in blood lead level at 24 or 48 months between intervention and control groups or percentage of children with raised blood lead level between groups. | |
| Risk of bias | ||
| Bias | Authors' judgement | Support for judgement |
| Random sequence generation (selection bias) | Low risk | Quote: Random number generator" |
| Allocation concealment (selection bias) | Low risk | Quote: "Sealed opaque envelopes" |
| Blinding (performance bias and detection bias) | Low risk | Quote: "Blood lead specimen collectors and analysers were blinded to group allocation". |
| Blinding (performance bias and detection bias) | Low risk | Quote: "Environmental technicians and interviewers blind to group assignment" |
| Incomplete outcome data (attrition bias) | Low risk | Missing outcome data balanced in numbers across intervention groups, with similar reasons for missing data across groups |
| Incomplete outcome data (attrition bias) | Low risk | Missing outcome data balanced in numbers across intervention groups, with similar reasons for missing data across groups |
| Selective reporting (reporting bias) | Low risk | The study protocol is available and all of the study's pre‐specified outcomes reported in the pre‐specified way. |
| Other bias | Low risk | The study appears to be free of other sources of bias |
| Methods | RCT | |
| Participants | 113 children, six to 36 months in Jersey City, NY who responded to posters or referred from community clinics, mean age 20 months, mean blood lead level: 11 to 12 µg/dL | |
| Interventions | Intervention ‐ Biweekly assistance with household cleaning (HEPA vacuum and wet mopping) by community staff members for one year Control ‐ Accident Prevention group given household safety items. Both groups offered education sessions | |
| Outcomes | Blood lead level 12 months from baseline | |
| Notes | Statistical significant decrease in blood lead level in intervention group compared to controls | |
| Risk of bias | ||
| Bias | Authors' judgement | Support for judgement |
| Random sequence generation (selection bias) | Low risk | Quote: "Permutated blocks of varying length" |
| Allocation concealment (selection bias) | Low risk | Quote: "Sealed envelopes" |
| Blinding (performance bias and detection bias) | Low risk | Outcome assessors blinded |
| Blinding (performance bias and detection bias) | Low risk | Outcome assessors blinded |
| Incomplete outcome data (attrition bias) | Low risk | Reasons for missing data not available but there were relatively small numbers missing with 99/113 analysed. |
| Incomplete outcome data (attrition bias) | Unclear risk | Numbers and reasons for missing data not available |
| Selective reporting (reporting bias) | Unclear risk | Insufficient information |
| Other bias | Unclear risk | Insufficient information |
| Methods | RCT | |
| Participants | 101 children, six months to six years in Missouri Superfund area identified through community clinics and screening, mean age three years, mean blood lead level 12.7 µg/dL | |
| Interventions | Intervention Control ‐ a standard health education session, baseline home environment assessment and generic brochures for all | |
| Outcomes | Blood lead level three‐monthly until nine months from baseline | |
| Notes | Overall decrease in blood lead level in all groups but no statistical difference in blood lead level between groups No assessment of variation between subjects lost to follow up and those completing study | |
| Risk of bias | ||
| Bias | Authors' judgement | Support for judgement |
| Random sequence generation (selection bias) | Unclear risk | Method of randomisation unknown |
| Allocation concealment (selection bias) | Unclear risk | Unknown |
| Blinding (performance bias and detection bias) | Low risk | Outcome analysers (laboratory) blinded |
| Blinding (performance bias and detection bias) | Low risk | Outcome analysers (laboratory) blinded |
| Incomplete outcome data (attrition bias) | Unclear risk | Numbers and reasons for missing data not available |
| Incomplete outcome data (attrition bias) | Unclear risk | Numbers and reasons for missing data not available |
| Selective reporting (reporting bias) | Unclear risk | Insufficient information |
| Other bias | Unclear risk | Insufficient information |
| Methods | RCT | |
| Participants | Caregivers of 63 children 12 to 36 months of age selected from clients enrolled in Broward County MediPass (Medicaid) who selected Children's Diagnostic and treatment Centre as their health care provider, mean age 22.5 months, mean blood lead level 3 to 4 µg/dL | |
| Interventions | Intervention ‐ education session at clinic consisting of module, video and brochure at first clinic | |
| Outcomes | Blood lead level three to four months from baseline | |
| Notes | No significant difference in blood lead level at follow up between groups | |
| Risk of bias | ||
| Bias | Authors' judgement | Support for judgement |
| Random sequence generation (selection bias) | Low risk | Quote: "Random list of numbers" |
| Allocation concealment (selection bias) | Low risk | Assigned by central office |
| Blinding (performance bias and detection bias) | Low risk | Blinding of outcome assessors (laboratory) |
| Incomplete outcome data (attrition bias) | Low risk | Missing outcome data balanced in numbers across intervention groups, with similar reasons for missing data across groups |
| Selective reporting (reporting bias) | Low risk | The study protocol is not available but it is clear that the published reports include all expected outcomes, including those that were pre‐specified and confirmed by investigator |
| Other bias | Low risk | The study appears to be free of other sources of bias. |
| Methods | RCT | |
| Participants | 152 children under four years from high lead risk areas of Boston with finger prick blood lead level 10 to 20 µg/dL identified on screening in 1989, mean age 31.6 months, mean blood lead level 12 to 13 µg/dL | |
| Interventions | Phase I only | |
| Outcomes | Venous blood lead levels 11 months from baseline | |
| Notes | Phase I and phase II of Boston Lead‐In‐Soil trial performed but phase II excluded as no controls | |
| Risk of bias | ||
| Bias | Authors' judgement | Support for judgement |
| Random sequence generation (selection bias) | Low risk | Quote: "Computer based random number generator" |
| Allocation concealment (selection bias) | High risk | Allocation performed by one staff member but not actively concealed from other investigators enrolling participants |
| Blinding (performance bias and detection bias) | Low risk | Outcome assessors (laboratory analysers) blinded |
| Blinding (performance bias and detection bias) | Low risk | Outcome assessors (laboratory analysers) blinded |
| Incomplete outcome data (attrition bias) | Low risk | Missing outcome data balanced in numbers across intervention groups, with similar reasons for missing data across groups |
| Incomplete outcome data (attrition bias) | Low risk | Missing outcome data balanced in numbers across intervention groups, with similar reasons for missing data across groups |
| Selective reporting (reporting bias) | Unclear risk | Insufficient information |
| Other bias | Unclear risk | Insufficient information |
Characteristics of excluded studies [ordered by study ID]
Ir a:
| Study | Reason for exclusion |
| No control group utilised for Phase II | |
| Outcome only environmental measures before and after intervention | |
| Outcome (blood lead levels) measured in mothers rather than children, data not in useable form | |
| Retrospective data collection on two groups not randomly assigned | |
| Outcome measured using hair lead levels | |
| Control and Intervention groups from two different study bases | |
| Historical control group with no randomisation used | |
| Retrospective control with no randomisation used |
Data and analyses
| Outcome or subgroup title | No. of studies | No. of participants | Statistical method | Effect size |
| 1 Blood lead level (continuous) Show forest plot | 5 | 815 | Mean Difference (IV, Random, 95% CI) | 0.02 [‐0.09, 0.12] |
| Analysis 1.1 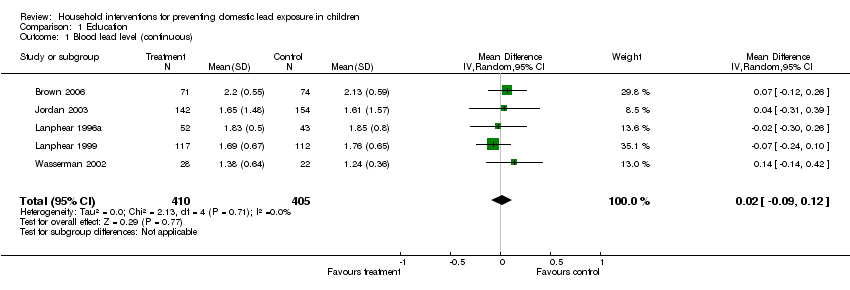 Comparison 1 Education, Outcome 1 Blood lead level (continuous). | ||||
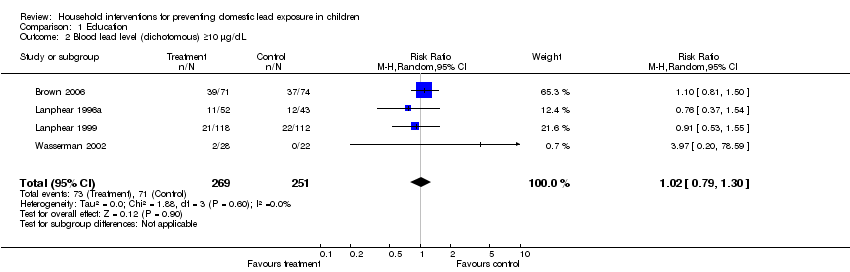
| 2 Blood lead level (dichotomous) ≥10 µg/dL Show forest plot | 4 | 520 | Risk Ratio (M‐H, Random, 95% CI) | 1.02 [0.79, 1.30] |
| Analysis 1.2  Comparison 1 Education, Outcome 2 Blood lead level (dichotomous) ≥10 µg/dL. | ||||
| 3 Blood lead level (dichotomous) ≥15 µg/dL Show forest plot | 4 | 520 | Risk Ratio (M‐H, Random, 95% CI) | 0.60 [0.33, 1.09] |
| Analysis 1.3  Comparison 1 Education, Outcome 3 Blood lead level (dichotomous) ≥15 µg/dL. | ||||
| 4 Floor dust ‐ hard floor Show forest plot | 2 | 318 | Mean Difference (IV, Random, 95% CI) | ‐0.07 [‐0.37, 0.24] |
| Analysis 1.4 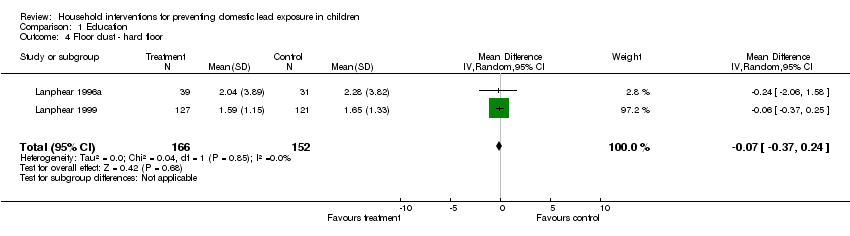 Comparison 1 Education, Outcome 4 Floor dust ‐ hard floor. | ||||
| Outcome or subgroup title | No. of studies | No. of participants | Statistical method | Effect size |
| 1 Blood lead level (continuous) Show forest plot | 3 | 298 | Mean Difference (IV, Random, 95% CI) | ‐0.15 [‐0.42, 0.11] |
| Analysis 2.1  Comparison 2 Environmental ‐ Dust control, Outcome 1 Blood lead level (continuous). | ||||
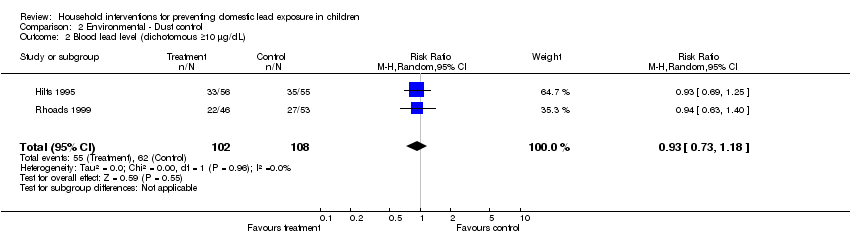
| 2 Blood lead level (dichotomous ≥10 µg/dL) Show forest plot | 2 | 210 | Risk Ratio (M‐H, Random, 95% CI) | 0.93 [0.73, 1.18] |
| Analysis 2.2  Comparison 2 Environmental ‐ Dust control, Outcome 2 Blood lead level (dichotomous ≥10 µg/dL). | ||||
| 3 Blood lead level (dichotomous ≥10 µg/dL) ICC 0.01 Show forest plot | 2 | 204 | Risk Ratio (M‐H, Random, 95% CI) | 0.93 [0.73, 1.18] |
| Analysis 2.3  Comparison 2 Environmental ‐ Dust control, Outcome 3 Blood lead level (dichotomous ≥10 µg/dL) ICC 0.01. | ||||
| 4 Blood lead level (dichotomous ≥10 µg/dL) ICC 0.1 Show forest plot | 2 | 173 | Risk Ratio (M‐H, Random, 95% CI) | 0.95 [0.72, 1.24] |
| Analysis 2.4 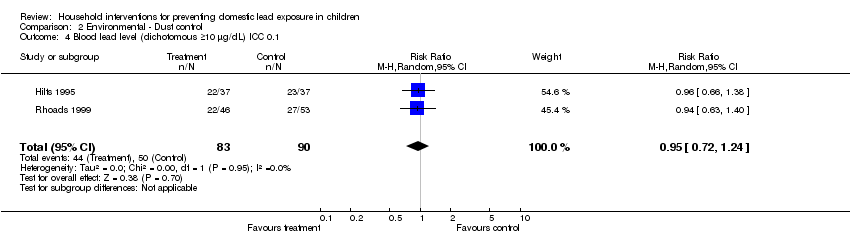 Comparison 2 Environmental ‐ Dust control, Outcome 4 Blood lead level (dichotomous ≥10 µg/dL) ICC 0.1. | ||||
| 5 Blood lead level (dichotomous ≥10 µg/dL) ICC 0.2 Show forest plot | 2 | 155 | Risk Ratio (M‐H, Random, 95% CI) | 0.97 [0.72, 1.29] |
| Analysis 2.5  Comparison 2 Environmental ‐ Dust control, Outcome 5 Blood lead level (dichotomous ≥10 µg/dL) ICC 0.2. | ||||
| 6 Blood lead level (dichotomous ≥15 µg/dL) Show forest plot | 2 | 210 | Risk Ratio (M‐H, Random, 95% CI) | 0.86 [0.35, 2.07] |
| Analysis 2.6  Comparison 2 Environmental ‐ Dust control, Outcome 6 Blood lead level (dichotomous ≥15 µg/dL). | ||||
| 7 Blood lead level (dichotomous ≥15 µg/dL) ICC 0.01 Show forest plot | 2 | 204 | Risk Ratio (M‐H, Random, 95% CI) | 0.82 [0.37, 1.81] |
| Analysis 2.7  Comparison 2 Environmental ‐ Dust control, Outcome 7 Blood lead level (dichotomous ≥15 µg/dL) ICC 0.01. | ||||
| 8 Blood lead level (dichotomous ≥15 µg/dL) ICC 0.1 Show forest plot | 2 | 173 | Risk Ratio (M‐H, Random, 95% CI) | 0.83 [0.34, 2.03] |
| Analysis 2.8 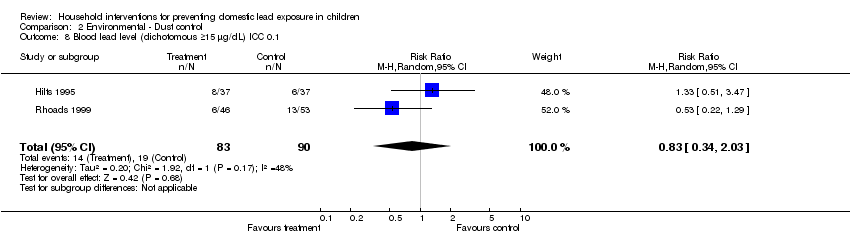 Comparison 2 Environmental ‐ Dust control, Outcome 8 Blood lead level (dichotomous ≥15 µg/dL) ICC 0.1. | ||||
| 9 Blood lead level (dichotomous ≥15 µg/dL) ICC 0.2 Show forest plot | 2 | 155 | Risk Ratio (M‐H, Random, 95% CI) | 0.75 [0.34, 1.66] |
| Analysis 2.9 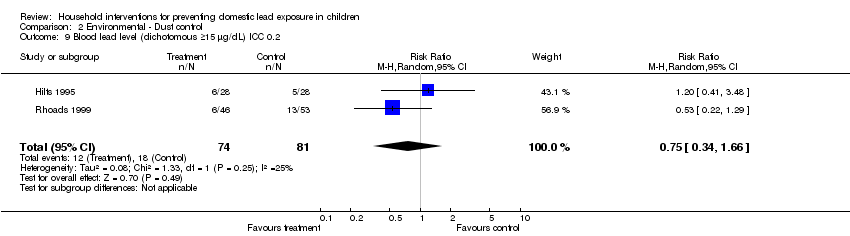 Comparison 2 Environmental ‐ Dust control, Outcome 9 Blood lead level (dichotomous ≥15 µg/dL) ICC 0.2. | ||||
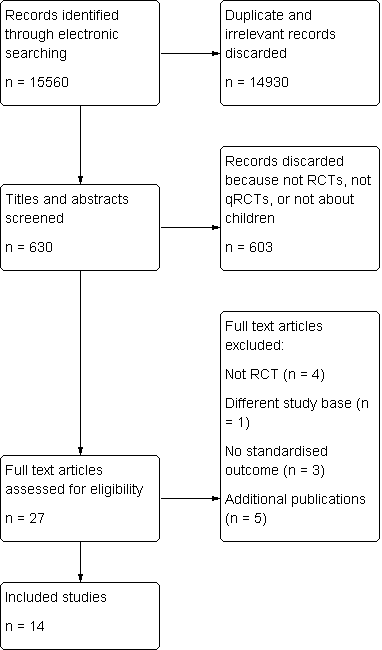
Study flow diagram

Comparison 1 Education, Outcome 1 Blood lead level (continuous).
Comparison 1 Education, Outcome 2 Blood lead level (dichotomous) ≥10 µg/dL.

Comparison 1 Education, Outcome 3 Blood lead level (dichotomous) ≥15 µg/dL.

Comparison 1 Education, Outcome 4 Floor dust ‐ hard floor.

Comparison 2 Environmental ‐ Dust control, Outcome 1 Blood lead level (continuous).
Comparison 2 Environmental ‐ Dust control, Outcome 2 Blood lead level (dichotomous ≥10 µg/dL).

Comparison 2 Environmental ‐ Dust control, Outcome 3 Blood lead level (dichotomous ≥10 µg/dL) ICC 0.01.

Comparison 2 Environmental ‐ Dust control, Outcome 4 Blood lead level (dichotomous ≥10 µg/dL) ICC 0.1.

Comparison 2 Environmental ‐ Dust control, Outcome 5 Blood lead level (dichotomous ≥10 µg/dL) ICC 0.2.
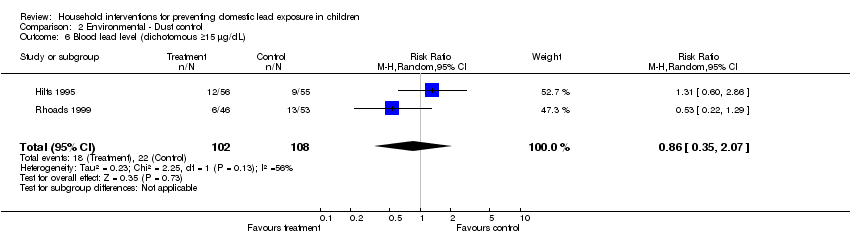
Comparison 2 Environmental ‐ Dust control, Outcome 6 Blood lead level (dichotomous ≥15 µg/dL).

Comparison 2 Environmental ‐ Dust control, Outcome 7 Blood lead level (dichotomous ≥15 µg/dL) ICC 0.01.

Comparison 2 Environmental ‐ Dust control, Outcome 8 Blood lead level (dichotomous ≥15 µg/dL) ICC 0.1.

Comparison 2 Environmental ‐ Dust control, Outcome 9 Blood lead level (dichotomous ≥15 µg/dL) ICC 0.2.
| Education strategies for preventing domestic lead exposure in children | ||||||
| Patient or population: Children | ||||||
| Outcomes | Illustrative comparative risks* (95% CI) | Relative effect | No of Participants | Quality of the evidence | Comments | |
| Assumed risk | Corresponding risk | |||||
| Regular environment | Education strategies for prevention of domestic lead exposure | |||||
| Blood lead level (continuous) | The mean blood lead level (continuous) ranged across control groups from | The mean blood lead level (continuous) in the intervention groups was | 814 | ⊕⊕⊕⊕ | ||
| Blood lead level (dichotomous) ≥ 10 µg/dL | Medium risk population3 | RR 1.02 | 520 | ⊕⊕⊕⊝ | ||
| 238 per 10004 | 243 per 1000 | |||||
| Blood lead level (dichotomous) ≥ 15 µg/dL | Medium risk population3 | RR 0.6 | 520 | ⊕⊕⊕⊝ | ||
| 110 per 10004 | 66 per 1000 | |||||
| Floor dust ‐ hard floor (continuous) Scale from: 0 to 40 | The mean floor dust level ‐ hard floor ‐ ranged across control groups from | The mean floor dust level ‐ hard floor ‐ in the intervention groups was | 318 | ⊕⊕⊕⊝ | ||
| Cognitive and neurobehavioural outcomes ‐ not reported | See comment | See comment | Not estimable | ‐ | See comment | |
| *The basis for the assumed risk (e.g. the median control group risk across studies) is provided in footnotes. The corresponding risk (and its 95% confidence interval) is based on the assumed risk in the comparison group and the relative effect of the intervention (and its 95% CI). | ||||||
| GRADE Working Group grades of evidence | ||||||
| 1 Change in blood lead level | ||||||
| Environmental strategies (dust control) for preventing domestic lead exposure in children | ||||||
| Patient or population: Children | ||||||
| Outcomes | Illustrative comparative risks* (95% CI) | Relative effect | No of Participants | Quality of the evidence | Comments | |
| Assumed risk | Corresponding risk | |||||
| Control | Environmental strategies (Dust Control) | |||||
| Blood lead level (continuous) | The mean blood lead level (continuous) ranged across control groups from | The mean blood lead level (continuous) in the intervention groups was | 298 | ⊕⊕⊕⊝ | ||
| Blood lead level (dichotomous ≥ 10 µg/dL) | Medium risk population3 | RR 0.93 | 210 | ⊕⊕⊕⊝ | ||
| 573 per 10004 | 533 per 1000 | |||||
| Blood lead level (dichotomous ≥ 15 µg/dL) | Medium risk population3 | RR 0.86 | 210 | ⊕⊕⊕⊝ | ||
| 205 per 10004 | 176 per 1000 | |||||
| Cognitive and neurobehavioural outcomes ‐ not reported | See comment | See comment | Not estimable | ‐ | See comment | |
| *The basis for the assumed risk (e.g. the median control group risk across studies) is provided in footnotes. The corresponding risk (and its 95% confidence interval) is based on the assumed risk in the comparison group and the relative effect of the intervention (and its 95% CI). | ||||||
| GRADE Working Group grades of evidence | ||||||
| 1 Change in blood lead level | ||||||
| Study ID | Aschengrau 1998 | Boreland 2009 | Brown 2006 | Campbell 2011 | Charney 1983 | Farrell 1998 | Hilts 1995 | Jordan 2003 | Lanphear 1996 | Lanphear 1999 | Rhoads 1999 | Sterling 2004 | Wasserman 2002 | Weitzman 1993 |
| Mean blood lead level at baseline (µg/dL) | 15‐19 | 15‐19 | 15‐19 | 2.6‐2.7 | >20 | 10‐14 | 10‐14 | <10
| <10 | <10 | 10‐14 | 10‐14 | <10 | 10‐14 |
| Mean age at baseline (months) | 24‐36 | > 36 | 12‐24 | 8‐14 | > 36 | 6‐72 | 24‐36 | <12 | 12‐24 | <12 | 12‐24 | > 36 | 12‐24 | 24‐36 |
| Study ID | Education | Dust control | Soil abatement | Combination |
| Aschengrau 1998 | Yes | |||
| Boreland 2009 | Yes | |||
| Brown 2006 | Yes | |||
| Campbell 2011 | Yes | |||
| Charney 1983 | Yes | |||
| Farrell 1998 | Yes | |||
| Hilts 1995 | Yes | |||
| Jordan 2003 | Yes | |||
| Lanphear 1996 | Yes | |||
| Lanphear 1999 | Yes | |||
| Rhoads 1999 | Yes | |||
| Sterling 2004 | Yes | |||
| Wasserman 2002 | Yes | |||
| Weitzman 1993 | Yes |
| Study ID | Blood lead ‐ continuous | Blood lead ‐ dichotomous | Hard floor lead | Carpet lead | Other |
| Aschengrau 1998 | Yes | Yes | |||
| Boreland 2009 | Yes | ||||
| Brown 2006 | Yes | Yes | Parent‐Child Interaction scale | ||
| Campbell 2011 | Yes | Yes | Chicago Parents Knowledge Test | ||
| Charney 1983 | Yes | Yes | |||
| Farrell 1998 | Total effect (blood lead levels) | ||||
| Hilts 1995 | Yes | Yes | Yes | ||
| Jordan 2003 | Yes | ||||
| Lanphear 1996 | Yes | Yes | Yes | Yes | |
| Lanphear 1999 | Yes | Yes | Yes | Yes | |
| Rhoads 1999 | Yes | Yes | Maternal knowledge lead poisoning | ||
| Sterling 2004 | Yes | ||||
| Wasserman 2002 | Yes | Yes | Chicago Parents Knowledge Test | ||
| Weitzman 1993 | Yes |
| Outcome or subgroup title | No. of studies | No. of participants | Statistical method | Effect size |
| 1 Blood lead level (continuous) Show forest plot | 5 | 815 | Mean Difference (IV, Random, 95% CI) | 0.02 [‐0.09, 0.12] |
| 2 Blood lead level (dichotomous) ≥10 µg/dL Show forest plot | 4 | 520 | Risk Ratio (M‐H, Random, 95% CI) | 1.02 [0.79, 1.30] |
| 3 Blood lead level (dichotomous) ≥15 µg/dL Show forest plot | 4 | 520 | Risk Ratio (M‐H, Random, 95% CI) | 0.60 [0.33, 1.09] |
| 4 Floor dust ‐ hard floor Show forest plot | 2 | 318 | Mean Difference (IV, Random, 95% CI) | ‐0.07 [‐0.37, 0.24] |
| Outcome or subgroup title | No. of studies | No. of participants | Statistical method | Effect size |
| 1 Blood lead level (continuous) Show forest plot | 3 | 298 | Mean Difference (IV, Random, 95% CI) | ‐0.15 [‐0.42, 0.11] |
| 2 Blood lead level (dichotomous ≥10 µg/dL) Show forest plot | 2 | 210 | Risk Ratio (M‐H, Random, 95% CI) | 0.93 [0.73, 1.18] |
| 3 Blood lead level (dichotomous ≥10 µg/dL) ICC 0.01 Show forest plot | 2 | 204 | Risk Ratio (M‐H, Random, 95% CI) | 0.93 [0.73, 1.18] |
| 4 Blood lead level (dichotomous ≥10 µg/dL) ICC 0.1 Show forest plot | 2 | 173 | Risk Ratio (M‐H, Random, 95% CI) | 0.95 [0.72, 1.24] |
| 5 Blood lead level (dichotomous ≥10 µg/dL) ICC 0.2 Show forest plot | 2 | 155 | Risk Ratio (M‐H, Random, 95% CI) | 0.97 [0.72, 1.29] |
| 6 Blood lead level (dichotomous ≥15 µg/dL) Show forest plot | 2 | 210 | Risk Ratio (M‐H, Random, 95% CI) | 0.86 [0.35, 2.07] |
| 7 Blood lead level (dichotomous ≥15 µg/dL) ICC 0.01 Show forest plot | 2 | 204 | Risk Ratio (M‐H, Random, 95% CI) | 0.82 [0.37, 1.81] |
| 8 Blood lead level (dichotomous ≥15 µg/dL) ICC 0.1 Show forest plot | 2 | 173 | Risk Ratio (M‐H, Random, 95% CI) | 0.83 [0.34, 2.03] |
| 9 Blood lead level (dichotomous ≥15 µg/dL) ICC 0.2 Show forest plot | 2 | 155 | Risk Ratio (M‐H, Random, 95% CI) | 0.75 [0.34, 1.66] |