Household interventions for preventing domestic lead exposure in children
Información
- DOI:
- https://doi.org/10.1002/14651858.CD006047.pub4Copiar DOI

- Base de datos:
-
- Cochrane Database of Systematic Reviews
- Versión publicada:
-
- 15 diciembre 2014see what's new
- Tipo:
-
- Intervention
- Etapa:
-
- Review
- Grupo Editorial Cochrane:
-
Grupo Cochrane de Problemas de desarrollo, psicosociales y de aprendizaje
- Copyright:
-
- Copyright © 2014 The Cochrane Collaboration. Published by John Wiley & Sons, Ltd.
Cifras del artículo
Altmetric:
Citado por:
Autores
Contributions of authors
BY, SW, GR, NL and BL developed and wrote the text of this review. The search strategy was developed in concert with Jo Abbott and Margaret Anderson, the former and current Trials Search Coordinator of the Cochrane Developmental, Psychosocial and Learning Problems Group.
Sources of support
Internal sources
-
No sources of support supplied
External sources
-
Financial Markets Foundation for Children, Australia.
-
Commonwealth Government Department of Health, Australia.
Declarations of interest
Berlinda Yeoh ‐ none known
Susan Woolfenden ‐ none known
Bruce Lanphear ‐ was an investigator in two trials included in this review (Lanphear 1996a; Lanphear 1999)
Greta F Ridley ‐ none known
Nuala Livingstone ‐ none known
Acknowledgements
The authors would like to thank those trialists who provided us with information. We thank Dr Katrina Williams for her advice and assistance with methods and meta‐analysis. We commend and appreciate the continued efforts of the Cochrane Developmental, Psychosocial and Learning Problems Group for their help with literature searching, review and editing, in particular the support of Jane Dennis, former Managing Editor. We would also like to thank Danielle Wheeler for her contribution to the original review.
Version history
| Published | Title | Stage | Authors | Version |
| 2020 Oct 06 | Household interventions for secondary prevention of domestic lead exposure in children | Review | Barbara Nussbaumer-Streit, Verena Mayr, Andreea Iulia Dobrescu, Gernot Wagner, Andrea Chapman, Lisa M Pfadenhauer, Szimonetta Lohner, Stefan K Lhachimi, Laura K Busert, Gerald Gartlehner | |
| 2016 Oct 16 | Household interventions for preventing domestic lead exposure in children | Review | Barbara Nussbaumer‐Streit, Berlinda Yeoh, Ursula Griebler, Lisa M Pfadenhauer, Laura K Busert, Stefan K Lhachimi, Szimonetta Lohner, Gerald Gartlehner | |
| 2014 Dec 15 | Household interventions for preventing domestic lead exposure in children | Review | Berlinda Yeoh, Susan Woolfenden, Bruce Lanphear, Greta F Ridley, Nuala Livingstone, Emile Jorgensen | |
| 2012 Apr 18 | Household interventions for preventing domestic lead exposure in children | Review | Berlinda Yeoh, Susan Woolfenden, Bruce Lanphear, Greta F Ridley, Nuala Livingstone | |
| 2008 Apr 23 | Household interventions for prevention of domestic lead exposure in children | Review | Berlinda Yeoh, Susan Woolfenden, Danielle M Wheeler, Garth Alperstein, Bruce Lanphear | |
| 2006 Apr 19 | Household interventions for prevention of domestic lead exposure in children | Protocol | Berlinda Yeoh, Susan Woolfenden, Danielle M Wheeler, Garth Alperstein, Bruce Lanphear | |
Keywords
MeSH
Medical Subject Headings (MeSH) Keywords
Medical Subject Headings Check Words
Child, Preschool; Female; Humans; Infant; Male;
PICO
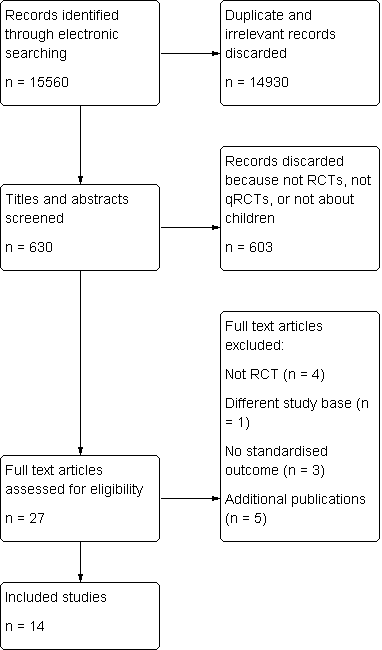
Study flow diagram

Comparison 1 Education, Outcome 1 Blood lead level (continuous).
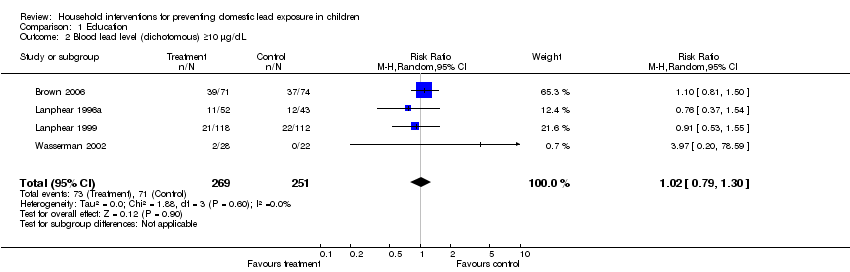
Comparison 1 Education, Outcome 2 Blood lead level (dichotomous) ≥10 µg/dL.

Comparison 1 Education, Outcome 3 Blood lead level (dichotomous) ≥15 µg/dL.
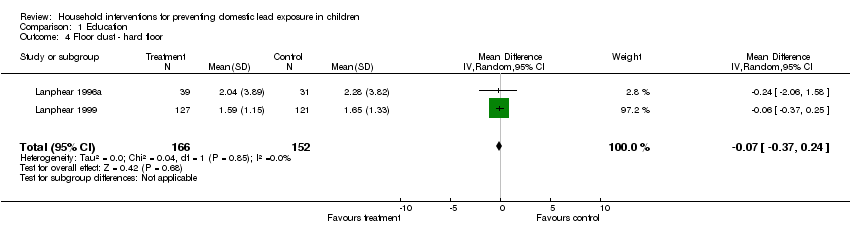
Comparison 1 Education, Outcome 4 Floor dust ‐ hard floor.

Comparison 2 Environmental ‐ Dust control, Outcome 1 Blood lead level (continuous).
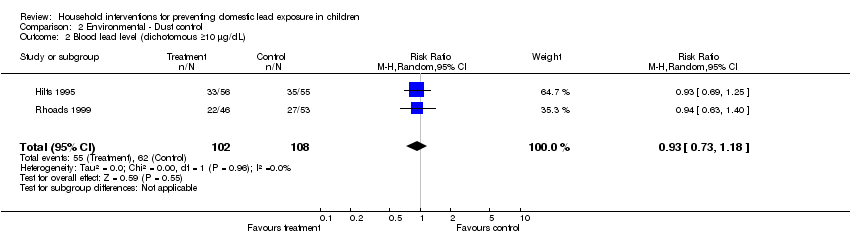
Comparison 2 Environmental ‐ Dust control, Outcome 2 Blood lead level (dichotomous ≥10 µg/dL).

Comparison 2 Environmental ‐ Dust control, Outcome 3 Blood lead level (dichotomous ≥10 µg/dL) ICC 0.01.

Comparison 2 Environmental ‐ Dust control, Outcome 4 Blood lead level (dichotomous ≥10 µg/dL) ICC 0.1.

Comparison 2 Environmental ‐ Dust control, Outcome 5 Blood lead level (dichotomous ≥10 µg/dL) ICC 0.2.
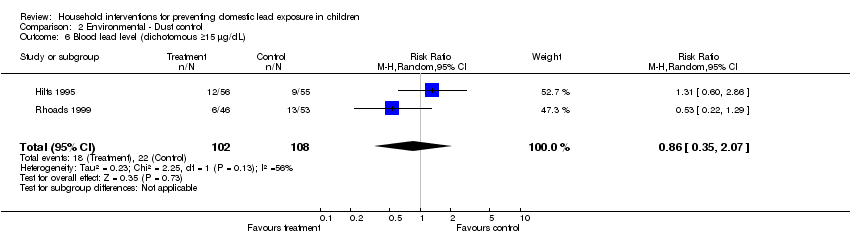
Comparison 2 Environmental ‐ Dust control, Outcome 6 Blood lead level (dichotomous ≥15 µg/dL).

Comparison 2 Environmental ‐ Dust control, Outcome 7 Blood lead level (dichotomous ≥15 µg/dL) ICC 0.01.
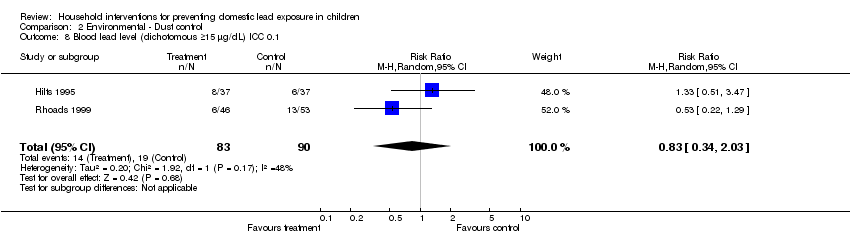
Comparison 2 Environmental ‐ Dust control, Outcome 8 Blood lead level (dichotomous ≥15 µg/dL) ICC 0.1.

Comparison 2 Environmental ‐ Dust control, Outcome 9 Blood lead level (dichotomous ≥15 µg/dL) ICC 0.2.
| Education strategies for preventing domestic lead exposure in children | ||||||
| Patient or population: Children | ||||||
| Outcomes | Illustrative comparative risks* (95% CI) | Relative effect | No of Participants | Quality of the evidence | Comments | |
| Assumed risk | Corresponding risk | |||||
| Regular environment | Education strategies for prevention of domestic lead exposure | |||||
| Blood lead level (continuous) | The mean blood lead level (continuous) ranged across control groups from | The mean blood lead level (continuous) in the intervention groups was | 814 | ⊕⊕⊕⊕ | ||
| Blood lead level (dichotomous) ≥ 10 µg/dL | Medium risk population3 | RR 1.02 | 520 | ⊕⊕⊕⊝ | ||
| 238 per 10004 | 243 per 1000 | |||||
| Blood lead level (dichotomous) ≥ 15 µg/dL | Medium risk population3 | RR 0.6 | 520 | ⊕⊕⊕⊝ | ||
| 110 per 10004 | 66 per 1000 | |||||
| Floor dust ‐ hard floor (continuous) Scale from: 0 to 40 | The mean floor dust level ‐ hard floor ‐ ranged across control groups from | The mean floor dust level ‐ hard floor ‐ in the intervention groups was | 318 | ⊕⊕⊕⊝ | ||
| Cognitive and neurobehavioural outcomes ‐ not reported | See comment | See comment | Not estimable | ‐ | See comment | |
| *The basis for the assumed risk (e.g. the median control group risk across studies) is provided in footnotes. The corresponding risk (and its 95% confidence interval) is based on the assumed risk in the comparison group and the relative effect of the intervention (and its 95% CI). | ||||||
| GRADE Working Group grades of evidence | ||||||
| 1 Change in blood lead level | ||||||
| Environmental strategies (dust control) for preventing domestic lead exposure in children | ||||||
| Patient or population: Children | ||||||
| Outcomes | Illustrative comparative risks* (95% CI) | Relative effect | No of Participants | Quality of the evidence | Comments | |
| Assumed risk | Corresponding risk | |||||
| Control | Environmental strategies (Dust Control) | |||||
| Blood lead level (continuous) | The mean blood lead level (continuous) ranged across control groups from | The mean blood lead level (continuous) in the intervention groups was | 298 | ⊕⊕⊕⊝ | ||
| Blood lead level (dichotomous ≥ 10 µg/dL) | Medium risk population3 | RR 0.93 | 210 | ⊕⊕⊕⊝ | ||
| 573 per 10004 | 533 per 1000 | |||||
| Blood lead level (dichotomous ≥ 15 µg/dL) | Medium risk population3 | RR 0.86 | 210 | ⊕⊕⊕⊝ | ||
| 205 per 10004 | 176 per 1000 | |||||
| Cognitive and neurobehavioural outcomes ‐ not reported | See comment | See comment | Not estimable | ‐ | See comment | |
| *The basis for the assumed risk (e.g. the median control group risk across studies) is provided in footnotes. The corresponding risk (and its 95% confidence interval) is based on the assumed risk in the comparison group and the relative effect of the intervention (and its 95% CI). | ||||||
| GRADE Working Group grades of evidence | ||||||
| 1 Change in blood lead level | ||||||
| Study ID | Aschengrau 1998 | Boreland 2009 | Brown 2006 | Campbell 2011 | Charney 1983 | Farrell 1998 | Hilts 1995 | Jordan 2003 | Lanphear 1996 | Lanphear 1999 | Rhoads 1999 | Sterling 2004 | Wasserman 2002 | Weitzman 1993 |
| Mean blood lead level at baseline (µg/dL) | 15‐19 | 15‐19 | 15‐19 | 2.6‐2.7 | >20 | 10‐14 | 10‐14 | <10
| <10 | <10 | 10‐14 | 10‐14 | <10 | 10‐14 |
| Mean age at baseline (months) | 24‐36 | > 36 | 12‐24 | 8‐14 | > 36 | 6‐72 | 24‐36 | <12 | 12‐24 | <12 | 12‐24 | > 36 | 12‐24 | 24‐36 |
| Study ID | Education | Dust control | Soil abatement | Combination |
| Aschengrau 1998 | Yes | |||
| Boreland 2009 | Yes | |||
| Brown 2006 | Yes | |||
| Campbell 2011 | Yes | |||
| Charney 1983 | Yes | |||
| Farrell 1998 | Yes | |||
| Hilts 1995 | Yes | |||
| Jordan 2003 | Yes | |||
| Lanphear 1996 | Yes | |||
| Lanphear 1999 | Yes | |||
| Rhoads 1999 | Yes | |||
| Sterling 2004 | Yes | |||
| Wasserman 2002 | Yes | |||
| Weitzman 1993 | Yes |
| Study ID | Blood lead ‐ continuous | Blood lead ‐ dichotomous | Hard floor lead | Carpet lead | Other |
| Aschengrau 1998 | Yes | Yes | |||
| Boreland 2009 | Yes | ||||
| Brown 2006 | Yes | Yes | Parent‐Child Interaction scale | ||
| Campbell 2011 | Yes | Yes | Chicago Parents Knowledge Test | ||
| Charney 1983 | Yes | Yes | |||
| Farrell 1998 | Total effect (blood lead levels) | ||||
| Hilts 1995 | Yes | Yes | Yes | ||
| Jordan 2003 | Yes | ||||
| Lanphear 1996 | Yes | Yes | Yes | Yes | |
| Lanphear 1999 | Yes | Yes | Yes | Yes | |
| Rhoads 1999 | Yes | Yes | Maternal knowledge lead poisoning | ||
| Sterling 2004 | Yes | ||||
| Wasserman 2002 | Yes | Yes | Chicago Parents Knowledge Test | ||
| Weitzman 1993 | Yes |
| Outcome or subgroup title | No. of studies | No. of participants | Statistical method | Effect size |
| 1 Blood lead level (continuous) Show forest plot | 5 | 815 | Mean Difference (IV, Random, 95% CI) | 0.02 [‐0.09, 0.12] |
| 2 Blood lead level (dichotomous) ≥10 µg/dL Show forest plot | 4 | 520 | Risk Ratio (M‐H, Random, 95% CI) | 1.02 [0.79, 1.30] |
| 3 Blood lead level (dichotomous) ≥15 µg/dL Show forest plot | 4 | 520 | Risk Ratio (M‐H, Random, 95% CI) | 0.60 [0.33, 1.09] |
| 4 Floor dust ‐ hard floor Show forest plot | 2 | 318 | Mean Difference (IV, Random, 95% CI) | ‐0.07 [‐0.37, 0.24] |
| Outcome or subgroup title | No. of studies | No. of participants | Statistical method | Effect size |
| 1 Blood lead level (continuous) Show forest plot | 3 | 298 | Mean Difference (IV, Random, 95% CI) | ‐0.15 [‐0.42, 0.11] |
| 2 Blood lead level (dichotomous ≥10 µg/dL) Show forest plot | 2 | 210 | Risk Ratio (M‐H, Random, 95% CI) | 0.93 [0.73, 1.18] |
| 3 Blood lead level (dichotomous ≥10 µg/dL) ICC 0.01 Show forest plot | 2 | 204 | Risk Ratio (M‐H, Random, 95% CI) | 0.93 [0.73, 1.18] |
| 4 Blood lead level (dichotomous ≥10 µg/dL) ICC 0.1 Show forest plot | 2 | 173 | Risk Ratio (M‐H, Random, 95% CI) | 0.95 [0.72, 1.24] |
| 5 Blood lead level (dichotomous ≥10 µg/dL) ICC 0.2 Show forest plot | 2 | 155 | Risk Ratio (M‐H, Random, 95% CI) | 0.97 [0.72, 1.29] |
| 6 Blood lead level (dichotomous ≥15 µg/dL) Show forest plot | 2 | 210 | Risk Ratio (M‐H, Random, 95% CI) | 0.86 [0.35, 2.07] |
| 7 Blood lead level (dichotomous ≥15 µg/dL) ICC 0.01 Show forest plot | 2 | 204 | Risk Ratio (M‐H, Random, 95% CI) | 0.82 [0.37, 1.81] |
| 8 Blood lead level (dichotomous ≥15 µg/dL) ICC 0.1 Show forest plot | 2 | 173 | Risk Ratio (M‐H, Random, 95% CI) | 0.83 [0.34, 2.03] |
| 9 Blood lead level (dichotomous ≥15 µg/dL) ICC 0.2 Show forest plot | 2 | 155 | Risk Ratio (M‐H, Random, 95% CI) | 0.75 [0.34, 1.66] |