Вмешательства в домашних условиях для предупреждения бытового воздействия свинца на детей
Abstract
Background
Lead poisoning is associated with physical, cognitive and neurobehavioural impairment in children and trials have tested many household interventions to prevent lead exposure. This is an update of the original review by the same authors first published in 2008.
Objectives
To determine the effectiveness of household interventions in preventing or reducing lead exposure in children as measured by reductions in blood lead levels and/or improvements in cognitive development.
Search methods
We identified trials through electronic searches of CENTRAL (2012, Issue 1), MEDLINE (1948 to January Week 1 2012), EMBASE (1980 to Week 2 2012), CINAHL (1937 to January 2012), PsycINFO (1887 to January Week 2 2012), ERIC (1966 to January 2012), Sociological Abstracts (1952 to January 2012), Science Citation Index (1970 to 20 January 2012), ZETOC (20 January 2012), LILACS (20 January 2012), Dissertation Abstracts (late 1960s to January 2012), ClinicalTrials.gov (19 January 2012), Current Controlled Trials (19 January 2012), Australian New Zealand Clinical Trials Registry (19 January 2012) and the National Research Register Archive. We also contacted experts to find unpublished studies.
Selection criteria
Randomised and quasi‐randomised controlled trials of household educational or environmental interventions to prevent lead exposure in children where at least one standardised outcome measure was reported.
Data collection and analysis
Two authors independently reviewed all eligible studies for inclusion, assessed risk of bias and extracted data. We contacted trialists to obtain missing information.
Main results
We included 14 studies (involving 2656 children). All studies reported blood lead level outcomes and none reported on cognitive or neurobehavioural outcomes. We put studies into subgroups according to their intervention type. We performed meta‐analysis of both continuous and dichotomous data for subgroups where appropriate. Educational interventions were not effective in reducing blood lead levels (continuous: mean difference (MD) 0.02, 95% confidence interval (CI) ‐0.09 to 0.12, I2 = 0 (log transformed); dichotomous ≥ 10µg/dL (≥ 0.48 µmol/L): relative risk (RR) 1.02, 95% CI 0.79 to 1.30, I2=0; dichotomous ≥ 15µg/dL (≥ 0.72 µmol/L): RR 0.60, 95% CI 0.33 to 1.09, I2 = 0). Meta‐analysis for the dust control subgroup also found no evidence of effectiveness (continuous: MD ‐0.15, 95% CI ‐0.42 to 0.11, I2 = 0.9 (log transformed); dichotomous ≥ 10µg/dL (≥ 0.48 µmol/L): RR 0.93, 95% CI 0.73 to 1.18, I2 =0; dichotomous ≥ 15µg/dL (≥ 0.72 µmol/L): RR 0.86, 95% CI 0.35 to 2.07, I2 = 0.56). When meta‐analysis for the dust control subgroup was adjusted for clustering, no statistical significant benefit was incurred. The studies using soil abatement (removal and replacement) and combination intervention groups were not able to be meta‐analysed due to substantial differences between studies.
Authors' conclusions
Based on current knowledge, household educational or dust control interventions are ineffective in reducing blood lead levels in children as a population health measure. There is currently insufficient evidence to draw conclusions about the effectiveness of soil abatement or combination interventions.
Further trials are required to establish the most effective intervention for prevention of lead exposure. Key elements of these trials should include strategies to reduce multiple sources of lead exposure simultaneously using empirical dust clearance levels. It is also necessary for trials to be carried out in developing countries and in differing socioeconomic groups in developed countries.
PICO
Резюме на простом языке
Вмешательства в домашних условиях для предупреждения бытового воздействия свинца на детей
Отравление свинцом связано с неблагоприятными эффектами на развитие и поведение детей. Были изучены многочисленные образовательные вмешательства и вмешательства на уровне домашней/бытовой среды для предотвращения воздействия свинца на детей. Этот обзор из 14 исследований обнаружил, что образовательные вмешательства и вмешательства по контролю запыленности не эффективны в снижении уровня свинца в крови у детей раннего возраста. В настоящее время существует недостаточно доказательств, что борьба с выбросами в почву или комбинация вмешательств снижает уровень свинца в крови, и дальнейшим исследованиям необходимо обратиться к этому. Необходимы дополнительные исследования, чтобы выяснить, что является эффективным для предотвращения воздействия свинца на детей, и исследования должны быть проведены в различных социально‐экономических группах, как в развитых, так и в развивающихся странах.
Authors' conclusions
Summary of findings
| Education strategies for preventing domestic lead exposure in children | ||||||
| Patient or population: Children | ||||||
| Outcomes | Illustrative comparative risks* (95% CI) | Relative effect | No of Participants | Quality of the evidence | Comments | |
| Assumed risk | Corresponding risk | |||||
| Regular environment | Education strategies for prevention of domestic lead exposure | |||||
| Blood lead level (continuous) | The mean blood lead level (continuous) ranged across control groups from | The mean blood lead level (continuous) in the intervention groups was | 814 | ⊕⊕⊕⊕ | ||
| Blood lead level (dichotomous) ≥ 10 µg/dL | Medium risk population3 | RR 1.02 | 520 | ⊕⊕⊕⊝ | ||
| 238 per 10004 | 243 per 1000 | |||||
| Blood lead level (dichotomous) ≥ 15 µg/dL | Medium risk population3 | RR 0.6 | 520 | ⊕⊕⊕⊝ | ||
| 110 per 10004 | 66 per 1000 | |||||
| Floor dust ‐ hard floor (continuous) Scale from: 0 to 40 | The mean floor dust level ‐ hard floor ‐ ranged across control groups from | The mean floor dust level ‐ hard floor ‐ in the intervention groups was | 318 | ⊕⊕⊕⊝ | ||
| Cognitive and neurobehavioural outcomes ‐ not reported | See comment | See comment | Not estimable | ‐ | See comment | |
| *The basis for the assumed risk (e.g. the median control group risk across studies) is provided in footnotes. The corresponding risk (and its 95% confidence interval) is based on the assumed risk in the comparison group and the relative effect of the intervention (and its 95% CI). | ||||||
| GRADE Working Group grades of evidence | ||||||
| 1 Change in blood lead level | ||||||
| Environmental strategies (dust control) for preventing domestic lead exposure in children | ||||||
| Patient or population: Children | ||||||
| Outcomes | Illustrative comparative risks* (95% CI) | Relative effect | No of Participants | Quality of the evidence | Comments | |
| Assumed risk | Corresponding risk | |||||
| Control | Environmental strategies (Dust Control) | |||||
| Blood lead level (continuous) | The mean blood lead level (continuous) ranged across control groups from | The mean blood lead level (continuous) in the intervention groups was | 298 | ⊕⊕⊕⊝ | ||
| Blood lead level (dichotomous ≥ 10 µg/dL) | Medium risk population3 | RR 0.93 | 210 | ⊕⊕⊕⊝ | ||
| 573 per 10004 | 533 per 1000 | |||||
| Blood lead level (dichotomous ≥ 15 µg/dL) | Medium risk population3 | RR 0.86 | 210 | ⊕⊕⊕⊝ | ||
| 205 per 10004 | 176 per 1000 | |||||
| Cognitive and neurobehavioural outcomes ‐ not reported | See comment | See comment | Not estimable | ‐ | See comment | |
| *The basis for the assumed risk (e.g. the median control group risk across studies) is provided in footnotes. The corresponding risk (and its 95% confidence interval) is based on the assumed risk in the comparison group and the relative effect of the intervention (and its 95% CI). | ||||||
| GRADE Working Group grades of evidence | ||||||
| 1 Change in blood lead level | ||||||
Background
Description of the condition
Lead is a metal that has been used since prehistoric times. Over the years, its wide distribution and mobilisation in the environment has resulted in increasing human exposure and uptake (Tong 2000). It has been widely reported that lead poisoning is a serious health hazard with major socioeconomic implications (UNEP‐UNICEF 1997). At high levels, lead poisoning in children can cause anaemia, multi‐organ damage, seizures, coma and death. At chronic low levels, lead toxicity causes significant cognitive, psychological and neurobehavioural impairment (UNEP‐UNICEF 1997; Tong 2000).
In terms of global burden of disease, lead has been shown to account for 0.9% of the total disease burden (Fewtrell 2003). The World Health Organization will soon release their 2005 data on global blood lead levels; however, in the interim, this data has been used to estimate the burden of disease associated with lead exposure in Europe, and amounts to at least 1,053,000 Disability Adjusted Life Years (Braubach 2011). It has been difficult to document lead burden accurately due to the invasive nature of blood lead level monitoring and the diverse manifestations of lead exposure. There are many potential sources of lead in the environment and these include lead industries, mining and smelting; leaded petrol; lead‐based paint; water piping, fixtures and solder; as well as consumer products and hobbies that use lead. Lead from these sources is most commonly found in paint, dust, soil or water. Risk factors for lead exposure include socioeconomic disadvantage, living in an area with lead industry, renovation or deterioration of older lead painted houses and living in developing countries where leaded petrol is still used (Tong 2000).
Blood lead levels in the general population of developed countries have fallen significantly over the past 20 years due to phasing out of lead petrol and bans on the use of lead in paints, lead solder used in canned foods and other consumer products (Jacobs 2006). Concern has now grown regarding chronic low level exposure within the environment (Tong 2000). The major source of environmental lead dust exposure in children in developed countries is lead‐based paints and other lead hazards in housing. Although lead‐based paint is no longer available for domestic use or most industrial use in developed countries, older housing with peeling or flaking paint or current renovations results in increased lead dust levels (EHU 2002).
Occupational and environmental exposures continue to be a serious global problem, especially in developing or rapidly industrialising countries (Tong 2000). Developing country populations, especially children, may have higher levels of lead exposure due to unregulated industrial emission and car emission of leaded petrol; less stringent environmental and occupational health safety regulation, and cottage (domestic) industries such as metal polishing and smelters (UNEP‐UNICEF 1997). It is of concern that lead‐based paints for household use are still available for purchase in several developing Asian countries, such as China, India and Malaysia (Clark 2005; Adebanowo 2007). In view of rapid industrialisation and persistence of lead in the environment, this is likely to remain a significant public health issue in developing countries for many years (Tong 2000).
Children are at increased risk of lead toxicity. This is due to their increased intake of lead per unit body weight compared with adults and their physiological uptake rate being higher (up to 50% compared with 10% to 15% in adults) (UNEP‐UNICEF 1997). Young children often place objects in their mouths resulting in lead‐contaminated dust and soil ingestion. Furthermore, a young child's developing body, and in particular the central nervous system, is more vulnerable to the effects of lead.
Urban children in developing countries are considered most at risk and it was estimated in 1994 that "over 80% of those between three and five years of age and 100% under two had average blood lead levels exceeding the threshold of 10 µg/dL (0.48 µmol/L) set by U.S. Centres for Disease Control and Prevention" (UNEP‐UNICEF 1997).
There is no evidence of a safe blood lead level below which children are not affected (Wigg 2001) and recent studies show that adverse effects on cognitive function in children are proportionally greater at lower blood lead levels (Canfield 2003; Lanphear 2005a; Kordas 2006). Of further concern, the effects of lead are thought to be largely irreversible so reducing or eliminating lead from the body does not significantly improve the neuropsychological manifestations (Tong 2000). Chelation agents, currently the mainstay of treatment of children with blood lead concentrations > 45 µg/dL, reduce the mortality of severe acute lead encephalopathy but they do not remove the majority (estimated to be 95%) of the body's lead sequestered in bone nor do they reverse neuropsychological effects (Chisolm 2001; Rogan 2001; Dietrich 2004). Due to the higher rate of bone turnover in young children, the average half‐life of lead in blood is significantly longer (8 to 11 months with acute exposure and 20 to 38 months with prolonged exposure) than that of adults (15 days) and bone can be a prolonged source of lead in blood (Manton 2000; Chisolm 2001).
It has been estimated that the cost of medical treatment is higher than environmental interventions and is not likely to have significant long‐term benefit (Chisolm 2001). In view of this, it is not acceptable to only identify and treat children suffering from toxicity. Prevention of lead‐induced effects by controlling lead hazards in the environment should be the primary goal for management of this public health issue (Chisolm 2001).
Primary prevention aims to prevent exposure to lead by eliminating the environmental source both at a community and individual level. Secondary prevention aims to identify children who are at risk from their environment and limit further exposure (Campbell 2000). The best method to identify at‐risk individuals is not clearly defined but the AAP recommend screening based on a list of risk criteria. These include children who live in housing built before 1950; live in old housing (pre‐1978) undergoing renovation; have a history of pica; have a history of exposure to lead‐containing substances; have a sibling with lead toxicity; have a parent exposed to lead through vocation or hobby, and who were born in countries with high lead prevalence (Campbell 2000). These guidelines provide guidance to public health authorities for developing a screening policy based on local blood lead and housing age data. Hand in hand with effective screening is the need for effective interventions to reduce lead exposure.
Description of the intervention
Environmental and educational interventions have been the main prevention techniques studied. Educational interventions address parental awareness of lead exposure pathways, hygiene and household dust control measures to prevent ingestion of dust and soil (Campbell 2000). Several papers have studied the effectiveness of educational interventions to encourage home cleaning and these studies varied in the extent of cleaning activities and the educational programme. The results have not supported the effectiveness of education alone (Campbell 2000).
Environmental prevention focuses on improvement in risk assessment, development of housing‐based standards for lead‐based paint hazards, as well as safe and cost‐effective lead hazard reduction techniques (Campbell 2000). Several studies have been published regarding various lead reduction techniques and their relative effectiveness and safety. These have studied both abatement (permanent elimination of lead sources through removal of paint and dust, replacement of lead containing structures and covering of lead‐contaminated soil) and interim controls pending abatement (specialised cleaning, repairs, maintenance, painting and temporary containment). A variety of environmental lead hazard control interventions to decrease children's blood lead level and home dust lead levels have been tested in randomised controlled trials (RCTs), with most follow‐up extending from six months to two years after intervention. Comparison of environmental interventions has been difficult due to variations in intervention type, blood collecting technique, adjustments for age and season, dust lead loading quantification and statistical analyses (Campbell 2000).
Why it is important to do this review
Lead poisoning has long been proven to be associated with physical, cognitive and neurobehavioural impairment in children. Despite efforts to reduce environmental, occupational and industrial lead exposure worldwide, children in many areas with older housing, as well as children living in developing countries with less stringent industrial regulations, continue to show evidence of lead exposure. Many household interventions have been studied in trials and it is important that the effectiveness of these interventions is examined.
This is an update of our original review (Yeoh 2008), which found no evidence of effectiveness for household interventions for education or dust control measures in reducing blood lead levels in children as a population health measure and concluded there was insufficient evidence for soil abatement or combination interventions. Further trials were required to establish the most effective intervention for prevention of lead exposure and hence it is important to update this review looking for any advances in the area.
Objectives
The aim of this systematic review is to determine if educational and/or environmental household interventions are effective in preventing and/or reducing domestic lead exposure in children. This can be assessed by measuring children's blood lead levels and/or improvements in cognitive and neurobehavioural development in both the short‐ and long‐term.
Methods
Criteria for considering studies for this review
Types of studies
RCTs (random allocation) or quasi‐randomised studies (using a method of allocation that is not truly random; for example, by date of birth, medical record number, or order in which participants are included in the study, such as alternation) where participants were allocated to an intervention or control group.
There are several reasons to rely on RCTs or quasi‐randomised trials to test the effect of interventions on children’s blood lead levels. First, they account for secular trends in blood lead levels. Children’s blood lead levels have declined over the past three decades and studies that attempt to test the effect of interventions in the absence of a control group may overestimate their effect because of the downward trend in blood lead concentrations. Second, children’s blood lead levels, which peak at about two years of age, typically decline as they mature, primarily because they no longer exhibit frequent mouthing behaviours. As such, any observational study that enrols children at 18 months to two years may erroneously conclude that the intervention led to a reduction in blood lead levels even though children’s blood lead levels would have declined anyway. Finally, children’s blood lead levels peak during summer months; if the intervention does not account for seasonal variation it may under‐ or over‐estimate the effect of an intervention.
Types of participants
Children and adolescents (from birth to 18 years of age) and their parents or carers.
Types of interventions
Interventions that aim to reduce domestic lead exposure compared to no intervention or standard measures/recommendations. In this review, interventions were classified as follows.
-
Educational interventions ‐ these address parental awareness of lead exposure pathways, hygiene and household dust control measures to prevent ingestion of dust and soil.
-
Environmental (household) interventions ‐ these include specialised cleaning, repairs, maintenance, soil abatement (removal and replacement), painting and temporary containment of lead hazards.
-
Combinations of the above interventions.
Interventions involving nutritional supplementation were not included.
Mode of delivery may be by health professionals, paraprofessionals or via written media.
Types of outcome measures
The following outcomes were considered in this review.
-
Cognitive and neurobehavioural outcomes in children. Standardised measures of outcome, such as assessment of a child's intelligent quotient (IQ) (using the Stanford Binet Intelligence Scale (Smith 1989), Wechsler Intelligence Scale for Children (Wechsler 1991), Wechsler Preschool and Primary Scale of Intelligence (Wechsler 1989)); development (for example, Griffiths Mental Development Scales (Griffiths 1954; Griffiths 1970)), or behaviour (for example, Child Behaviour Checklist (Achenbach 1991))
-
Blood lead levels in children (venous blood sample or capillary blood sample) (AAP 1998)
-
Household dust measures
Instruments were confined to those with at least one standardised outcome measure (such as blood lead level) used for intervention and control group. Outcomes for any follow‐up duration period (short‐term and long‐term) were considered.
Data on adverse events and costs, where available, were also reported in the Results section.
Search methods for identification of studies
The aim of the search strategy was for high precision and recall.
The search strategies used previously for the review were revised for this update to improve their precision (Appendix 1). The single search term "lead" was replaced by phrases in which "lead" occurs in proximity to other relevant terms. The methodology filter used in the MEDLINE strategy was replaced by the 2008 version of the Cochrane highly sensitive search strategy for identifying randomised trials (Lefebvre 2008). Search terms for individual databases were modified as necessary to meet the requirements of any changes to indexing terms or database platforms since the previous searches were executed. There were no language restrictions.
Electronic searches
Relevant trials were identified though searching the following databases, initially in 2006 and then in 2012 for this updated review.
MEDLINE (1948 to Jan Week 1 2012), searched 15 January 2012 (Appendix 2).
Cochrane Central Register of Controlled Trials (CENTRAL) 2012 (Issue 1), searched 20 January 2012 (Appendix 3).
EMBASE (1980 to 2012 Week 2), searched 17 January 2012 (Appendix 4).
PsycINFO (1806 to January Week 2 2012), searched 17 January 2012 (Appendix 5).
CINAHL (1937 to current), searched 20 January 2012 (Appendix 6).
Sociological Abstracts (1952 to current), searched 20 January 2012 (Appendix 7).
ERIC (1966 to current) searched 17 January 2012 (Appendix 8)
Science Citation Index (1970 to current), searched 20 January 2012 (Appendix 9).
ZETOC searched 20 January 2012 (Appendix 10).
LILACS searched 20 January 2012 (Appendix 11).
Dissertation Abstracts searched via Dissertation Express January 2012 (Appendix 12).
ClinicalTrials.gov accessed on 20 January 2012 (Appendix 13).
Current Controlled Trials accessed on 20 January 2012 (Appendix 13).
Australian New Zealand Clinical Trials Registry accessed on January 2012(Appendix 13).
National Research Register Archive searched January 2012 (Appendix 13).
We also conducted internet searches, searched conference proceedings and contacted experts to determine if any unpublished or ongoing trials existed. No further studies were identified.
Data collection and analysis
Selection of studies
Two authors (BY, SW) screened titles and abstracts from the search. We resolved disagreement by consensus and in consultation with a third author (GR) and discarded articles that did not fulfil inclusion criteria. We retrieved potentially relevant articles for full‐text assessment, where appropriate, and for data extraction.
Data extraction and management
We organised data using Review Manager 5 (Review Manager 2011). We developed data extraction forms a priori and included information regarding methods, participant details, intervention type, administration and outcomes. Two independent authors (BY, SW) completed data extraction forms for each included study and no disagreements arose.
Assessment of risk of bias in included studies
Two of four independent authors (BY, SW, GR, NL) evaluated included studies for risk of bias and relevance. We judged each using the categories of 'low risk of bias', 'high risk of bias', or 'unclear risk of bias', indicating either lack of information or uncertainty over the potential for bias. We assessed six specific domains as listed below.
-
Sequence generation describes the method used to generate the allocation sequence to allow an assessment of whether it should produce comparable groups.
-
Allocation concealment describes the method used to conceal the allocation sequence in sufficient detail to determine whether intervention allocations could have been foreseen in advance of, or during, enrolment.
-
Blinding describes all measures use to blind study participants and personnel from knowledge of which intervention a participant received.
-
Incomplete outcome data describes the completeness of outcome data including attrition and exclusions from the analysis.
-
Selective outcome reporting considers whether the trialists reported on all relevant and prespecified outcomes.
-
Other sources of bias considers any important concerns about bias not addressed in the other domains in the tool.
Where there was insufficient information in the published study regarding methodology or results in an extractable form, we contacted authors via email (and fax or phone call if required) on several occasions. We did not score risk of bias on an additive basis.
Measures of treatment effect
Continuous data
Where standardised assessment tools generated a score as the outcome measure, we made comparisons between the means of these scores. We used post‐treatment means and standard deviations in all meta‐analyses. As blood lead level data are typically positively skewed, log transformation of lead data (presented as geometric means) were often provided by included studies. To prepare data ready for meta‐analysis, we performed natural log transformation of all geometric means. We calculated standard deviations from geometric confidence intervals where necessary using the calculation for small sample size (Higgins 2011). If arithmetic means and standard deviations were provided, we contacted authors to clarify that data were normally distributed and if no clarification was available, we assumed that the data were normally distributed. We then converted arithmetic means and standard deviations to approximate means and standard deviations on the log transformed scale according to Higgins 2008, before including in the meta‐analysis. Where raw data were available, we calculated post‐treatment means and standard deviations on the log‐transformed data.
Binary data
Where outcomes from either standardised instruments or diagnostic evaluations were expressed as proportions, we calculated the relative risk with 95% confidence intervals. For dichotomous data, we performed analysis on the number of children with blood lead levels above two thresholds of ≥ 10µg/dL (0.48 µmol/L) and ≥ 15µg/dL (0.72 µmol/L).
Incorporation of a cluster‐randomised trial for meta‐analysis
To determine the impact of possible unit of analysis errors arising from inadequate adjustment for cluster randomisation in published results by Hilts 1995, we used a range of intraclass correlation coefficients (ICCs) to calculate a design effect to reduce the size of each trial to its 'effective sample size' (Higgins 2011). We then used data generated from this approach in the meta‐analysis. We used a range of ICCs (0.001, 0.01, 0.1, 0.2) due to no reliable ICCs being available from cluster trial authors, similar studies or resources that provide examples of ICCs (Ukoumunne 1999). We calculated design effects according to the equation: 1+(M‐1)ICC, where M=6, the average cluster size of households used in the study (Hilts 1995). Design effects calculated using an ICC of 0.001 or less resulted in no change in the sample sizes for intervention and control and so we did not use this data in further analysis.
Dealing with missing data
Where some data on trial methods or results were not reported, we contacted trial authors. Where no reply was forthcoming or full data were not made available, we only included data in meta‐analysis where possible. There was insufficient data to impute results or conduct sensitivity analysis on a 'best‐case/worst case' basis.
Assessment of heterogeneity
We assessed consistency of results visually and by examining I2 (Higgins 2002), a quantity that describes approximately the proportion of variation in point estimates that is due to heterogeneity rather than sampling error. This was supplemented with a test of homogeneity to determine the strength of evidence that the heterogeneity was genuine.
Assessment of reporting biases
We intended to use funnel plots to investigate relationship between effect size and study precision (closely related to sample size) (Egger 1997). However, due to the small number of included studies, this was not possible.
Data synthesis
When two or more studies reported data that could be combined, we performed a meta‐analysis. For any given outcome, mean difference (MD) and relative risk (RR) for dichotomous data, with their 95% confidence intervals (CIs), were calculated for continuous and dichotomous data, respectively, using a random‐effects model.
Subgroup analysis and investigation of heterogeneity
Studies were put into subgroups for clinically different interventions as follows.
-
Educational
-
Environmental (household) ‐ dust control and soil abatement
-
Combination ‐ educational and dust control
Due to limited number of studies within each intervention type, there was insufficient data for subgroup analysis for baseline age or baseline blood lead level.
Sensitivity analysis
We conducted a sensitivity analysis to assess the impact of one study (Brown 2006) on the meta‐analysis as it had higher baseline blood levels than the other studies within the educational intervention subgroup.
Sensitivity analysis based on risk of bias analysis was planned but due to the studies meta‐analysed being of similar low risk of bias, this was not required.
Results
Description of studies
Results of the search
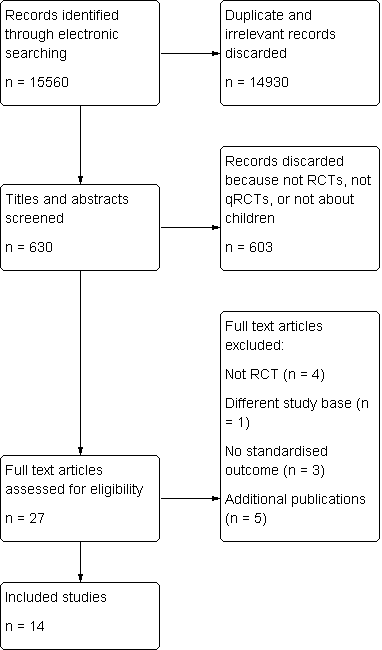
The original literature search for this review was completed at the end of May 2006 and yielded 11,655 titles. We rejected articles at title and abstract stage if they were not primarily about lead exposure in children, were not randomised/quasi‐randomised control trials or did not fulfil the inclusion criteria as outlined above. We conducted full text reviews of 25 promising papers and, of these, 20 separate trials were identified (with five papers being additional publications for these trials). From the 20 separate trials identified, we included 12 and excluded eight. We did not identify any unpublished papers or ongoing papers.
An updated search was run at the end of April 2010 and yielded 2951 additional titles. After excluding based on above methods at the title and abstract stage, there was one additional study identified, resulting in 13 trials being included in the review overall.
Another updated search was run end of January 2012 and yielded 954 titles. After excluding based on above methods at the title and abstract stage, there was one additional study identified, resulting in 14 trials being included in the review overall. Figure 1 shows the screening process for the total number of records found for this review to date.

Study flow diagram
Included studies
Please see Characteristics of included studies.
Design
Thirteen RCTs and one quasi‐randomised control trial (Charney 1983) were included in this review and included 2656 children under the age of six years. All studies used a parallel design, with one study (Weitzman 1993/Aschengrau 1994) also performing the intervention on volunteers from the control group at a later date (phase II). As no control was used, we did not include these phase II results in our review. Another study by Campbell 2011 included a matched control group at the analysis stage. This group had been pre‐specified in the study methods but was not part of the randomisation process, therefore could not be included in the results of this review. Twelve studies used individuals (or households) and two studies (Hilts 1995; Farrell 1998) used clusters (neighbourhoods and blocks of six households, respectively) as the unit of allocation for randomisation.
Sample sizes
Four studies had fewer than 100 participants (Charney 1983; Aschengrau 1998; Wasserman 2002; Boreland 2009), six had 100 to 200 participants (Weitzman 1993; Hilts 1995; Lanphear 1996a; Rhoads 1999; Sterling 2004; Brown 2006) and four had more than 200 participants (Farrell 1998; Lanphear 1999; Jordan 2003; Campbell 2011).
Participants and setting
Thirteen included studies were carried out in urban areas of the USA, with one study performed in Broken Hill, Australia (Boreland 2009). The majority of studies were performed in areas of lower socioeconomic status, with a significant proportion of participants living in rental accommodation with below average household income levels. More than half of the included studies had significant proportions of people identifying themselves as African‐American or Hispanic. Males and females were represented equally in all studies. No measure of the baseline cognitive or neurobehavioural status was available for participants in any included study.
Thirteen studies recruited their participants from routine screening programs, medical clinics, previous lead studies or community volunteers and excluded children who had clinical symptoms, were having treatment for lead toxicity (for example, chelation) or had high blood lead levels requiring intervention (> 20 to 24 µg/dL; 0.97 to 1.16 µmol/L). Charney 1983 recruited participants from a lead poisoning clinic and 15% of children were reported to have had previous treatment for lead toxicity.
Baseline mean blood lead levels varied across studies with five studies reporting low levels (<10 µg/dL; 0.48 µmol/L) (Lanphear 1996a; Lanphear 1999; Wasserman 2002; Jordan 2003; Campbell 2011); five reporting low to moderate levels (10 to14 µg/dL; 0.48 to 0.68 µmol/L) (Weitzman 1993; Hilts 1995; Farrell 1998; Rhoads 1999; Sterling 2004); three reporting moderate levels (15 to 19 µg/dL; 0.72 to 0.92 µmol/L) (Aschengrau 1998; Brown 2006; Boreland 2009), and one reporting high levels (> 20 µg/dL; 0.97 µmol/L) (Charney 1983) (Table 1).
| Study ID | Aschengrau 1998 | Boreland 2009 | Brown 2006 | Campbell 2011 | Charney 1983 | Farrell 1998 | Hilts 1995 | Jordan 2003 | Lanphear 1996 | Lanphear 1999 | Rhoads 1999 | Sterling 2004 | Wasserman 2002 | Weitzman 1993 |
| Mean blood lead level at baseline (µg/dL) | 15‐19 | 15‐19 | 15‐19 | 2.6‐2.7 | >20 | 10‐14 | 10‐14 | <10
| <10 | <10 | 10‐14 | 10‐14 | <10 | 10‐14 |
| Mean age at baseline (months) | 24‐36 | > 36 | 12‐24 | 8‐14 | > 36 | 6‐72 | 24‐36 | <12 | 12‐24 | <12 | 12‐24 | > 36 | 12‐24 | 24‐36 |
With regards to the age at baseline, the children in three studies had a mean age of less than 12 months (Lanphear 1999; Jordan 2003; Campbell 2011); four studies had mean ages between 12 and 24 months (Lanphear 1996a; Rhoads 1999; Wasserman 2002; Brown 2006); three studies had mean ages between 24 and 36 months (Weitzman 1993; Hilts 1995; Aschengrau 1998), and three studies had mean ages greater than 36 months (Charney 1983; Sterling 2004; Boreland 2009). One study did not report mean age; the age range was six months to six years (Farrell 1998) (Table 2).
| Study ID | Education | Dust control | Soil abatement | Combination |
| Aschengrau 1998 | Yes | |||
| Boreland 2009 | Yes | |||
| Brown 2006 | Yes | |||
| Campbell 2011 | Yes | |||
| Charney 1983 | Yes | |||
| Farrell 1998 | Yes | |||
| Hilts 1995 | Yes | |||
| Jordan 2003 | Yes | |||
| Lanphear 1996 | Yes | |||
| Lanphear 1999 | Yes | |||
| Rhoads 1999 | Yes | |||
| Sterling 2004 | Yes | |||
| Wasserman 2002 | Yes | |||
| Weitzman 1993 | Yes |
Interventions
The interventions used in the studies were either educational, environmental or a combination of these. In studies using educational interventions, three studies used education alone (Wasserman 2002; Jordan 2003; Brown 2006) and two studies used education with supply of cleaning products (Lanphear 1996a; Lanphear 1999). Of the studies using environmental interventions, two studies used soil abatement (Weitzman 1993; Farrell 1998) and three used dust control interventions (Hilts 1995, Rhoads 1999; Boreland 2009). Four studies used a combination of lead dust control, education and/or hazard reduction interventions (Charney 1983; Aschengrau 1998; Sterling 2004; Campbell 2011) (Table 2).
Intervention integrity
We contacted trial authors to provide additional information about intervention integrity. Authors reported general difficulties in providing consistent environmental and educational interventions in a community setting and inconsistent compliance with recommended housekeeping practices. Measures of compliance were not performed.
Control
One study used a placebo attention‐control group in which participants received an accident prevention intervention and were given home safety items (Rhoads 1999). Thirteen studies did not use any placebo intervention. Seven studies (Charney 1983; Aschengrau 1998; Farrell 1998; Lanphear 1999; Wasserman 2002; Brown 2006; Campbell 2011) gave the control groups lead educational information, dust control and/or hazard reduction available to the general community with no additional input from the researchers. In three studies (Hilts 1995; Lanphear 1996a; Boreland 2009), both intervention and control groups received basic educational brochures or information about reduction of lead hazards separate to the intervention. In two studies (Jordan 2003; Sterling 2004), both groups received home lead assessment and feedback and in one study (Weitzman 1993), both groups received internal lead hazard reduction with the intervention group also receiving the intervention of interest in the study (soil abatement).
Intervention duration
The duration of intervention for twelve studies ranged between three months and 24 months. In the two studies that used soil abatement intervention (Farrell 1998, Weitzman 1993), the intervention was performed on a single occasion within the study duration.
Outcomes
Blood lead level was the standardised outcome reported in all studies. No studies used any standardised cognitive and neurobehavioural outcomes. Environmental outcomes, including household dust and lead loading, were reported in nine studies (Weitzman 1993; Hilts 1995; Lanphear 1996a; Aschengrau 1998; Lanphear 1999; Rhoads 1999; Sterling 2004; Brown 2006; Campbell 2011) (Table 3).
| Study ID | Blood lead ‐ continuous | Blood lead ‐ dichotomous | Hard floor lead | Carpet lead | Other |
| Aschengrau 1998 | Yes | Yes | |||
| Boreland 2009 | Yes | ||||
| Brown 2006 | Yes | Yes | Parent‐Child Interaction scale | ||
| Campbell 2011 | Yes | Yes | Chicago Parents Knowledge Test | ||
| Charney 1983 | Yes | Yes | |||
| Farrell 1998 | Total effect (blood lead levels) | ||||
| Hilts 1995 | Yes | Yes | Yes | ||
| Jordan 2003 | Yes | ||||
| Lanphear 1996 | Yes | Yes | Yes | Yes | |
| Lanphear 1999 | Yes | Yes | Yes | Yes | |
| Rhoads 1999 | Yes | Yes | Maternal knowledge lead poisoning | ||
| Sterling 2004 | Yes | ||||
| Wasserman 2002 | Yes | Yes | Chicago Parents Knowledge Test | ||
| Weitzman 1993 | Yes |
Both continuous and dichotomous blood lead level data were available from seven studies (Charney 1983; Hilts 1995; Lanphear 1996a; Lanphear 1999; Rhoads 1999; Wasserman 2002; Brown 2006). Five studies provided only continuous data (Weitzman 1993; Aschengrau 1998; Jordan 2003; Boreland 2009; Campbell 2011); one study provided only dichotomous data (Sterling 2004), and one study reported results in terms of 'total effect' (Farrell 1998). Additionally, raw data were available for three studies (Lanphear 1996a; Lanphear 1999; Wasserman 2002).
For continuous data, seven of the twelve studies reported geometric means (Hilts 1995; Lanphear 1996a; Lanphear 1999; Jordan 2003; Brown 2006; Boreland 2009; Campbell 2011) and five studies reported arithmetic means (Charney 1983; Weitzman 1993; Aschengrau 1998; Rhoads 1999; Wasserman 2002). Data from Aschengrau 1998 were reported as having normal distribution. As no clarification was available for remaining studies providing arithmetic means, it was assumed that the data were normally distributed.
Limited data detailing study costs were available for six studies (Hilts 1995; Farrell 1998; Wasserman 2002; Sterling 2004; Brown 2006; Boreland 2009). Information on adverse outcomes was available for five studies (Hilts 1995; Farrell 1998; Rhoads 1999; Wasserman 2002; Brown 2006) and none of these reported significant adverse events.
Follow‐up duration
The period of follow‐up ranged from six months to 48 months from baseline with the majority of studies reporting blood lead levels measured from three to 12 months post‐intervention. Two studies provided longer follow‐up (Lanphear 1999; Jordan 2003). Lanphear 1999 collected data up to 18 months post intervention with a follow‐up publication at 48 months follow‐up (Lanphear 2000). Jordan 2003 had follow‐up data reported at four‐monthly intervals up to three years post intervention.
Short‐term post intervention data were used from the two long‐term studies (six months for Lanphear 1999 and 18 months for Jordan 2003) in our meta‐analysis to enable a more comparable follow‐up period to other included studies. With regard to household dust level outcomes, six‐month follow‐up data were used for the two studies with available data (Lanphear 1996a; Lanphear 1999).
Excluded studies
Please see Characteristics of excluded studies.
Of the eight excluded papers, three studies used retrospective or historical controls without randomisation (EPA 1996; Taha 1999; Pollak 2002); one study reported long‐term follow up for an included trial but did not use controls (Aschengrau 1994); one study compared two groups from different study bases (Omidpanah 1998), and three studies did not report any standardised measure in children as an outcome (with Boreland 2006 reporting on environmental measures, Dugbatey 2005 reporting on maternal blood levels and Marlowe 2001 reporting hair lead levels).
Risk of bias in included studies
Thirteen studies were randomised and one was a quasi‐randomised controlled trial in which alternate clinic numbers determined allocation to groups (Charney 1983). We received responses from all authors when we contacted them to provide missing information on methodology or results but, in many instances, some of the information requested for methodology and/or results was not available.
Allocation
Participation
The participation rate varied significantly between studies. In two studies where patients were recruited from medical clinics, participation rate was 100% (Charney 1983; Wasserman 2002). Nine studies used population‐based enrolment. Of these, six studies reported a 60% to 80% participation rate (Weitzman 1993; Hilts 1995; Lanphear 1999; Rhoads 1999; Sterling 2004; Brown 2006) and three studies reported less than 60% (Lanphear 1996a; Aschengrau 1998; Boreland 2009). For the three remaining studies, authors were unable to specify participation rate for two studies due to the use of a community/outreach recruitment process in which volunteers were recruited from community posters and/or door knocks (Farrell 1998; Jordan 2003). In another, the participation rate could not be determined as it was not clear how many children attended the outpatient practices where recruitment took place (Campbell 2011).
Sequence generation
Of the 13 RCTs, methods of randomisation were available for 12 RCTs and remained unclear in one study (Sterling 2004). The quasi‐randomised study in which alternate clinic numbers determined allocation to groups was not included in this section (Charney 1983). Method of randomisation was adequate for the twelve studies with available information. Eight studies used random number generators, tables or lists; two studies used coin toss; one study used numbered slips of paper, and one study used permutated blocks of varying length.
Allocation concealment
Of the 13 RCTs, eight studies had adequate allocation concealment by the use of sealed envelope or a central office and allocation concealment remained unclear in two studies (Sterling 2004; Campbell 2011). Three studies did not report adequate concealment (Weitzman 1993; Aschengrau 1998; Boreland 2009).
Blinding
In some studies, not all participants or study personnel were blinded. Blinding for all outcome assessors for dust and blood samples was performed in all studies except one where no information on blinding was provided (Campbell 2011).
Incomplete outcome data
Eight studies had more than 80% follow‐up (Weitzman 1993; Hilts 1995; Lanphear 1996a; Aschengrau 1998; Lanphear 1999; Rhoads 1999; Brown 2006; Boreland 2009); three studies had 60% to 80% follow‐up (Charney 1983; Wasserman 2002; Jordan 2003), and three studies had less than 60% follow‐up (Farrell 1998; Sterling 2004; Campbell 2011) and were not included in meta‐analysis. Summarised for each intervention subgroup: education subgroup follow‐up ranged from 60% to 90%; dust control subgroup follow‐up ranged from 85% to 95%; soil abatement subgroup ranged from 45% to 95%, and combination subgroup ranged from 35% to 90%. The most common reasons reported for withdrawal were that families had moved out of the area or were no longer contactable.
We contacted authors to determine if participants were analysed in the groups to which they were randomised (intention to treat). Complete measure of all participants' outcomes (full intention to treat analysis) was not possible in any study due to loss of contact with some participants in all studies. Seven studies analysed data based on available participants' outcomes (available case analysis) (Weitzman 1993; Hilts 1995; Lanphear 1996a; Lanphear 1999; Brown 2006; Boreland 2009; Campbell 2011). The review authors were unable to determine if data from all available participants was used without correction in five studies (Charney 1983; Rhoads 1999; Wasserman 2002; Jordan 2003; Sterling 2004). In two studies (Aschengrau 1998; Farrell 1998, participants were excluded from analysis if non‐study interventions (such as any lead hazard reduction measures performed independently of study intervention) occurred during the study.
Selective reporting
Although it was difficult gathering all required information to accurately assess this, information from authors suggest that published reports include all expected outcomes, including those that were pre‐specified. This applied to all except for Campbell 2011, where the data on blood lead levels in children at 12 months of age, for prespecified intervention and control groups, were not reported separately but as a combined group that was compared with a matched control group which had not been included in the initial randomisation process.
Other potential sources of bias
Unit of allocation
Twelve studies used individual children or households as their unit of allocation for intervention and analysis and two studies used cluster allocation. One of these used neighbourhood clusters (Farrell 1998) and it was unclear how analysis was performed as data were not available. The other study used clusters of six households (Hilts 1995) but used individuals as unit for analysis and therefore introduced a unit of analysis error.
Effects of interventions
See: Summary of findings for the main comparison Education strategies for preventing domestic lead exposure in children; Summary of findings 2 Environmental strategies (dust control) for preventing domestic lead exposure in children
We present results sequentially by intervention type, by outcome measure and by type of data, i.e. continuous and dichotomous.
The 14 studies were put in subgroups based on type of intervention as combining these significantly different types of intervention would not be clinically appropriate.
1. Education (Lanphear 1996a; Lanphear 1999; Wasserman 2002; Jordan 2003; Brown 2006).
2. Environmental
a) Dust control (Hilts 1995; Rhoads 1999; Boreland 2009).
b) Soil abatement (Weitzman 1993; Farrell 1998).
3. Combination ‐ education and dust control (Charney 1983; Aschengrau 1998; Sterling 2004; Campbell 2011).
Education
Cognitive and neurobehavioural outcomes
None of the included studies measured cognitive or neurobehavioural outcomes of their participants.
Blood lead level outcomes
Five studies of educational interventions were available for meta‐analysis (Lanphear 1996a; Lanphear 1999; Wasserman 2002; Jordan 2003; Brown 2006). Geometric means were readily available from all authors except Wasserman 2002 who provided raw data.
Continuous data
Meta‐analysis of log transformed summary data showed no evidence of a treatment effect (MD 0.02, 95% CI ‐0.09 to 0.12, I2 = 0; Analysis 1.1). Exponentiation of the result produced a treatment effect of 1.02, 95% CI 0.91 to 1.13. The mean age for all studies was less than two years of age and baseline blood level of all except in Brown 2006 was low (< 10 µg/dL; 0.48 µmol/L). As the baseline blood lead level for Brown 2006 was in the moderate range (15 to 19 µg/dL; 0.72 to 0.92 µmol/L), a sensitivity analysis was performed to assess the effect of clinical heterogeneity. When Brown 2006 was excluded, there was still no evidence of a treatment effect (MD ‐0.01, 95% CI ‐0.13 to 0.11; I2 = 0). Exponentiation of the result produced a treatment effect of 0.99, 95% CI 0.88 to 1.12.
Dichotomous data
We performed meta‐analysis of dichotomous data for four studies as dichotomous outcomes were not available for Jordan 2003. Meta‐analysis for numbers of children with blood lead level ≥ 10 µg/dL (0.48 µmol/L) showed no evidence of a treatment effect (RR 1.02, 95% CI 0.79 to 1.30, I2=0; Analysis 1.2). Meta‐analysis of data reported as numbers of children with blood lead level ≥ 15 µg/dL (0.72 µmol/L) showed a trend supporting the intervention but no statistically significant effect (RR 0.60, 95% CI 0.33 to 1.09, I2 = 0; Analysis 1.3).
Household floor dust outcomes
Continuous data
Two studies (Lanphear 1996a; Lanphear 1999) of the five had log transformed summary data available on hard floor dust lead levels for this intervention. The meta‐analysis of the log transformed summary data showed no evidence of treatment effect (MD ‐0.07, 95% CI ‐0.37 to 0.24; Analysis 1.4). Exponentiation of the result produced a treatment effect of 0.93, 95% CI 0.69 to 1.27.
Environmental
Cognitive and neurobehavioural outcomes
None of the included studies measured cognitive or neurobehavioural outcomes in their participants.
Blood lead level outcomes
Dust control
Continuous data
Three studies (Hilts 1995; Rhoads 1999; Boreland 2009) used dust control interventions. Hilts 1995 and Boreland 2009 reported log transformed summary data while Rhoads 1999 reported arithmetic means and standard deviations. The meta‐analysis of log transformed summary data showed no evidence of a treatment effect (MD ‐0.15, 95% CI ‐0.42 to 0.11; Analysis 2.1). Exponentiation of the result produced a treatment effect of 0.86, 95% CI 0.66 to 1.12.
Dichotomous data
We performed meta‐analysis of dichotomous data for two studies (Hilts 1995; Rhoads 1999). Meta‐analysis for numbers of children with blood lead level ≥10 µg/dL (0.48 µmol/L) showed no evidence of a treatment effect (RR 0.93, 95% CI 0.73 to 1.18, I2=0; Analysis 2.2) as was also the case for children with blood lead levels ≥15 µg/dL (0.72 µmol/L) (RR 0.86, 95% CI 0.35 to 2.07, I2 = 56; Analysis 2.6).
Impact of clustering and unit of analysis errors
Effective sample sizes were calculated for the cluster‐randomised trial (Hilts 1995) for a range of ICCs before incorporating into meta‐analysis. For blood lead levels ≥ 10 µg/L (0.48 µmol/L), there was no statistically significant treatment benefit when meta‐analysis was adjusted for clustering: ICC 0.01 (RR 0.93, 95% CI 0.73 to 1.18, I2=0; Analysis 2.3); ICC of 0.1 (RR 0.95, 95% CI 0.72 to 1.24, I2=0; Analysis 2.4); ICC of 0.2 (RR 0.97, 95%CI 0.72 to 1.29, I2=0; Analysis 2.5). For blood lead levels ≥15µg/dL (0.72µmol/L), there was no statistically significant treatment benefit when meta‐analysis was adjusted for clustering: ICC 0.01 (RR 0.82, 95% CI 0.37 to 1.81, I2=45; Analysis 2.7); ICC 0.1 (RR 0.83, 95% CI 0.34 to 2.03, I2=48; Analysis 2.8); ICC 0.2 (RR 0.75, 95% CI 0.34 to 1.66, I2=25; Analysis 2.9). Thus, correcting for unit of analysis errors did not alter the overall outcome.
Soil abatement
Two studies (Weitzman 1993; Farrell 1998) performed soil abatement interventions. As no blood lead level data was available in a usable form from one study (Farrell 1998) and follow up was less than 60%, comparison was not possible. Farrell 1998 reported results as 'total effect' showing no statistical significance and no data was available for our analysis. Weitzman 1993 reported a statistically significant effect from intervention. Difference in mean change scores between the intervention group and control group A (loose interior dust abatement and paint removal) was ‐1.53 µg/dL (standard deviation (SD): 4.9) and between the intervention group and control group B (loose interior paint removal only) was ‐1.92 µg/dL (SD 5.0). No measure of variance was available for post‐treatment means or mean change scores so further analysis was not possible in our review.
Household floor dust outcomes
Dust control
One study (Hilts 1995) provided household carpet lead measures for dust control interventions. No clinically significant treatment effect was reported with geometric means for post‐treatment for dust lead level being 0.36 mg/m2 (SD 3.38) in the intervention group and 0.23 mg/m2 (SD 3.29) in the control group.
Soil abatement
No studies reported household dust lead levels for this intervention.
Combination
Cognitive and neurobehavioural outcomes
None of the included studies measured cognitive or neurobehavioural outcomes in their participants.
Blood lead level outcomes
Of the four studies that used a combination of interventions, two (Aschengrau 1998; Campbell 2011) reported continuous data, but for one study only baseline blood lead levels were reported (Campbell 2011). One study reported dichotomous data (Sterling 2004), and the fourth (Charney 1983) was clinically very different being a quasi‐randomised trial with high mean baseline blood lead levels (> 30 µg/dL (1.44 µmol/L)) and older participants (mean age 3.5 years). It was therefore not possible or appropriate to combine any of these studies.
Aschengrau 1998 reported arithmetic means for post‐treatment blood lead levels as 11.5 µg/dL (SD 3.22) in intervention group and 10.4 µg/dL (SD 3.12) in control group. An analysis of these post‐treatment scores performed in our review failed to reach statistical significance with a mean difference of 1.10 (95% CI ‐1.45 to 3.65). Sterling 2004 reported dichotomous data with four out of 10 (40%) in intervention group one; six out of 14 (43%) in intervention group two, and six out of 15 (40%) in control group having blood lead levels < 10 µg/dL (0.48 µmol/L) post treatment but this study had small numbers and less than 40% follow up. An analysis of this data performed in our review, reported as numbers of children with blood lead levels ≥10 µg/dL (0.48 µmol/L), showed no evidence of treatment effect (intervention group one (newsletters and education): RR 1.0, 95% CI 0.52 to 1.92; intervention group two (newsletters, education and specialised cleaning): RR 0.95, 95% CI 0.52 to 1.76). Charney 1983 reported a significant effect favouring treatment with arithmetic means for post‐treatment blood lead levels of 31.7 µg/dL (SD 2.6) in the intervention group and 37.8 µg/dL (SD 7.9) in the control group. Campbell 2011 reported geometric means for baseline blood lead levels only for the intervention group (2.6 µg/dL) and control group (2.7 µg/dL). A post‐treatment analysis is planned at two years follow‐up.
Household floor dust outcomes
One study (Aschengrau 1998) provided continuous data of hard floor dust lead levels for this intervention subgroup. No treatment effect was found with median changes for dust lead level being ‐0.15 µg/ft2 (SD 0.81) in the intervention group and 0.03 µg/ft2 (SD 0.23) in the control group. A second study (Campbell 2011) provided dichotomous data with no significant difference observed in the number of households with positive dust lead levels (floor > 40 µg/sq.ft.; window > 250 µg/sq.ft.) between the intervention (17/59) and control (11/51) groups at 12 months post‐treatment.
Adverse events
Few studies reported adverse events. We contacted each author to obtain further data. No significant adverse effects were reported by five studies (Hilts 1995; Farrell 1998; Rhoads 1999; Wasserman 2002; Brown 2006). Nine studies (Charney 1983; Weitzman 1993; Lanphear 1996a; Aschengrau 1998; Lanphear 1999; Jordan 2003; Sterling 2004; Boreland 2009; Campbell 2011) did not collect data about adverse events.
Cost data
Six studies provided cost data for their intervention or study. Large variations in costs were reported depending on the type of intervention and types of cost data collected. The costs of researcher and educators were often not included in the calculation. With regard to educational interventions, Brown 2006 noted that comparison families on average spent $108.78 and intervention families spent $43.01 on cleaning supplies. Wasserman 2002 reported that Medicaid paid for medical check‐ups and researchers spent $11 per blood test. With dust control interventions, Hilts 1995 reported that the entire study cost approximately $200,000 but no detailed costs for intervention was available. Boreland 2009 reported that the average cost per household was $5,000 (Australian dollars in 1994) but ranged from $1000 to $20,000. For soil abatement, Farrell 1998 estimated that the average cost per household was $1,700, with the entire study costing $5,000,000. For combination intervention, Sterling 2004 reported average cost per quarterly cleaning at $500 per household and Campbell 2011 reported median costs of Lead Hazard Control or remediation work over a 12month period of $4,656 for 42 control households and $5,512 for 36 intervention households. No cost data was available for seven studies (Charney 1983; Weitzman 1993; Lanphear 1996a; Aschengrau 1998; Lanphear 1999; Rhoads 1999; Jordan 2003).
Discussion
Prevention of lead toxicity in children is an important issue globally, particularly for disadvantaged and developing nation populations. There are many different types of educational, environmental and combination interventions that have been developed to attempt to reduce lead exposure in children and these interventions can involve large resources in terms of costs, time and personnel.
The results of this systematic review suggest that educational and dust control interventions are not effective in reducing children's blood lead levels. However, a trend (although not statistically significant) towards treatment effect for educational interventions was noted in preventing the numbers of children exceeding a threshold blood lead level of 15 µg/dL (0.72 µmol/L). Further studies on populations with substantial proportions of children that have or are at risk of these moderate blood lead levels are needed to clarify this possible benefit. For the soil abatement and combination interventions, two of the included studies reported statistically significant reductions in blood lead level for treatment groups. These results were not able to be meta‐analysed as studies used clinically distinct intervention types (soil abatement and combination).
A previous review limited to low‐cost lead hazard control interventions and including four trials, reported no substantial effect on mean blood lead concentration but noted treatment effect with dichotomous data for reducing the number of participants with blood lead levels ≥15µg/dL (Haynes 2002). Haynes 2002 differed from our review in that it combined the results of different types of interventions in a meta‐analysis. Our review did not find a statistically significant effect for participants with blood lead levels ≥15 µg/dL, although a positive trend was noted.
One study showed a statistically significant treatment effect with a combined (education and dust control) intervention (Charney 1983). As this was a quasi‐randomised controlled trial and had participants with high baseline blood lead levels (> 30µg/dL), it was clinically distinct from other included studies. The significant blood lead level reduction after intervention is consistent with previous findings that interventions are likely to have more benefit in children who had higher baseline blood lead levels (Charney 1983; Haynes 2002). This finding requires further research to assess whether or not preventive interventions are better aimed at particular populations of children. Weitzman 1993 estimated intervention effects on blood lead levels of 1.5 to 1.9 µg/dL (0.07 to 0.09 µmol/L). The clinical significance of this on an individual level is likely to be minimal but at a population level may be important. However, the generalisability or reproducibility of the results from these studies is not known. Therefore, as meta‐analysis of studies is not available, there is currently insufficient evidence to clarify whether soil abatement or combination interventions reduce blood lead levels.
Meta‐analysis was not possible for all interventions or outcomes due to clinical diversity of trials, use of different outcome measures and different forms of data reported. No more than five studies used a similar intervention and even within these intervention subgroups, the reported intervention varied significantly, for example, type of education, duration of intervention, study setting and whether or not supplies were provided. In addition, there were variations in baseline lead levels and mean age.
These issues of clinical diversity, inconsistent participant compliance with household cleaning practices, lower than optimal recruitment numbers and loss to follow‐up that reduces study power may all be contributing to the lack of clear effect demonstrated in a meta‐analysis of study results. The effectiveness of other more intensive interventions or interventions performed over a longer duration than those available to date is not yet known. Also, the trials in this review largely focus on participants from lower socioeconomic status in the USA in rental housing and as such, results may not be generalisable to different populations.
As interventions evaluated were not able to eliminate all ongoing environmental lead sources and were limited to household interventions, it is possible that recontamination occurred during the trial period. Thus, while reduction in lead‐contaminated house dust may be needed to reduce or prevent childhood lead exposure, it is not sufficient. It may be necessary to eliminate the ongoing source of lead exposure by removing or eliminating ongoing contamination from lead‐based paint and other residential lead hazards. Furthermore, other sources of lead contamination outside the home may have limited the possible benefit of interventions. Another reason for lack of treatment effect may be that the majority of included studies had a follow‐up period of 12 months or less and the long half‐life of lead in children may contaminate short‐term outcomes.
On the surface, these results may appear to be in conflict with observational studies that reported a reduction in dust lead loadings and, on average, a decrease in children's blood lead levels (Clark 2004). But the key question is whether the interim lead hazard controls or partial abatement led to a significant reduction or increase among at‐risk (i.e. younger) children who exhibit mouthing behaviours. The observational data actually show that household interventions led to a significant increase in blood lead concentration for young children, especially six‐month old infants. Compared with children over 40 months of age, the odds of having an increase in blood lead levels of 5 μg/dL or higher following abatement was 11.2 (95% CI 2.8 to 44.2) for six‐month old infants; 3.69 (95% CI 1.68 to 8.09) for 12‐month old infants; 1.79 (95% CI 1.07 to 2.99) for 18‐month old infants and; 1.18 (95% CI 0.79 to 1.76) for 24‐month old infants. These results indicate that the floor clearance levels used by the HUD grantees (< 100 or 200 μg/ft2) were insufficient to protect children. This is not surprising; there is considerable evidence that dust lead levels < 10 μg/ft2 are associated with a large increase in the risk of children having a blood lead level > 10 µg/dL (Lanphear 1996b; Lanphear 1998; Lanphear 2005b; Dixon 2009). Thus, while lead hazard controls or renovation activities can most likely be done safely if empirically‐derived dust clearance standards are required, they may actually increase young children's blood lead concentrations if we rely on obsolete standards.
It was noted that none of the studies reviewed used a standardised cognitive or neurobehavioural outcome measure despite this being one of the main adverse outcomes of lead exposure. However, in view of the magnitude of the blood lead level reductions reported in the studies with significant treatment effect, and the known correlation between blood lead level and cognition, no significant improvement in cognitive outcomes would be anticipated even if they had they been used.
Although no significant adverse outcomes were reported in the five studies with available information, nine did not report any collection of adverse events data. Future trials need to better examine and report adverse effects and ensure that sample sizes are sufficiently large to allow this. The societal impact of reducing children's blood lead concentration is considerable. If effective, residential lead hazard controls would be cost‐beneficial. Gould 2009 showed that for every dollar invested in lead hazard control, society would benefit by $17 to $220. This cost‐benefit ratio is better than that for vaccines in developed countries. When reported, the cost data showed large variability between studies but detailed data on costs of interventions would be useful to determine potential cost‐effectiveness of various types of interventions.
Study flow diagram

Comparison 1 Education, Outcome 1 Blood lead level (continuous).
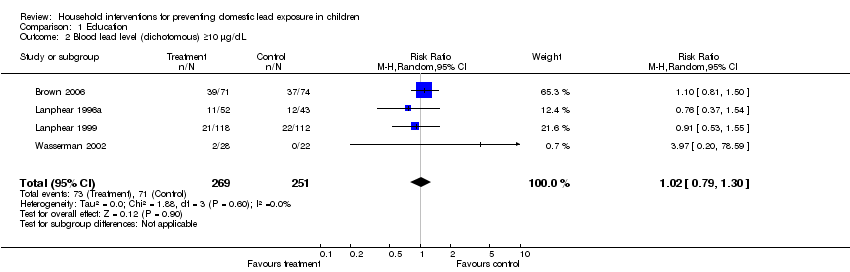
Comparison 1 Education, Outcome 2 Blood lead level (dichotomous) ≥10 µg/dL.

Comparison 1 Education, Outcome 3 Blood lead level (dichotomous) ≥15 µg/dL.
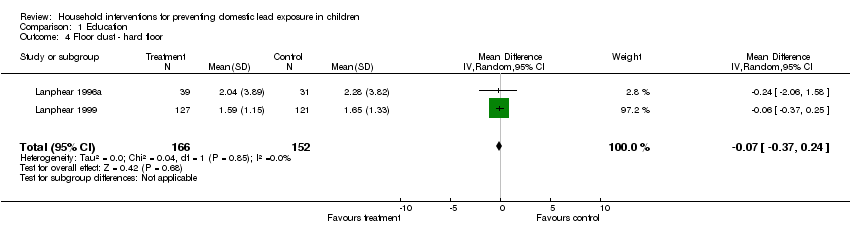
Comparison 1 Education, Outcome 4 Floor dust ‐ hard floor.

Comparison 2 Environmental ‐ Dust control, Outcome 1 Blood lead level (continuous).
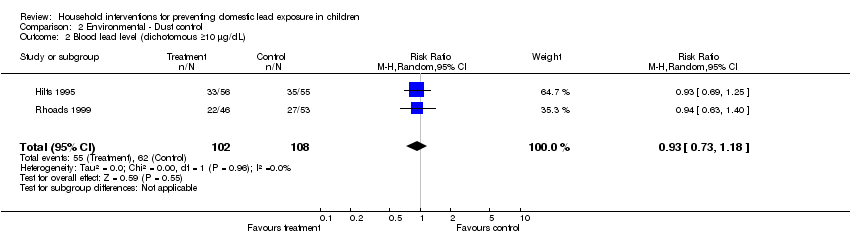
Comparison 2 Environmental ‐ Dust control, Outcome 2 Blood lead level (dichotomous ≥10 µg/dL).

Comparison 2 Environmental ‐ Dust control, Outcome 3 Blood lead level (dichotomous ≥10 µg/dL) ICC 0.01.

Comparison 2 Environmental ‐ Dust control, Outcome 4 Blood lead level (dichotomous ≥10 µg/dL) ICC 0.1.

Comparison 2 Environmental ‐ Dust control, Outcome 5 Blood lead level (dichotomous ≥10 µg/dL) ICC 0.2.
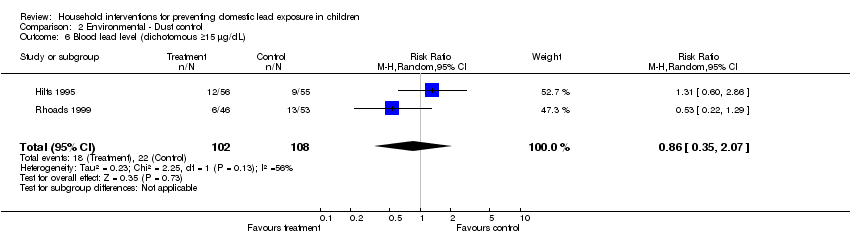
Comparison 2 Environmental ‐ Dust control, Outcome 6 Blood lead level (dichotomous ≥15 µg/dL).

Comparison 2 Environmental ‐ Dust control, Outcome 7 Blood lead level (dichotomous ≥15 µg/dL) ICC 0.01.
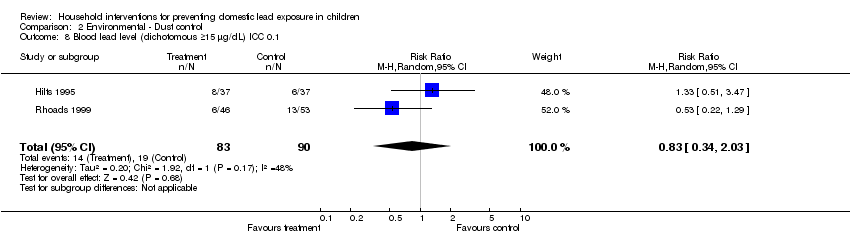
Comparison 2 Environmental ‐ Dust control, Outcome 8 Blood lead level (dichotomous ≥15 µg/dL) ICC 0.1.

Comparison 2 Environmental ‐ Dust control, Outcome 9 Blood lead level (dichotomous ≥15 µg/dL) ICC 0.2.
| Education strategies for preventing domestic lead exposure in children | ||||||
| Patient or population: Children | ||||||
| Outcomes | Illustrative comparative risks* (95% CI) | Relative effect | No of Participants | Quality of the evidence | Comments | |
| Assumed risk | Corresponding risk | |||||
| Regular environment | Education strategies for prevention of domestic lead exposure | |||||
| Blood lead level (continuous) | The mean blood lead level (continuous) ranged across control groups from | The mean blood lead level (continuous) in the intervention groups was | 814 | ⊕⊕⊕⊕ | ||
| Blood lead level (dichotomous) ≥ 10 µg/dL | Medium risk population3 | RR 1.02 | 520 | ⊕⊕⊕⊝ | ||
| 238 per 10004 | 243 per 1000 | |||||
| Blood lead level (dichotomous) ≥ 15 µg/dL | Medium risk population3 | RR 0.6 | 520 | ⊕⊕⊕⊝ | ||
| 110 per 10004 | 66 per 1000 | |||||
| Floor dust ‐ hard floor (continuous) Scale from: 0 to 40 | The mean floor dust level ‐ hard floor ‐ ranged across control groups from | The mean floor dust level ‐ hard floor ‐ in the intervention groups was | 318 | ⊕⊕⊕⊝ | ||
| Cognitive and neurobehavioural outcomes ‐ not reported | See comment | See comment | Not estimable | ‐ | See comment | |
| *The basis for the assumed risk (e.g. the median control group risk across studies) is provided in footnotes. The corresponding risk (and its 95% confidence interval) is based on the assumed risk in the comparison group and the relative effect of the intervention (and its 95% CI). | ||||||
| GRADE Working Group grades of evidence | ||||||
| 1 Change in blood lead level | ||||||
| Environmental strategies (dust control) for preventing domestic lead exposure in children | ||||||
| Patient or population: Children | ||||||
| Outcomes | Illustrative comparative risks* (95% CI) | Relative effect | No of Participants | Quality of the evidence | Comments | |
| Assumed risk | Corresponding risk | |||||
| Control | Environmental strategies (Dust Control) | |||||
| Blood lead level (continuous) | The mean blood lead level (continuous) ranged across control groups from | The mean blood lead level (continuous) in the intervention groups was | 298 | ⊕⊕⊕⊝ | ||
| Blood lead level (dichotomous ≥ 10 µg/dL) | Medium risk population3 | RR 0.93 | 210 | ⊕⊕⊕⊝ | ||
| 573 per 10004 | 533 per 1000 | |||||
| Blood lead level (dichotomous ≥ 15 µg/dL) | Medium risk population3 | RR 0.86 | 210 | ⊕⊕⊕⊝ | ||
| 205 per 10004 | 176 per 1000 | |||||
| Cognitive and neurobehavioural outcomes ‐ not reported | See comment | See comment | Not estimable | ‐ | See comment | |
| *The basis for the assumed risk (e.g. the median control group risk across studies) is provided in footnotes. The corresponding risk (and its 95% confidence interval) is based on the assumed risk in the comparison group and the relative effect of the intervention (and its 95% CI). | ||||||
| GRADE Working Group grades of evidence | ||||||
| 1 Change in blood lead level | ||||||
| Study ID | Aschengrau 1998 | Boreland 2009 | Brown 2006 | Campbell 2011 | Charney 1983 | Farrell 1998 | Hilts 1995 | Jordan 2003 | Lanphear 1996 | Lanphear 1999 | Rhoads 1999 | Sterling 2004 | Wasserman 2002 | Weitzman 1993 |
| Mean blood lead level at baseline (µg/dL) | 15‐19 | 15‐19 | 15‐19 | 2.6‐2.7 | >20 | 10‐14 | 10‐14 | <10
| <10 | <10 | 10‐14 | 10‐14 | <10 | 10‐14 |
| Mean age at baseline (months) | 24‐36 | > 36 | 12‐24 | 8‐14 | > 36 | 6‐72 | 24‐36 | <12 | 12‐24 | <12 | 12‐24 | > 36 | 12‐24 | 24‐36 |
| Study ID | Education | Dust control | Soil abatement | Combination |
| Aschengrau 1998 | Yes | |||
| Boreland 2009 | Yes | |||
| Brown 2006 | Yes | |||
| Campbell 2011 | Yes | |||
| Charney 1983 | Yes | |||
| Farrell 1998 | Yes | |||
| Hilts 1995 | Yes | |||
| Jordan 2003 | Yes | |||
| Lanphear 1996 | Yes | |||
| Lanphear 1999 | Yes | |||
| Rhoads 1999 | Yes | |||
| Sterling 2004 | Yes | |||
| Wasserman 2002 | Yes | |||
| Weitzman 1993 | Yes |
| Study ID | Blood lead ‐ continuous | Blood lead ‐ dichotomous | Hard floor lead | Carpet lead | Other |
| Aschengrau 1998 | Yes | Yes | |||
| Boreland 2009 | Yes | ||||
| Brown 2006 | Yes | Yes | Parent‐Child Interaction scale | ||
| Campbell 2011 | Yes | Yes | Chicago Parents Knowledge Test | ||
| Charney 1983 | Yes | Yes | |||
| Farrell 1998 | Total effect (blood lead levels) | ||||
| Hilts 1995 | Yes | Yes | Yes | ||
| Jordan 2003 | Yes | ||||
| Lanphear 1996 | Yes | Yes | Yes | Yes | |
| Lanphear 1999 | Yes | Yes | Yes | Yes | |
| Rhoads 1999 | Yes | Yes | Maternal knowledge lead poisoning | ||
| Sterling 2004 | Yes | ||||
| Wasserman 2002 | Yes | Yes | Chicago Parents Knowledge Test | ||
| Weitzman 1993 | Yes |
| Outcome or subgroup title | No. of studies | No. of participants | Statistical method | Effect size |
| 1 Blood lead level (continuous) Show forest plot | 5 | 815 | Mean Difference (IV, Random, 95% CI) | 0.02 [‐0.09, 0.12] |
| 2 Blood lead level (dichotomous) ≥10 µg/dL Show forest plot | 4 | 520 | Risk Ratio (M‐H, Random, 95% CI) | 1.02 [0.79, 1.30] |
| 3 Blood lead level (dichotomous) ≥15 µg/dL Show forest plot | 4 | 520 | Risk Ratio (M‐H, Random, 95% CI) | 0.60 [0.33, 1.09] |
| 4 Floor dust ‐ hard floor Show forest plot | 2 | 318 | Mean Difference (IV, Random, 95% CI) | ‐0.07 [‐0.37, 0.24] |
| Outcome or subgroup title | No. of studies | No. of participants | Statistical method | Effect size |
| 1 Blood lead level (continuous) Show forest plot | 3 | 298 | Mean Difference (IV, Random, 95% CI) | ‐0.15 [‐0.42, 0.11] |
| 2 Blood lead level (dichotomous ≥10 µg/dL) Show forest plot | 2 | 210 | Risk Ratio (M‐H, Random, 95% CI) | 0.93 [0.73, 1.18] |
| 3 Blood lead level (dichotomous ≥10 µg/dL) ICC 0.01 Show forest plot | 2 | 204 | Risk Ratio (M‐H, Random, 95% CI) | 0.93 [0.73, 1.18] |
| 4 Blood lead level (dichotomous ≥10 µg/dL) ICC 0.1 Show forest plot | 2 | 173 | Risk Ratio (M‐H, Random, 95% CI) | 0.95 [0.72, 1.24] |
| 5 Blood lead level (dichotomous ≥10 µg/dL) ICC 0.2 Show forest plot | 2 | 155 | Risk Ratio (M‐H, Random, 95% CI) | 0.97 [0.72, 1.29] |
| 6 Blood lead level (dichotomous ≥15 µg/dL) Show forest plot | 2 | 210 | Risk Ratio (M‐H, Random, 95% CI) | 0.86 [0.35, 2.07] |
| 7 Blood lead level (dichotomous ≥15 µg/dL) ICC 0.01 Show forest plot | 2 | 204 | Risk Ratio (M‐H, Random, 95% CI) | 0.82 [0.37, 1.81] |
| 8 Blood lead level (dichotomous ≥15 µg/dL) ICC 0.1 Show forest plot | 2 | 173 | Risk Ratio (M‐H, Random, 95% CI) | 0.83 [0.34, 2.03] |
| 9 Blood lead level (dichotomous ≥15 µg/dL) ICC 0.2 Show forest plot | 2 | 155 | Risk Ratio (M‐H, Random, 95% CI) | 0.75 [0.34, 1.66] |