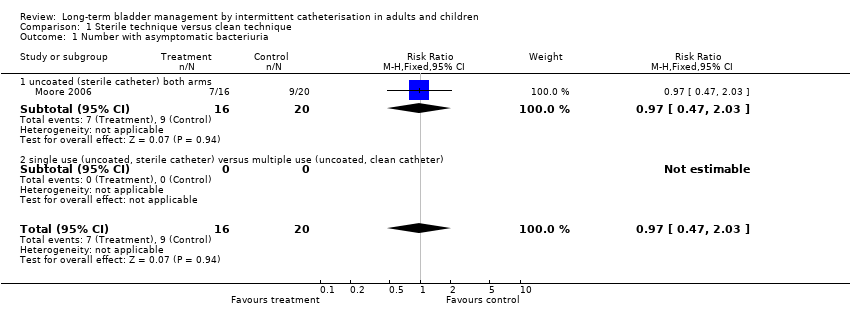
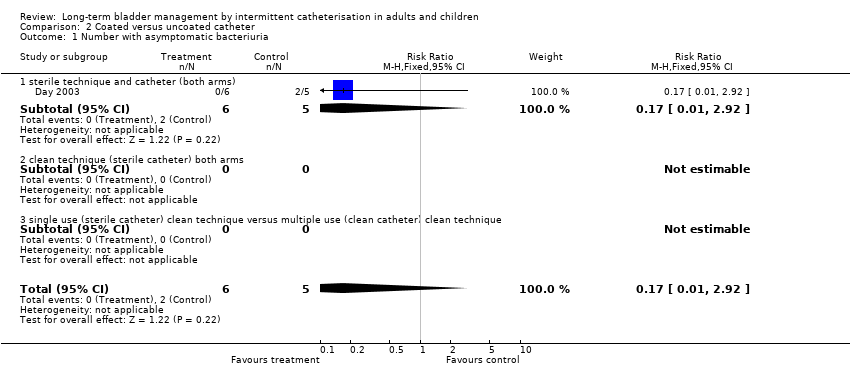
| 1 Number with asymptomatic bacteriuria Show forest plot | 1 | 66 | Risk Ratio (M‐H, Fixed, 95% CI) | 1.06 [0.66, 1.72] |
|
| 1.1 uncoated catheter, clean technique (both arms) | 1 | 66 | Risk Ratio (M‐H, Fixed, 95% CI) | 1.06 [0.66, 1.72] |
| 1.2 coated versus uncoated (clean technique both arms) | 0 | 0 | Risk Ratio (M‐H, Fixed, 95% CI) | 0.0 [0.0, 0.0] |
| 1.3 sterile technique versus clean technique (uncoated catheter both arms) | 0 | 0 | Risk Ratio (M‐H, Fixed, 95% CI) | 0.0 [0.0, 0.0] |
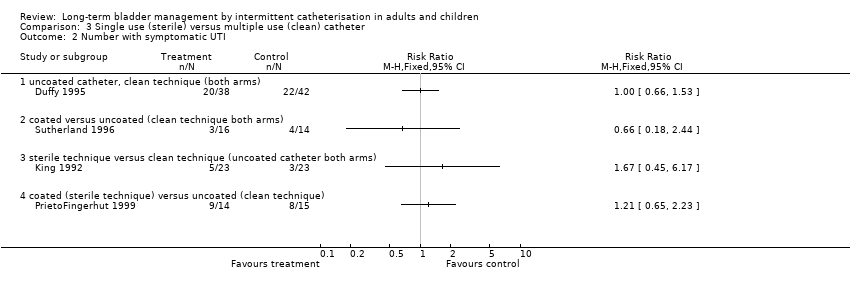
| 2 Number with symptomatic UTI Show forest plot | 4 | | Risk Ratio (M‐H, Fixed, 95% CI) | Totals not selected |
|
| 2.1 uncoated catheter, clean technique (both arms) | 1 | | Risk Ratio (M‐H, Fixed, 95% CI) | 0.0 [0.0, 0.0] |
| 2.2 coated versus uncoated (clean technique both arms) | 1 | | Risk Ratio (M‐H, Fixed, 95% CI) | 0.0 [0.0, 0.0] |
| 2.3 sterile technique versus clean technique (uncoated catheter both arms) | 1 | | Risk Ratio (M‐H, Fixed, 95% CI) | 0.0 [0.0, 0.0] |
| 2.4 coated (sterile technique) versus uncoated (clean technique) | 1 | | Risk Ratio (M‐H, Fixed, 95% CI) | 0.0 [0.0, 0.0] |
| 3 Number with urethral trauma/bleeding | 0 | 0 | Risk Ratio (M‐H, Fixed, 95% CI) | 0.0 [0.0, 0.0] |
| 3.1 uncoated catheter, clean technique (both arms) | 0 | 0 | Risk Ratio (M‐H, Fixed, 95% CI) | 0.0 [0.0, 0.0] |
| 3.2 coated versus uncoated (clean technique both arms) | 0 | 0 | Risk Ratio (M‐H, Fixed, 95% CI) | 0.0 [0.0, 0.0] |
| 3.3 sterile technique versus clean technique (uncoated catheter both arms) | 0 | 0 | Risk Ratio (M‐H, Fixed, 95% CI) | 0.0 [0.0, 0.0] |
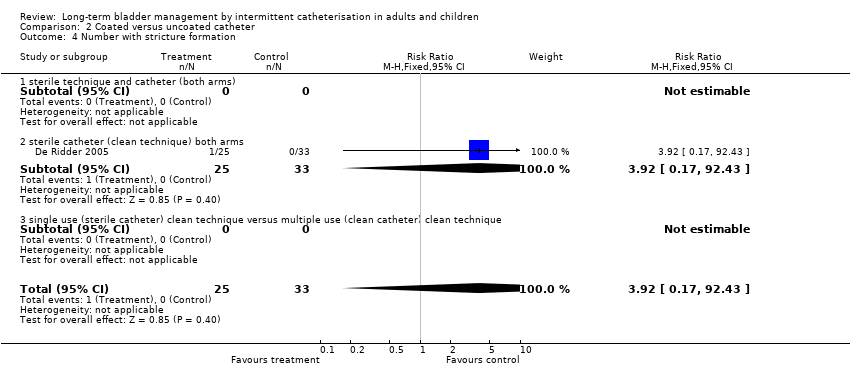
| 4 Number with stricture formation | 0 | 0 | Risk Ratio (M‐H, Fixed, 95% CI) | 0.0 [0.0, 0.0] |
| 4.1 uncoated catheter, clean technique (both arms) | 0 | 0 | Risk Ratio (M‐H, Fixed, 95% CI) | 0.0 [0.0, 0.0] |
| 4.2 coated versus uncoated (clean technique both arms) | 0 | 0 | Risk Ratio (M‐H, Fixed, 95% CI) | 0.0 [0.0, 0.0] |
| 4.3 sterile technique versus clean technique (uncoated catheter both arms) | 0 | 0 | Risk Ratio (M‐H, Fixed, 95% CI) | 0.0 [0.0, 0.0] |
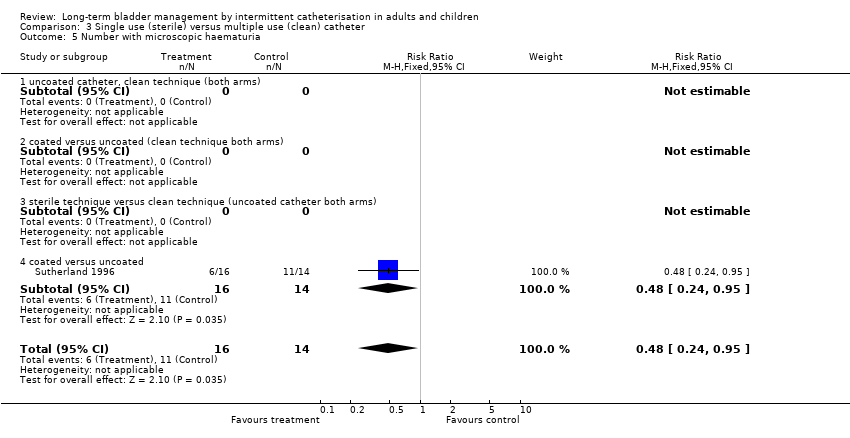
| 5 Number with microscopic haematuria Show forest plot | 1 | 30 | Risk Ratio (M‐H, Fixed, 95% CI) | 0.48 [0.24, 0.95] |
|
| 5.1 uncoated catheter, clean technique (both arms) | 0 | 0 | Risk Ratio (M‐H, Fixed, 95% CI) | 0.0 [0.0, 0.0] |
| 5.2 coated versus uncoated (clean technique both arms) | 0 | 0 | Risk Ratio (M‐H, Fixed, 95% CI) | 0.0 [0.0, 0.0] |
| 5.3 sterile technique versus clean technique (uncoated catheter both arms) | 0 | 0 | Risk Ratio (M‐H, Fixed, 95% CI) | 0.0 [0.0, 0.0] |
| 5.4 coated versus uncoated | 1 | 30 | Risk Ratio (M‐H, Fixed, 95% CI) | 0.48 [0.24, 0.95] |
| 6 Number with urethritis, epididymitis, or orchitis | 0 | 0 | Risk Ratio (M‐H, Fixed, 95% CI) | 0.0 [0.0, 0.0] |
| 6.1 uncoated catheter, clean technique (both arms) | 0 | 0 | Risk Ratio (M‐H, Fixed, 95% CI) | 0.0 [0.0, 0.0] |
| 6.2 coated versus uncoated (clean technique both arms) | 0 | 0 | Risk Ratio (M‐H, Fixed, 95% CI) | 0.0 [0.0, 0.0] |
| 6.3 sterile technique versus clean technique (uncoated catheter both arms) | 0 | 0 | Risk Ratio (M‐H, Fixed, 95% CI) | 0.0 [0.0, 0.0] |
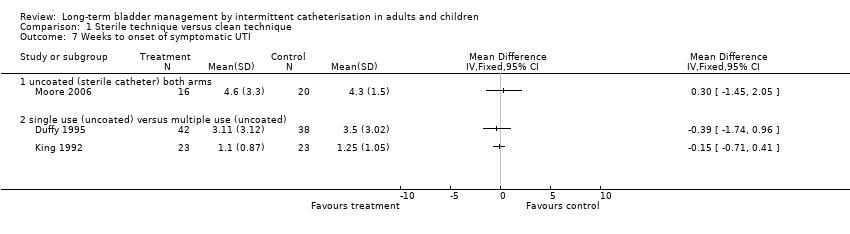
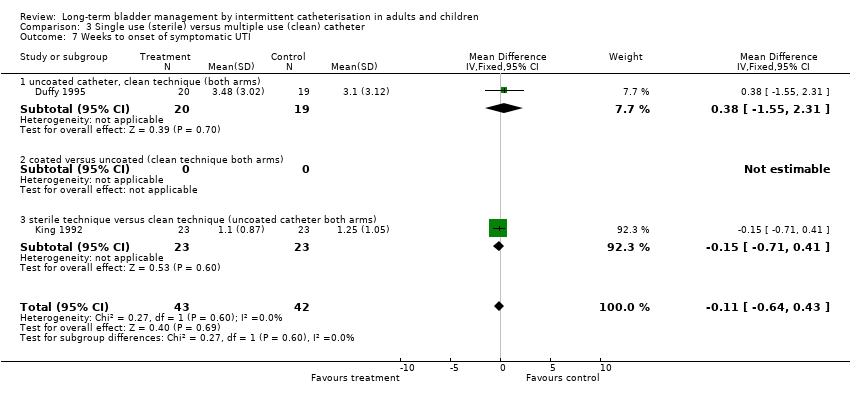
| 7 Weeks to onset of symptomatic UTI Show forest plot | 2 | 85 | Mean Difference (IV, Fixed, 95% CI) | ‐0.11 [‐0.64, 0.43] |
|
| 7.1 uncoated catheter, clean technique (both arms) | 1 | 39 | Mean Difference (IV, Fixed, 95% CI) | 0.38 [‐1.55, 2.31] |
| 7.2 coated versus uncoated (clean technique both arms) | 0 | 0 | Mean Difference (IV, Fixed, 95% CI) | 0.0 [0.0, 0.0] |
| 7.3 sterile technique versus clean technique (uncoated catheter both arms) | 1 | 46 | Mean Difference (IV, Fixed, 95% CI) | ‐0.15 [‐0.71, 0.41] |
| 8 Number reporting satisfaction with catheter product | 0 | 0 | Risk Ratio (M‐H, Fixed, 95% CI) | 0.0 [0.0, 0.0] |
| 8.1 uncoated catheter, clean technique (both arms) | 0 | 0 | Risk Ratio (M‐H, Fixed, 95% CI) | 0.0 [0.0, 0.0] |
| 8.2 coated versus uncoated (clean technique both arms) | 0 | 0 | Risk Ratio (M‐H, Fixed, 95% CI) | 0.0 [0.0, 0.0] |
| 8.3 sterile technique versus clean technique (uncoated catheter both arms) | 0 | 0 | Risk Ratio (M‐H, Fixed, 95% CI) | 0.0 [0.0, 0.0] |
| 9 Number reporting comfort and ease of insertion | 0 | 0 | Risk Ratio (M‐H, Fixed, 95% CI) | 0.0 [0.0, 0.0] |
| 9.1 uncoated catheter, clean technique (both arms) | 0 | 0 | Risk Ratio (M‐H, Fixed, 95% CI) | 0.0 [0.0, 0.0] |
| 9.2 coated versus uncoated (clean technique both arms) | 0 | 0 | Risk Ratio (M‐H, Fixed, 95% CI) | 0.0 [0.0, 0.0] |
| 9.3 sterile technique versus clean technique (uncoated catheter both arms) | 0 | 0 | Risk Ratio (M‐H, Fixed, 95% CI) | 0.0 [0.0, 0.0] |
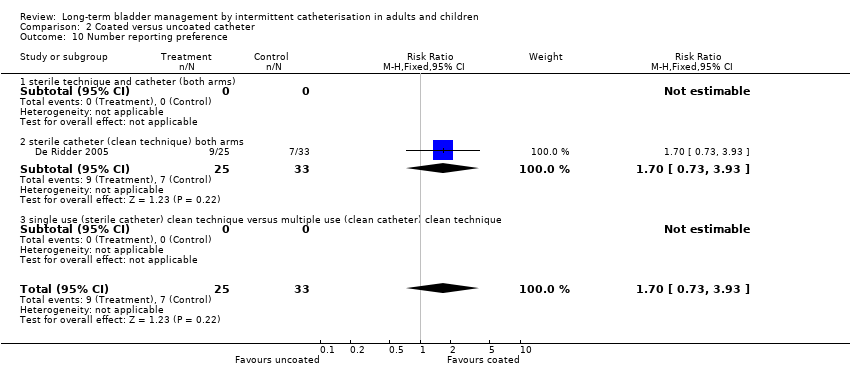
| 10 Number reporting preference | 0 | 0 | Risk Ratio (M‐H, Fixed, 95% CI) | 0.0 [0.0, 0.0] |
| 10.1 uncoated catheter, clean technique (both arms) | 0 | 0 | Risk Ratio (M‐H, Fixed, 95% CI) | 0.0 [0.0, 0.0] |
| 10.2 coated versus uncoated (clean technique both arms) | 0 | 0 | Risk Ratio (M‐H, Fixed, 95% CI) | 0.0 [0.0, 0.0] |
| 10.3 sterile technique versus clean technique (uncoated catheter both arms) | 0 | 0 | Risk Ratio (M‐H, Fixed, 95% CI) | 0.0 [0.0, 0.0] |
| 10.4 coated versus uncoated | 0 | 0 | Risk Ratio (M‐H, Fixed, 95% CI) | 0.0 [0.0, 0.0] |
| 11 Preference score Show forest plot | 1 | 30 | Mean Difference (IV, Fixed, 95% CI) | ‐1.60 [‐3.57, 0.37] |
|
| 11.1 uncoated catheter, clean technique (both arms) | 0 | 0 | Mean Difference (IV, Fixed, 95% CI) | 0.0 [0.0, 0.0] |
| 11.2 coated versus uncoated (clean technique both arms) | 1 | 30 | Mean Difference (IV, Fixed, 95% CI) | ‐1.60 [‐3.57, 0.37] |