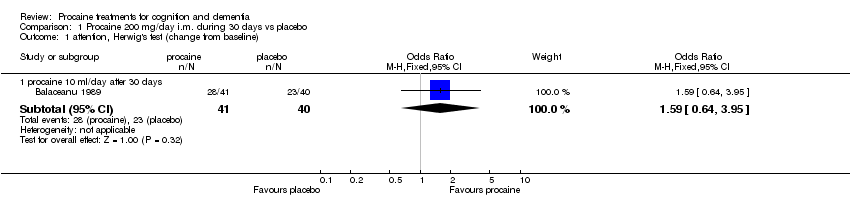
| 1 attention, Herwig's test (change from baseline) Show forest plot | 1 | | Odds Ratio (M‐H, Fixed, 95% CI) | Subtotals only |
|
| 1.1 procaine 10 ml/day after 30 days | 1 | 81 | Odds Ratio (M‐H, Fixed, 95% CI) | 1.59 [0.64, 3.95] |
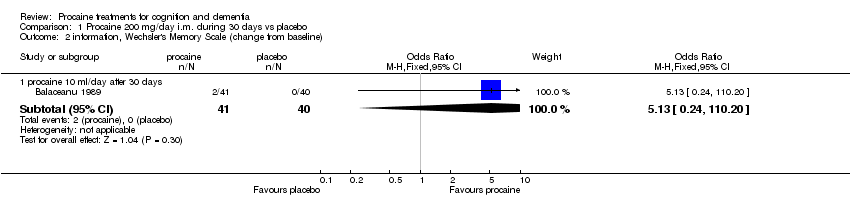
| 2 information, Wechsler's Memory Scale (change from baseline) Show forest plot | 1 | | Odds Ratio (M‐H, Fixed, 95% CI) | Subtotals only |
|
| 2.1 procaine 10 ml/day after 30 days | 1 | 81 | Odds Ratio (M‐H, Fixed, 95% CI) | 5.13 [0.24, 110.20] |
| 3 orientation, Wechsler's Memory Scale (change from baseline) Show forest plot | 1 | | Odds Ratio (M‐H, Fixed, 95% CI) | Subtotals only |
|
| 3.1 procaine 10 ml/day after 30 days | 1 | 81 | Odds Ratio (M‐H, Fixed, 95% CI) | 3.0 [0.12, 75.85] |
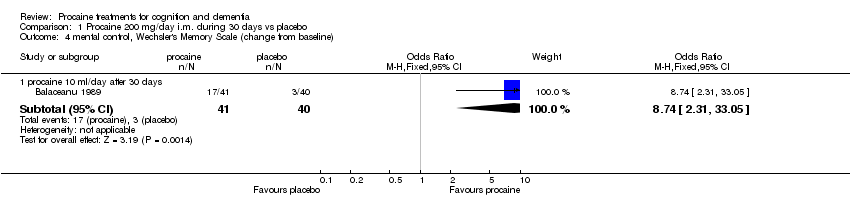
| 4 mental control, Wechsler's Memory Scale (change from baseline) Show forest plot | 1 | | Odds Ratio (M‐H, Fixed, 95% CI) | Subtotals only |
|
| 4.1 procaine 10 ml/day after 30 days | 1 | 81 | Odds Ratio (M‐H, Fixed, 95% CI) | 8.74 [2.31, 33.05] |
| 5 immediate logic recall, Wechsler's Memory Scale (change from baseline) Show forest plot | 1 | | Odds Ratio (M‐H, Fixed, 95% CI) | Subtotals only |
|
| 5.1 procaine 10 ml/day after 30 days | 1 | 81 | Odds Ratio (M‐H, Fixed, 95% CI) | 2.40 [0.98, 5.93] |
| 6 digit memory, Wechsler's Memory Scale (change from baseline) Show forest plot | 1 | | Odds Ratio (M‐H, Fixed, 95% CI) | Subtotals only |
|
| 6.1 procaine 10 ml/day after 30 days | 1 | 81 | Odds Ratio (M‐H, Fixed, 95% CI) | 18.11 [2.24, 146.55] |
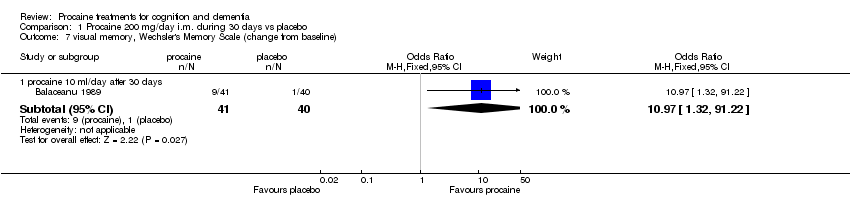
| 7 visual memory, Wechsler's Memory Scale (change from baseline) Show forest plot | 1 | | Odds Ratio (M‐H, Fixed, 95% CI) | Subtotals only |
|
| 7.1 procaine 10 ml/day after 30 days | 1 | 81 | Odds Ratio (M‐H, Fixed, 95% CI) | 10.97 [1.32, 91.22] |
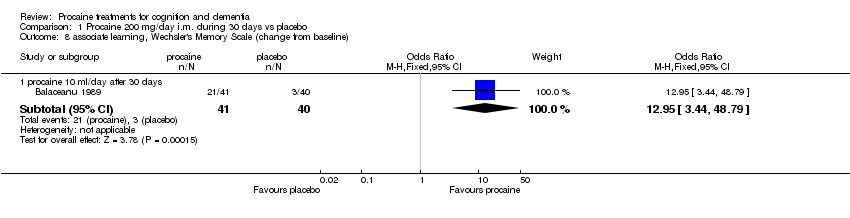
| 8 associate learning, Wechsler's Memory Scale (change from baseline) Show forest plot | 1 | | Odds Ratio (M‐H, Fixed, 95% CI) | Subtotals only |
|
| 8.1 procaine 10 ml/day after 30 days | 1 | 81 | Odds Ratio (M‐H, Fixed, 95% CI) | 12.95 [3.44, 48.79] |
| 9 memory quotient, Wechsler's Memory Scale (change from baseline) Show forest plot | 1 | | Odds Ratio (M‐H, Fixed, 95% CI) | Subtotals only |
|
| 9.1 procaine 10 ml/day after 30 days | 1 | 81 | Odds Ratio (M‐H, Fixed, 95% CI) | 12.71 [3.81, 42.42] |
| 10 intelligence ‐ Kohs cubes test (change from baseline) Show forest plot | 1 | | Odds Ratio (M‐H, Fixed, 95% CI) | Subtotals only |
|
| 10.1 procaine 10 ml/day after 30 days | 1 | 81 | Odds Ratio (M‐H, Fixed, 95% CI) | 0.97 [0.31, 3.07] |
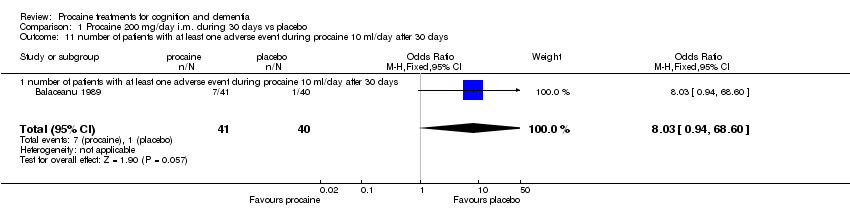
| 11 number of patients with at least one adverse event during procaine 10 ml/day after 30 days Show forest plot | 1 | 81 | Odds Ratio (M‐H, Fixed, 95% CI) | 8.03 [0.94, 68.60] |
|
| 11.1 number of patients with at least one adverse event during procaine 10 ml/day after 30 days | 1 | 81 | Odds Ratio (M‐H, Fixed, 95% CI) | 8.03 [0.94, 68.60] |