Tratamientos con procaína para la cognición y la demencia
Referencias
Referencias de los estudios incluidos en esta revisión
Referencias de los estudios excluidos de esta revisión
Referencias adicionales
Characteristics of studies
Characteristics of included studies [ordered by study ID]
Ir a:
| Methods | Double‐blind, placebo‐controlled, randomized, method of randomization not detailed. | |
| Participants | Aging persons free of neuropsychiatric pathology from the Romanian National Institute of Gerontology and Geriatrics. Procaine group: 41 patients (25 women and 16 men), mean age: 71.9 years. Placebo group: 40 patients (28 women and 12 men), mean age: 71.3 years. | |
| Interventions | Gerovital H3 or saline solution 2 x 5 ml per day i.m. during 30 days | |
| Outcomes | Psychomotor capacity, Herwig's attention test, Wechsler's Memory scale, Kohs cubes intelligence test | |
| Notes | No details about extracerebral diseases. Adverse effects reported. | |
| Risk of bias | ||
| Bias | Authors' judgement | Support for judgement |
| Adequate sequence generation? | Unclear risk | Not detailed |
| Allocation concealment? | Unclear risk | Unclear |
| Blinding? | Unclear risk | Not detailed |
| Incomplete outcome data addressed? | Low risk | |
| Free of selective reporting? | Low risk | |
| Free of other bias? | Unclear risk | The study was too short, no data about follow up |
| Methods | Double‐blind, placebo‐controlled, randomized, method of randomization not detailed. | |
| Participants | Moderate or advanced senile or arterioslerotic dementia. | |
| Interventions | gerioptil or placebo, a number of 12 injections i.m. during 1 month | |
| Outcomes | Wechsler's memory test | |
| Notes | No criteria for dementia. | |
| Risk of bias | ||
| Bias | Authors' judgement | Support for judgement |
| Adequate sequence generation? | Unclear risk | Not detailed |
| Allocation concealment? | Unclear risk | Unclear |
| Blinding? | Unclear risk | Not sufficiently detailed |
| Incomplete outcome data addressed? | Low risk | |
| Free of selective reporting? | Low risk | |
| Free of other bias? | Unclear risk | Short study with small number of patients, no follow up |
| Methods | Double‐blind, placebo‐controlled, randomized, method of randomization not detailed. | |
| Participants | So‐called "healthy elderly, fit enough to go through tests" | |
| Interventions | KH3 (procaine/haematoporphyrin) or placebo 1 x 50 mg/day per os for 2 years | |
| Outcomes | Recall and recognition of familiar material | |
| Notes | There were clinical and laboratory abnormalities at screening and baseline: electrocardiographic abnormalities 45%, blood haemoglobin concentration of less than 12 g/dl in 6% and history of stroke: 4%, angina or intermittent claudication: 16%. | |
| Risk of bias | ||
| Bias | Authors' judgement | Support for judgement |
| Adequate sequence generation? | Unclear risk | Insufficiently detailed |
| Allocation concealment? | Unclear risk | Unclear |
| Blinding? | Unclear risk | Insufficiently detailed |
| Incomplete outcome data addressed? | Low risk | |
| Free of selective reporting? | Unclear risk | Only side effects causing withdrawals were reported |
| Free of other bias? | Low risk | |
| Methods | Same study as Hall 1983, this is the detailed unpublished report of the trial | |
| Participants | So‐called "healthy elderly, fit enough to go through tests" | |
| Interventions | KH3 (procaine/haematoporphyrin) or placebo 1 x 50 mg/day for 2 years | |
| Outcomes | Recall and recognition of familiar material | |
| Notes | There were clinical and laboratory abnormalities at screening and baseline: electrocardiographic abnormalities 45%, blood haemoglobin concentration of less than 12 g/dl in 6% and history of stroke: 4%, angina or intermittent claudication: 16%. | |
| Risk of bias | ||
| Bias | Authors' judgement | Support for judgement |
| Adequate sequence generation? | Unclear risk | Insufficiently detailed |
| Allocation concealment? | Unclear risk | Unclear |
| Blinding? | Unclear risk | Insufficiently detailed |
| Incomplete outcome data addressed? | Low risk | |
| Free of selective reporting? | Unclear risk | Only side effects causing withdrawals were reported |
| Free of other bias? | Low risk | |
Characteristics of excluded studies [ordered by study ID]
Ir a:
| Study | Reason for exclusion |
| Randomized, double blind study comparing two procaine preparations. The study evaluates the effects of the additives and not of procaine. | |
| Double blind, placebo controlled study performed in children with mental deficiency. | |
| RCT but heterogenous groups with diverse diseases (cerebral haemorrhage, cerebral arteriosclerosis, Parkinsonism, rheumatoid arthritis, diabetes mellitus, old breast carcinoma, senile dementia), subgroup analysis not possible. | |
| Not randomized, double blind, placebo controlled study | |
| Double blind, placebo controlled trial including physically infirm residents in an elderly home. | |
| Not RCT, elderly hospitalized patients with a history of arteriosclerosis or degenerative arthritis. | |
| Randomized, double blind, placebo controlled trial but heterogeneous groups with diverse diseases (cerebral thrombosis, Parkinson's disease, pseudobulbar palsy, senile dementia, rheumatoid arthritis, congestive cardiac failure etc.). | |
| Not RCT, patients with diverse diseases, cognitive functions not tested. | |
| Randomized, double blind, placebo controlled trial but heterogeneous group with diverse, multiple diseases (arteriosclerotic heart disease, peripheral arteriosclerosis obliterans, residuals of cerebrovascular accidents, peptic ulcer, osteoarthritis, emphysema, visual and auditory impairment, intellectual deterioration). Subgroup analysis was not possible. | |
| Review of procaine studies | |
| Randomized, double blind, placebo controlled trial, including heterogeneous groups of disoriented psychiatric patients. No criteria for cognitive impairment or dementia. There was a 45% loss of patients from follow up during the study. | |
| Not randomized, double blind, placebo controlled study on white, female, geriatric, psychiatric patients. Evaluation of cognitive functions not detailed. | |
| RCT, but patient population is of depression, no cognitive tests. | |
| Review of procaine studies | |
| Not randomized, double blind, placebo controlled study | |
| Not randomized, not double blind, controlled study for lipid‐lowering effects | |
| Open study for depression in elderly | |
| Double blind, placebo controlled study, randomization by alternation (category C, inadequate), heterogeneous group of geriatric patients with "arthritis, nervous disorders and senile mental disturbances" | |
| RCT, healthy volunteers, subjective assessment of 36 symptoms, cognitive functions not tested. | |
| Not randomized, double blind, placebo controlled study on arteriosclerotic cardiovascular and cerebrovascular patients | |
| Not randomized, double blind, placebo controlled, small study in hospitalized geriatric patients with organic brain dysfunction |
Data and analyses
| Outcome or subgroup title | No. of studies | No. of participants | Statistical method | Effect size |
| 1 attention, Herwig's test (change from baseline) Show forest plot | 1 | Odds Ratio (M‐H, Fixed, 95% CI) | Subtotals only | |
| Analysis 1.1  Comparison 1 Procaine 200 mg/day i.m. during 30 days vs placebo, Outcome 1 attention, Herwig's test (change from baseline). | ||||
| 1.1 procaine 10 ml/day after 30 days | 1 | 81 | Odds Ratio (M‐H, Fixed, 95% CI) | 1.59 [0.64, 3.95] |
| 2 information, Wechsler's Memory Scale (change from baseline) Show forest plot | 1 | Odds Ratio (M‐H, Fixed, 95% CI) | Subtotals only | |
| Analysis 1.2  Comparison 1 Procaine 200 mg/day i.m. during 30 days vs placebo, Outcome 2 information, Wechsler's Memory Scale (change from baseline). | ||||
| 2.1 procaine 10 ml/day after 30 days | 1 | 81 | Odds Ratio (M‐H, Fixed, 95% CI) | 5.13 [0.24, 110.20] |
| 3 orientation, Wechsler's Memory Scale (change from baseline) Show forest plot | 1 | Odds Ratio (M‐H, Fixed, 95% CI) | Subtotals only | |
| Analysis 1.3  Comparison 1 Procaine 200 mg/day i.m. during 30 days vs placebo, Outcome 3 orientation, Wechsler's Memory Scale (change from baseline). | ||||
| 3.1 procaine 10 ml/day after 30 days | 1 | 81 | Odds Ratio (M‐H, Fixed, 95% CI) | 3.0 [0.12, 75.85] |
| 4 mental control, Wechsler's Memory Scale (change from baseline) Show forest plot | 1 | Odds Ratio (M‐H, Fixed, 95% CI) | Subtotals only | |
| Analysis 1.4  Comparison 1 Procaine 200 mg/day i.m. during 30 days vs placebo, Outcome 4 mental control, Wechsler's Memory Scale (change from baseline). | ||||
| 4.1 procaine 10 ml/day after 30 days | 1 | 81 | Odds Ratio (M‐H, Fixed, 95% CI) | 8.74 [2.31, 33.05] |
| 5 immediate logic recall, Wechsler's Memory Scale (change from baseline) Show forest plot | 1 | Odds Ratio (M‐H, Fixed, 95% CI) | Subtotals only | |
| Analysis 1.5  Comparison 1 Procaine 200 mg/day i.m. during 30 days vs placebo, Outcome 5 immediate logic recall, Wechsler's Memory Scale (change from baseline). | ||||
| 5.1 procaine 10 ml/day after 30 days | 1 | 81 | Odds Ratio (M‐H, Fixed, 95% CI) | 2.40 [0.98, 5.93] |
| 6 digit memory, Wechsler's Memory Scale (change from baseline) Show forest plot | 1 | Odds Ratio (M‐H, Fixed, 95% CI) | Subtotals only | |
| Analysis 1.6  Comparison 1 Procaine 200 mg/day i.m. during 30 days vs placebo, Outcome 6 digit memory, Wechsler's Memory Scale (change from baseline). | ||||
| 6.1 procaine 10 ml/day after 30 days | 1 | 81 | Odds Ratio (M‐H, Fixed, 95% CI) | 18.11 [2.24, 146.55] |
| 7 visual memory, Wechsler's Memory Scale (change from baseline) Show forest plot | 1 | Odds Ratio (M‐H, Fixed, 95% CI) | Subtotals only | |
| Analysis 1.7  Comparison 1 Procaine 200 mg/day i.m. during 30 days vs placebo, Outcome 7 visual memory, Wechsler's Memory Scale (change from baseline). | ||||
| 7.1 procaine 10 ml/day after 30 days | 1 | 81 | Odds Ratio (M‐H, Fixed, 95% CI) | 10.97 [1.32, 91.22] |
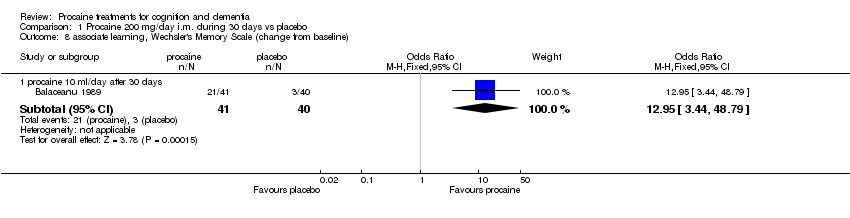
| 8 associate learning, Wechsler's Memory Scale (change from baseline) Show forest plot | 1 | Odds Ratio (M‐H, Fixed, 95% CI) | Subtotals only | |
| Analysis 1.8  Comparison 1 Procaine 200 mg/day i.m. during 30 days vs placebo, Outcome 8 associate learning, Wechsler's Memory Scale (change from baseline). | ||||
| 8.1 procaine 10 ml/day after 30 days | 1 | 81 | Odds Ratio (M‐H, Fixed, 95% CI) | 12.95 [3.44, 48.79] |
| 9 memory quotient, Wechsler's Memory Scale (change from baseline) Show forest plot | 1 | Odds Ratio (M‐H, Fixed, 95% CI) | Subtotals only | |
| Analysis 1.9  Comparison 1 Procaine 200 mg/day i.m. during 30 days vs placebo, Outcome 9 memory quotient, Wechsler's Memory Scale (change from baseline). | ||||
| 9.1 procaine 10 ml/day after 30 days | 1 | 81 | Odds Ratio (M‐H, Fixed, 95% CI) | 12.71 [3.81, 42.42] |
| 10 intelligence ‐ Kohs cubes test (change from baseline) Show forest plot | 1 | Odds Ratio (M‐H, Fixed, 95% CI) | Subtotals only | |
| Analysis 1.10  Comparison 1 Procaine 200 mg/day i.m. during 30 days vs placebo, Outcome 10 intelligence ‐ Kohs cubes test (change from baseline). | ||||
| 10.1 procaine 10 ml/day after 30 days | 1 | 81 | Odds Ratio (M‐H, Fixed, 95% CI) | 0.97 [0.31, 3.07] |
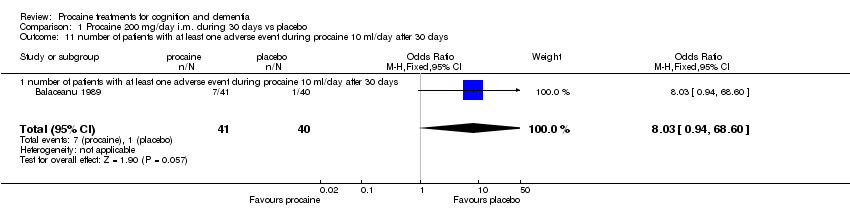
| 11 number of patients with at least one adverse event during procaine 10 ml/day after 30 days Show forest plot | 1 | 81 | Odds Ratio (M‐H, Fixed, 95% CI) | 8.03 [0.94, 68.60] |
| Analysis 1.11  Comparison 1 Procaine 200 mg/day i.m. during 30 days vs placebo, Outcome 11 number of patients with at least one adverse event during procaine 10 ml/day after 30 days. | ||||
| 11.1 number of patients with at least one adverse event during procaine 10 ml/day after 30 days | 1 | 81 | Odds Ratio (M‐H, Fixed, 95% CI) | 8.03 [0.94, 68.60] |
| Outcome or subgroup title | No. of studies | No. of participants | Statistical method | Effect size |
| 1 withdrawals during the treatment with procaine/hematoporphyrin 50 mg/day 2 years Show forest plot | 1 | Odds Ratio (M‐H, Fixed, 95% CI) | Subtotals only | |
| Analysis 2.1  Comparison 2 Procaine/hematoporphyrin (KH3) 50 mg/day per os during 2 years vs placebo, Outcome 1 withdrawals during the treatment with procaine/hematoporphyrin 50 mg/day 2 years. | ||||
| 1.1 procaine/hematoporphyrin 50 mg/day 2 years | 1 | 334 | Odds Ratio (M‐H, Fixed, 95% CI) | 1.78 [0.96, 3.29] |
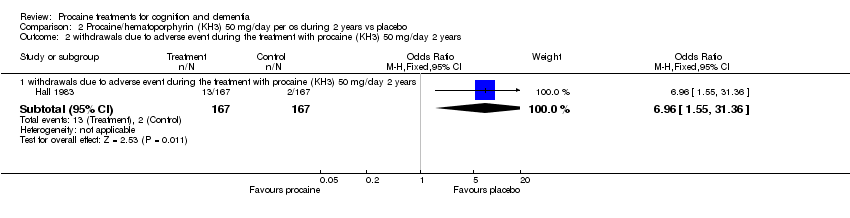
| 2 withdrawals due to adverse event during the treatment with procaine (KH3) 50 mg/day 2 years Show forest plot | 1 | Odds Ratio (M‐H, Fixed, 95% CI) | Subtotals only | |
| Analysis 2.2  Comparison 2 Procaine/hematoporphyrin (KH3) 50 mg/day per os during 2 years vs placebo, Outcome 2 withdrawals due to adverse event during the treatment with procaine (KH3) 50 mg/day 2 years. | ||||
| 2.1 withdrawals due to adverse event during the treatment with procaine (KH3) 50 mg/day 2 years | 1 | 334 | Odds Ratio (M‐H, Fixed, 95% CI) | 6.96 [1.55, 31.36] |
| 3 death during the treatment with procaine/hematoporphyrin 50 mg/day 2 years Show forest plot | 1 | Odds Ratio (M‐H, Fixed, 95% CI) | Subtotals only | |
| Analysis 2.3  Comparison 2 Procaine/hematoporphyrin (KH3) 50 mg/day per os during 2 years vs placebo, Outcome 3 death during the treatment with procaine/hematoporphyrin 50 mg/day 2 years. | ||||
| 3.1 death during the treatment with procaine/hematoporphyrin 50 mg/day 2 years | 1 | 334 | Odds Ratio (M‐H, Fixed, 95% CI) | 0.94 [0.48, 1.86] |
| Outcome or subgroup title | No. of studies | No. of participants | Statistical method | Effect size |
| 1 memory quotient, Wechsler's Memory Scale (change from baseline) Show forest plot | 1 | Odds Ratio (M‐H, Fixed, 95% CI) | Subtotals only | |
| Analysis 3.1  Comparison 3 Procaine (gerioptil H3) 12 injections/1 month i.m. vs placebo, Outcome 1 memory quotient, Wechsler's Memory Scale (change from baseline). | ||||
| 1.1 gerioptil H3 12 injections/1 month | 1 | 12 | Odds Ratio (M‐H, Fixed, 95% CI) | 0.04 [0.00, 1.12] |
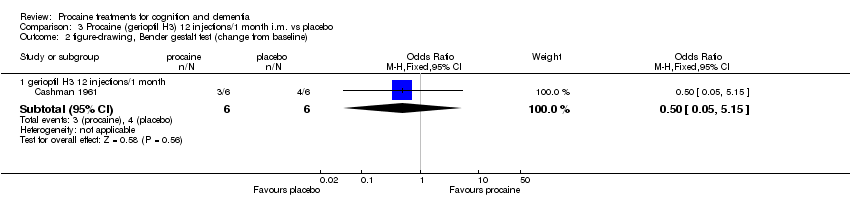
| 2 figure‐drawing, Bender gestalt test (change from baseline) Show forest plot | 1 | Odds Ratio (M‐H, Fixed, 95% CI) | Subtotals only | |
| Analysis 3.2  Comparison 3 Procaine (gerioptil H3) 12 injections/1 month i.m. vs placebo, Outcome 2 figure‐drawing, Bender gestalt test (change from baseline). | ||||
| 2.1 gerioptil H3 12 injections/1 month | 1 | 12 | Odds Ratio (M‐H, Fixed, 95% CI) | 0.5 [0.05, 5.15] |
| 3 intellectual capacity, Raven's Progressive Matrices (change from baseline) Show forest plot | 1 | Odds Ratio (M‐H, Fixed, 95% CI) | Subtotals only | |
| Analysis 3.3  Comparison 3 Procaine (gerioptil H3) 12 injections/1 month i.m. vs placebo, Outcome 3 intellectual capacity, Raven's Progressive Matrices (change from baseline). | ||||
| 3.1 gerioptil H3 12 injections/1 month | 1 | 12 | Odds Ratio (M‐H, Fixed, 95% CI) | 0.5 [0.05, 5.15] |
| 4 premorbid intelligence level, Mill Hill vocabulary scale (change from baseline) Show forest plot | 1 | Odds Ratio (M‐H, Fixed, 95% CI) | Subtotals only | |
| Analysis 3.4  Comparison 3 Procaine (gerioptil H3) 12 injections/1 month i.m. vs placebo, Outcome 4 premorbid intelligence level, Mill Hill vocabulary scale (change from baseline). | ||||
| 4.1 gerioptil H3 12 injections/1 month | 1 | 12 | Odds Ratio (M‐H, Fixed, 95% CI) | 0.25 [0.02, 2.76] |
| 5 overall changes from baseline Show forest plot | 1 | Odds Ratio (M‐H, Fixed, 95% CI) | Subtotals only | |
| Analysis 3.5  Comparison 3 Procaine (gerioptil H3) 12 injections/1 month i.m. vs placebo, Outcome 5 overall changes from baseline. | ||||
| 5.1 gerioptil H3 12 injections/1 month | 1 | 12 | Odds Ratio (M‐H, Fixed, 95% CI) | 0.04 [0.00, 0.83] |
| Outcome or subgroup title | No. of studies | No. of participants | Statistical method | Effect size |
| 1 total adverse events Show forest plot | 2 | 415 | Odds Ratio (M‐H, Fixed, 95% CI) | 7.30 [2.13, 25.02] |
| Analysis 4.1  Comparison 4 Procaine vs placebo, Outcome 1 total adverse events. | ||||
| 1.1 number of patients with at least one adverse event during procaine 10 ml/day after 30 days | 1 | 81 | Odds Ratio (M‐H, Fixed, 95% CI) | 8.03 [0.94, 68.60] |
| 1.2 withdrawals due to adverse event during the treatment with procaine (KH3) 50 mg/day 2 years | 1 | 334 | Odds Ratio (M‐H, Fixed, 95% CI) | 6.96 [1.55, 31.36] |
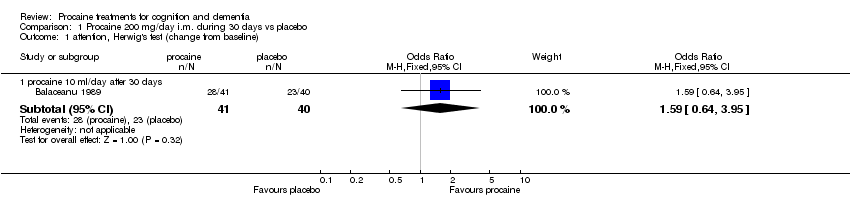
Comparison 1 Procaine 200 mg/day i.m. during 30 days vs placebo, Outcome 1 attention, Herwig's test (change from baseline).
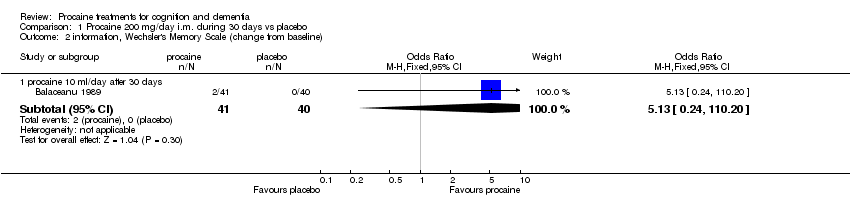
Comparison 1 Procaine 200 mg/day i.m. during 30 days vs placebo, Outcome 2 information, Wechsler's Memory Scale (change from baseline).

Comparison 1 Procaine 200 mg/day i.m. during 30 days vs placebo, Outcome 3 orientation, Wechsler's Memory Scale (change from baseline).
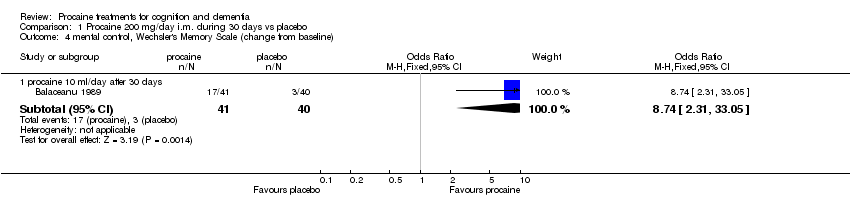
Comparison 1 Procaine 200 mg/day i.m. during 30 days vs placebo, Outcome 4 mental control, Wechsler's Memory Scale (change from baseline).

Comparison 1 Procaine 200 mg/day i.m. during 30 days vs placebo, Outcome 5 immediate logic recall, Wechsler's Memory Scale (change from baseline).

Comparison 1 Procaine 200 mg/day i.m. during 30 days vs placebo, Outcome 6 digit memory, Wechsler's Memory Scale (change from baseline).
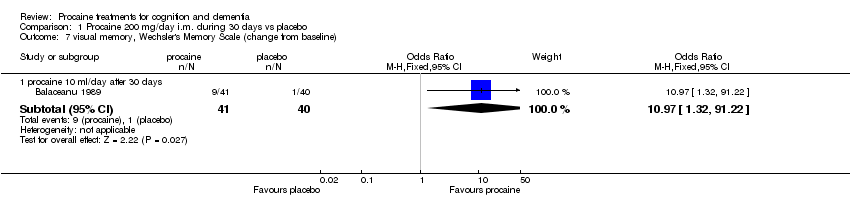
Comparison 1 Procaine 200 mg/day i.m. during 30 days vs placebo, Outcome 7 visual memory, Wechsler's Memory Scale (change from baseline).
Comparison 1 Procaine 200 mg/day i.m. during 30 days vs placebo, Outcome 8 associate learning, Wechsler's Memory Scale (change from baseline).

Comparison 1 Procaine 200 mg/day i.m. during 30 days vs placebo, Outcome 9 memory quotient, Wechsler's Memory Scale (change from baseline).

Comparison 1 Procaine 200 mg/day i.m. during 30 days vs placebo, Outcome 10 intelligence ‐ Kohs cubes test (change from baseline).
Comparison 1 Procaine 200 mg/day i.m. during 30 days vs placebo, Outcome 11 number of patients with at least one adverse event during procaine 10 ml/day after 30 days.

Comparison 2 Procaine/hematoporphyrin (KH3) 50 mg/day per os during 2 years vs placebo, Outcome 1 withdrawals during the treatment with procaine/hematoporphyrin 50 mg/day 2 years.
Comparison 2 Procaine/hematoporphyrin (KH3) 50 mg/day per os during 2 years vs placebo, Outcome 2 withdrawals due to adverse event during the treatment with procaine (KH3) 50 mg/day 2 years.

Comparison 2 Procaine/hematoporphyrin (KH3) 50 mg/day per os during 2 years vs placebo, Outcome 3 death during the treatment with procaine/hematoporphyrin 50 mg/day 2 years.

Comparison 3 Procaine (gerioptil H3) 12 injections/1 month i.m. vs placebo, Outcome 1 memory quotient, Wechsler's Memory Scale (change from baseline).
Comparison 3 Procaine (gerioptil H3) 12 injections/1 month i.m. vs placebo, Outcome 2 figure‐drawing, Bender gestalt test (change from baseline).

Comparison 3 Procaine (gerioptil H3) 12 injections/1 month i.m. vs placebo, Outcome 3 intellectual capacity, Raven's Progressive Matrices (change from baseline).

Comparison 3 Procaine (gerioptil H3) 12 injections/1 month i.m. vs placebo, Outcome 4 premorbid intelligence level, Mill Hill vocabulary scale (change from baseline).
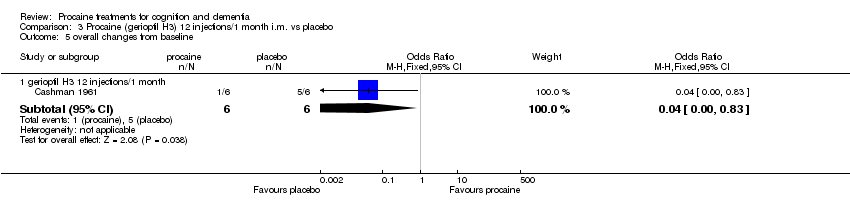
Comparison 3 Procaine (gerioptil H3) 12 injections/1 month i.m. vs placebo, Outcome 5 overall changes from baseline.

Comparison 4 Procaine vs placebo, Outcome 1 total adverse events.
| procaine compared to placebo for cognitive enhancement and dementia | ||||||
| Patient or population: "healthy" old persons and demented women | ||||||
| Outcomes | Illustrative comparative risks* (95% CI) | Relative effect | No of Participants | Quality of the evidence | Comments | |
| Assumed risk | Corresponding risk | |||||
| Control | procaine | |||||
| cognitive function improvement in "healthy" elderly persons | Medium risk population | OR 12.71 | 81 | ⊕⊕⊝⊝ | ||
| 100 per 1000 | 585 per 1000 | |||||
| cognitive function improvement in demented women | Medium risk population | OR 0.04 | 12 | ⊕⊝⊝⊝ | ||
| 667 per 1000 | 74 per 1000 | |||||
| overall changes from baseline in "healthy persons7 ‐ not measured | See comment | See comment | Not estimable7 | ‐ | See comment | |
| overall changes from baseline in demented women | Medium risk population | OR 0.04 | 12 | ⊕⊝⊝⊝ | ||
| 833 per 1000 | 166 per 1000 | |||||
| total adverse events in "healthy" persons | Low risk population8 | OR 7.3 | 415 | ⊕⊕⊝⊝ | ||
| 10 per 1000 | 69 per 1000 | |||||
| High risk population8 | ||||||
| 20 per 1000 | 130 per 1000 | |||||
| *The basis for the assumed risk (e.g. the median control group risk across studies) is provided in footnotes. The corresponding risk (and its 95% confidence interval) is based on the assumed risk in the comparison group and the relative effect of the intervention (and its 95% CI). | ||||||
| GRADE Working Group grades of evidence | ||||||
| 1 procaine was used for 30 days in two studies and for 2 years in one other study | ||||||
| Outcome or subgroup title | No. of studies | No. of participants | Statistical method | Effect size |
| 1 attention, Herwig's test (change from baseline) Show forest plot | 1 | Odds Ratio (M‐H, Fixed, 95% CI) | Subtotals only | |
| 1.1 procaine 10 ml/day after 30 days | 1 | 81 | Odds Ratio (M‐H, Fixed, 95% CI) | 1.59 [0.64, 3.95] |
| 2 information, Wechsler's Memory Scale (change from baseline) Show forest plot | 1 | Odds Ratio (M‐H, Fixed, 95% CI) | Subtotals only | |
| 2.1 procaine 10 ml/day after 30 days | 1 | 81 | Odds Ratio (M‐H, Fixed, 95% CI) | 5.13 [0.24, 110.20] |
| 3 orientation, Wechsler's Memory Scale (change from baseline) Show forest plot | 1 | Odds Ratio (M‐H, Fixed, 95% CI) | Subtotals only | |
| 3.1 procaine 10 ml/day after 30 days | 1 | 81 | Odds Ratio (M‐H, Fixed, 95% CI) | 3.0 [0.12, 75.85] |
| 4 mental control, Wechsler's Memory Scale (change from baseline) Show forest plot | 1 | Odds Ratio (M‐H, Fixed, 95% CI) | Subtotals only | |
| 4.1 procaine 10 ml/day after 30 days | 1 | 81 | Odds Ratio (M‐H, Fixed, 95% CI) | 8.74 [2.31, 33.05] |
| 5 immediate logic recall, Wechsler's Memory Scale (change from baseline) Show forest plot | 1 | Odds Ratio (M‐H, Fixed, 95% CI) | Subtotals only | |
| 5.1 procaine 10 ml/day after 30 days | 1 | 81 | Odds Ratio (M‐H, Fixed, 95% CI) | 2.40 [0.98, 5.93] |
| 6 digit memory, Wechsler's Memory Scale (change from baseline) Show forest plot | 1 | Odds Ratio (M‐H, Fixed, 95% CI) | Subtotals only | |
| 6.1 procaine 10 ml/day after 30 days | 1 | 81 | Odds Ratio (M‐H, Fixed, 95% CI) | 18.11 [2.24, 146.55] |
| 7 visual memory, Wechsler's Memory Scale (change from baseline) Show forest plot | 1 | Odds Ratio (M‐H, Fixed, 95% CI) | Subtotals only | |
| 7.1 procaine 10 ml/day after 30 days | 1 | 81 | Odds Ratio (M‐H, Fixed, 95% CI) | 10.97 [1.32, 91.22] |
| 8 associate learning, Wechsler's Memory Scale (change from baseline) Show forest plot | 1 | Odds Ratio (M‐H, Fixed, 95% CI) | Subtotals only | |
| 8.1 procaine 10 ml/day after 30 days | 1 | 81 | Odds Ratio (M‐H, Fixed, 95% CI) | 12.95 [3.44, 48.79] |
| 9 memory quotient, Wechsler's Memory Scale (change from baseline) Show forest plot | 1 | Odds Ratio (M‐H, Fixed, 95% CI) | Subtotals only | |
| 9.1 procaine 10 ml/day after 30 days | 1 | 81 | Odds Ratio (M‐H, Fixed, 95% CI) | 12.71 [3.81, 42.42] |
| 10 intelligence ‐ Kohs cubes test (change from baseline) Show forest plot | 1 | Odds Ratio (M‐H, Fixed, 95% CI) | Subtotals only | |
| 10.1 procaine 10 ml/day after 30 days | 1 | 81 | Odds Ratio (M‐H, Fixed, 95% CI) | 0.97 [0.31, 3.07] |
| 11 number of patients with at least one adverse event during procaine 10 ml/day after 30 days Show forest plot | 1 | 81 | Odds Ratio (M‐H, Fixed, 95% CI) | 8.03 [0.94, 68.60] |
| 11.1 number of patients with at least one adverse event during procaine 10 ml/day after 30 days | 1 | 81 | Odds Ratio (M‐H, Fixed, 95% CI) | 8.03 [0.94, 68.60] |
| Outcome or subgroup title | No. of studies | No. of participants | Statistical method | Effect size |
| 1 withdrawals during the treatment with procaine/hematoporphyrin 50 mg/day 2 years Show forest plot | 1 | Odds Ratio (M‐H, Fixed, 95% CI) | Subtotals only | |
| 1.1 procaine/hematoporphyrin 50 mg/day 2 years | 1 | 334 | Odds Ratio (M‐H, Fixed, 95% CI) | 1.78 [0.96, 3.29] |
| 2 withdrawals due to adverse event during the treatment with procaine (KH3) 50 mg/day 2 years Show forest plot | 1 | Odds Ratio (M‐H, Fixed, 95% CI) | Subtotals only | |
| 2.1 withdrawals due to adverse event during the treatment with procaine (KH3) 50 mg/day 2 years | 1 | 334 | Odds Ratio (M‐H, Fixed, 95% CI) | 6.96 [1.55, 31.36] |
| 3 death during the treatment with procaine/hematoporphyrin 50 mg/day 2 years Show forest plot | 1 | Odds Ratio (M‐H, Fixed, 95% CI) | Subtotals only | |
| 3.1 death during the treatment with procaine/hematoporphyrin 50 mg/day 2 years | 1 | 334 | Odds Ratio (M‐H, Fixed, 95% CI) | 0.94 [0.48, 1.86] |
| Outcome or subgroup title | No. of studies | No. of participants | Statistical method | Effect size |
| 1 memory quotient, Wechsler's Memory Scale (change from baseline) Show forest plot | 1 | Odds Ratio (M‐H, Fixed, 95% CI) | Subtotals only | |
| 1.1 gerioptil H3 12 injections/1 month | 1 | 12 | Odds Ratio (M‐H, Fixed, 95% CI) | 0.04 [0.00, 1.12] |
| 2 figure‐drawing, Bender gestalt test (change from baseline) Show forest plot | 1 | Odds Ratio (M‐H, Fixed, 95% CI) | Subtotals only | |
| 2.1 gerioptil H3 12 injections/1 month | 1 | 12 | Odds Ratio (M‐H, Fixed, 95% CI) | 0.5 [0.05, 5.15] |
| 3 intellectual capacity, Raven's Progressive Matrices (change from baseline) Show forest plot | 1 | Odds Ratio (M‐H, Fixed, 95% CI) | Subtotals only | |
| 3.1 gerioptil H3 12 injections/1 month | 1 | 12 | Odds Ratio (M‐H, Fixed, 95% CI) | 0.5 [0.05, 5.15] |
| 4 premorbid intelligence level, Mill Hill vocabulary scale (change from baseline) Show forest plot | 1 | Odds Ratio (M‐H, Fixed, 95% CI) | Subtotals only | |
| 4.1 gerioptil H3 12 injections/1 month | 1 | 12 | Odds Ratio (M‐H, Fixed, 95% CI) | 0.25 [0.02, 2.76] |
| 5 overall changes from baseline Show forest plot | 1 | Odds Ratio (M‐H, Fixed, 95% CI) | Subtotals only | |
| 5.1 gerioptil H3 12 injections/1 month | 1 | 12 | Odds Ratio (M‐H, Fixed, 95% CI) | 0.04 [0.00, 0.83] |
| Outcome or subgroup title | No. of studies | No. of participants | Statistical method | Effect size |
| 1 total adverse events Show forest plot | 2 | 415 | Odds Ratio (M‐H, Fixed, 95% CI) | 7.30 [2.13, 25.02] |
| 1.1 number of patients with at least one adverse event during procaine 10 ml/day after 30 days | 1 | 81 | Odds Ratio (M‐H, Fixed, 95% CI) | 8.03 [0.94, 68.60] |
| 1.2 withdrawals due to adverse event during the treatment with procaine (KH3) 50 mg/day 2 years | 1 | 334 | Odds Ratio (M‐H, Fixed, 95% CI) | 6.96 [1.55, 31.36] |