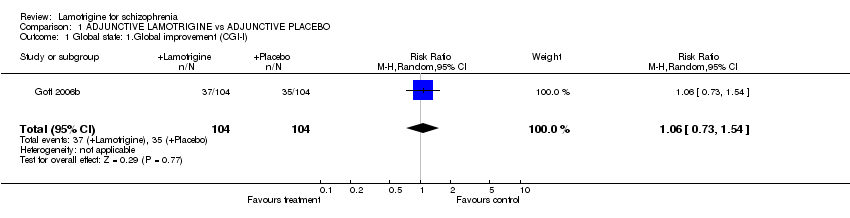
| 1 Global state: 1.Global improvement (CGI‐I) Show forest plot | 1 | 208 | Risk Ratio (M‐H, Random, 95% CI) | 1.06 [0.73, 1.54] |
|
| 2 Global state: 2. Average total change score ‐ short term (CGI‐S, high change=good, data skewed) Show forest plot | | | Other data | No numeric data |
|
| 3 Global state: 3. Average physical health change score ‐ short term (SF‐36, high change=good, data skewed) Show forest plot | | | Other data | No numeric data |
|
| 4 Global state: 4. Average mental health change score ‐ short term (SF‐36, high change=good, data skewed) Show forest plot | | | Other data | No numeric data |
|
| 5 Mental state: 1.Treatment responders (> 20% reduction in PANSS total) Show forest plot | 3 | 297 | Risk Ratio (M‐H, Random, 95% CI) | 1.26 [0.81, 1.97] |
|
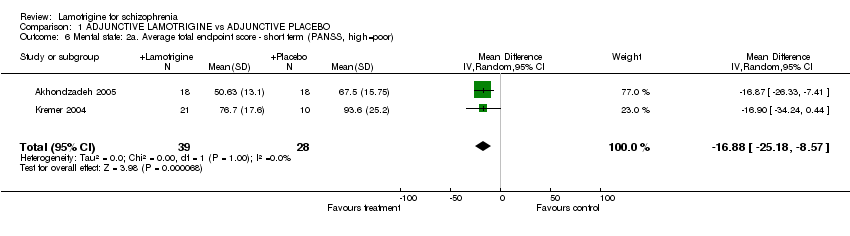
| 6 Mental state: 2a. Average total endpoint score ‐ short term (PANSS, high=poor) Show forest plot | 2 | 67 | Mean Difference (IV, Random, 95% CI) | ‐16.88 [‐25.18, ‐8.57] |
|
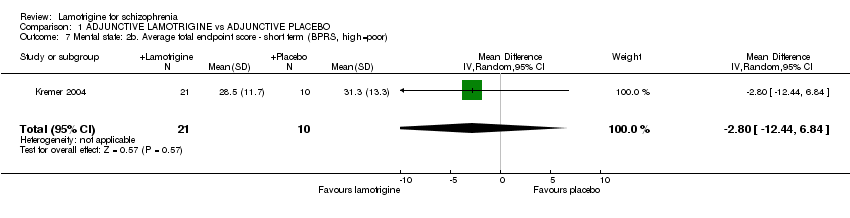
| 7 Mental state: 2b. Average total endpoint score ‐ short term (BPRS, high=poor) Show forest plot | 1 | 31 | Mean Difference (IV, Random, 95% CI) | ‐2.80 [‐12.44, 6.84] |
|
| 8 Mental state: 2c. Average total change score ‐ short term (PANSS, high=poor, data skewed) Show forest plot | | | Other data | No numeric data |
|
| 9 Mental state: 3a. Average positive endpoint score ‐ short term (PANSS subscale, high=poor) Show forest plot | 2 | 65 | Mean Difference (IV, Random, 95% CI) | ‐5.10 [‐8.86, ‐1.34] |
|
| 10 Mental state: 3b. Average positive change score ‐ short term (PANSS subscale, high change=good, data skewed) Show forest plot | | | Other data | No numeric data |
|
| 11 Mental state: 4a. Average negative endpoint score ‐ short term (PANSS subscale, high=poor) Show forest plot | 2 | 67 | Mean Difference (IV, Random, 95% CI) | ‐5.25 [‐7.07, ‐3.43] |
|
| 12 Mental state: 4b. Average negative endpoint score ‐ short term (SANS, high=poor) Show forest plot | 1 | 31 | Mean Difference (IV, Random, 95% CI) | ‐8.80 [‐19.73, 2.13] |
|
| 13 Mental state: 4c. Average negative change score ‐ short term (SANS, high change=good, data skewed) Show forest plot | | | Other data | No numeric data |
|
| 14 Mental state: 5a. Average general psychopathology endpoint score ‐ short term (PANSS, high=poor) Show forest plot | 2 | 67 | Mean Difference (IV, Random, 95% CI) | ‐10.74 [‐16.53, ‐4.96] |
|
| 15 Mental state: 5c. Average general psychopathology change score ‐ short term (PANSS subscale, data skewed) Show forest plot | | | Other data | No numeric data |
|
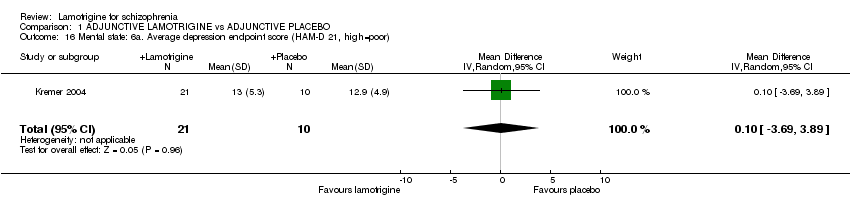
| 16 Mental state: 6a. Average depression endpoint score (HAM‐D 21, high=poor) Show forest plot | 1 | 31 | Mean Difference (IV, Random, 95% CI) | 0.10 [‐3.69, 3.89] |
|
| 17 Mental state: 6b. Average depression change score (CDSS, high change=good, data skewed) Show forest plot | | | Other data | No numeric data |
|
| 18 Mental state: 6c. Average depression change score ‐ short term (WHO‐5, high change=good, data skewed) Show forest plot | | | Other data | No numeric data |
|
| 19 Cognitive state: 1. Treatment response (BACS) Show forest plot | 2 | 329 | Risk Ratio (M‐H, Random, 95% CI) | 1.10 [0.59, 2.04] |
|
| 20 Cognitive state: 2. Average change score ‐ short term (Stroop test, high difference from baseline=good) Show forest plot | 1 | | Mean Difference (IV, Random, 95% CI) | Subtotals only |
|
| 20.1 Stroop ‐ color naming time | 1 | 36 | Mean Difference (IV, Random, 95% CI) | ‐29.45 [‐53.69, ‐5.21] |
| 20.2 Stroop ‐ color naming error | 1 | 36 | Mean Difference (IV, Random, 95% CI) | ‐8.28 [‐12.85, ‐3.71] |
| 20.3 Stroop ‐ word reading time | 1 | 36 | Mean Difference (IV, Random, 95% CI) | 0.61 [‐10.81, 12.03] |
| 20.4 Stroop ‐ word reading error | 1 | 36 | Mean Difference (IV, Random, 95% CI) | ‐0.33 [‐2.46, 1.80] |
| 21 Cognitive state: 3. Average change score ‐ short term (BACS, high change=good, data skewed) Show forest plot | | | Other data | No numeric data |
|
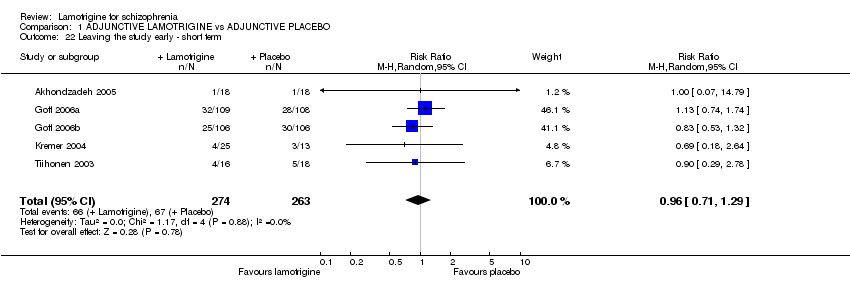
| 22 Leaving the study early ‐ short term Show forest plot | 5 | 537 | Risk Ratio (M‐H, Random, 95% CI) | 0.96 [0.71, 1.29] |
|
| 23 Adverse effects: 1. Death, self harm, ideation about harm to self or others ‐ short term Show forest plot | 2 | | Risk Ratio (M‐H, Random, 95% CI) | Subtotals only |
|
| 23.1 death | 2 | 429 | Risk Ratio (M‐H, Random, 95% CI) | 0.0 [0.0, 0.0] |
| 23.2 any one or more fatalistic acts/impulses | 2 | 429 | Risk Ratio (M‐H, Random, 95% CI) | 2.38 [0.90, 6.30] |
| 23.3 suicide attempt | 1 | 217 | Risk Ratio (M‐H, Random, 95% CI) | 2.97 [0.12, 72.18] |
| 23.4 ideation ‐ homicidal | 1 | 217 | Risk Ratio (M‐H, Random, 95% CI) | 4.95 [0.24, 102.01] |
| 23.5 ideation ‐ suicidal | 2 | 429 | Risk Ratio (M‐H, Random, 95% CI) | 1.05 [0.15, 7.06] |
| 24 Adverse effects: 2a. Specific ‐ any adverse effect ‐ short term Show forest plot | 2 | 429 | Risk Ratio (M‐H, Random, 95% CI) | 1.19 [1.02, 1.38] |
|
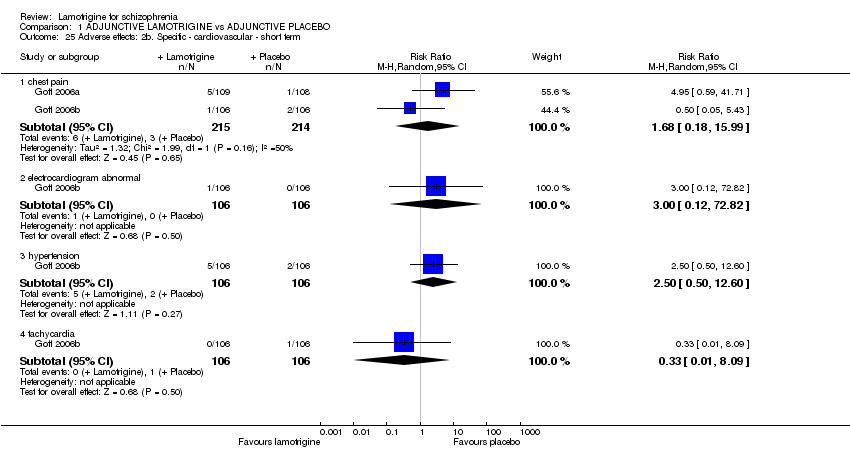
| 25 Adverse effects: 2b. Specific ‐ cardiovascular ‐ short term Show forest plot | 2 | | Risk Ratio (M‐H, Random, 95% CI) | Subtotals only |
|
| 25.1 chest pain | 2 | 429 | Risk Ratio (M‐H, Random, 95% CI) | 1.68 [0.18, 15.99] |
| 25.2 electrocardiogram abnormal | 1 | 212 | Risk Ratio (M‐H, Random, 95% CI) | 3.00 [0.12, 72.82] |
| 25.3 hypertension | 1 | 212 | Risk Ratio (M‐H, Random, 95% CI) | 2.50 [0.50, 12.60] |
| 25.4 tachycardia | 1 | 212 | Risk Ratio (M‐H, Random, 95% CI) | 0.33 [0.01, 8.09] |
| 26 Adverse effects: 2c. Specific ‐ dermatological ‐ short term Show forest plot | 3 | | Risk Ratio (M‐H, Random, 95% CI) | Subtotals only |
|
| 26.27 hair loss | 1 | 36 | Risk Ratio (M‐H, Random, 95% CI) | 3.00 [0.13, 69.09] |
| 26.34 itching | 1 | 36 | Risk Ratio (M‐H, Random, 95% CI) | 4.0 [0.49, 32.39] |
| 26.45 rash | 3 | 465 | Risk Ratio (M‐H, Random, 95% CI) | 0.74 [0.24, 2.28] |
| 27 Adverse effects: 2d. Specific ‐ gastrointestinal ‐ short term Show forest plot | 3 | | Risk Ratio (M‐H, Random, 95% CI) | Subtotals only |
|
| 27.1 constipation | 1 | 212 | Risk Ratio (M‐H, Random, 95% CI) | 0.33 [0.04, 3.15] |
| 27.2 decreased appetite | 1 | 217 | Risk Ratio (M‐H, Random, 95% CI) | 0.11 [0.01, 2.02] |
| 27.3 diarrhea | 3 | 465 | Risk Ratio (M‐H, Random, 95% CI) | 1.56 [0.39, 6.16] |
| 27.4 dyspepsia | 1 | 212 | Risk Ratio (M‐H, Random, 95% CI) | 4.0 [0.45, 35.20] |
| 27.5 nausea | 3 | 465 | Risk Ratio (M‐H, Random, 95% CI) | 2.26 [1.05, 4.88] |
| 27.6 vomiting | 2 | 253 | Risk Ratio (M‐H, Random, 95% CI) | 3.17 [0.77, 13.02] |
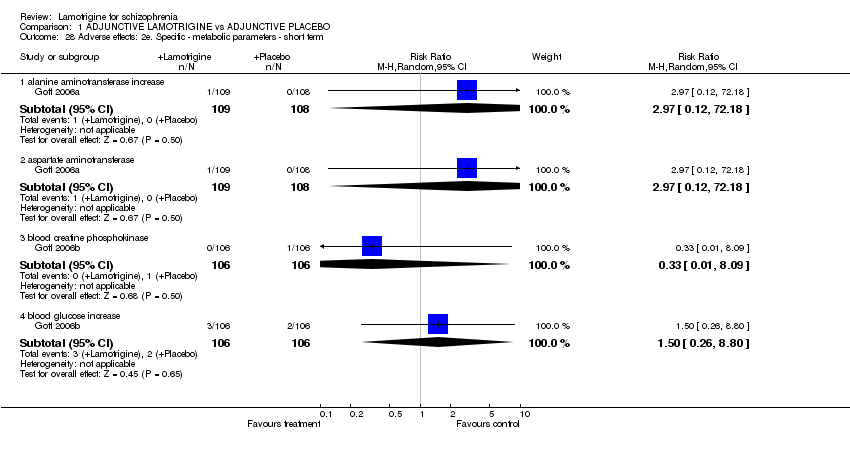
| 28 Adverse effects: 2e. Specific ‐ metabolic parameters ‐ short term Show forest plot | 2 | | Risk Ratio (M‐H, Random, 95% CI) | Subtotals only |
|
| 28.1 alanine aminotransferase increase | 1 | 217 | Risk Ratio (M‐H, Random, 95% CI) | 2.97 [0.12, 72.18] |
| 28.2 aspartate aminotransferase | 1 | 217 | Risk Ratio (M‐H, Random, 95% CI) | 2.97 [0.12, 72.18] |
| 28.3 blood creatine phosphokinase | 1 | 212 | Risk Ratio (M‐H, Random, 95% CI) | 0.33 [0.01, 8.09] |
| 28.4 blood glucose increase | 1 | 212 | Risk Ratio (M‐H, Random, 95% CI) | 1.5 [0.26, 8.80] |
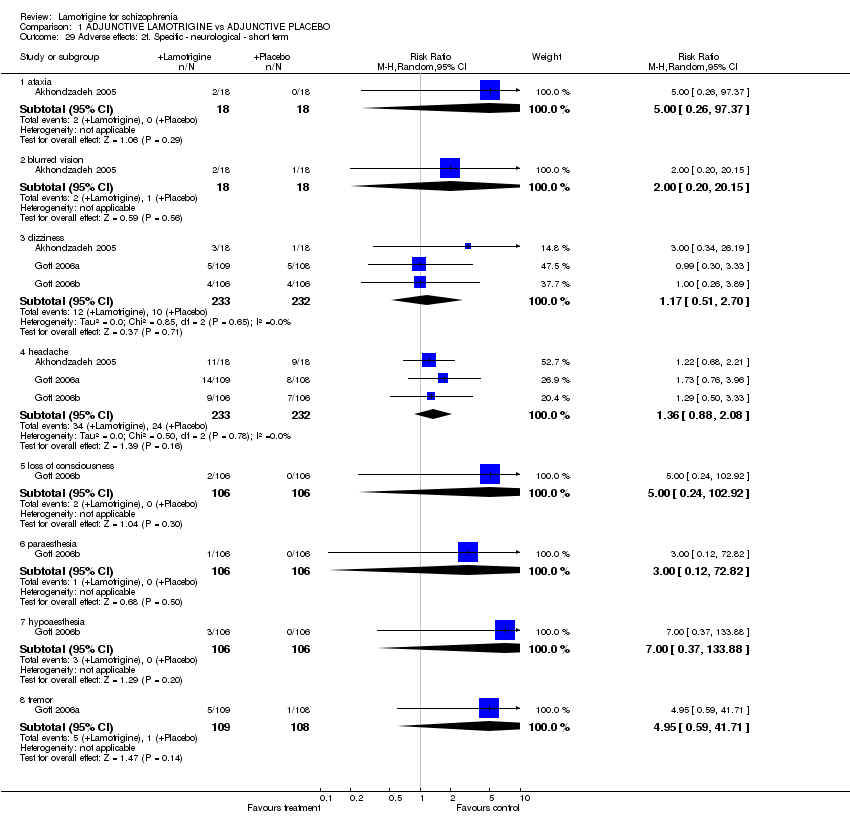
| 29 Adverse effects: 2f. Specific ‐ neurological ‐ short term Show forest plot | 3 | | Risk Ratio (M‐H, Random, 95% CI) | Subtotals only |
|
| 29.1 ataxia | 1 | 36 | Risk Ratio (M‐H, Random, 95% CI) | 5.00 [0.26, 97.37] |
| 29.2 blurred vision | 1 | 36 | Risk Ratio (M‐H, Random, 95% CI) | 2.0 [0.20, 20.15] |
| 29.3 dizziness | 3 | 465 | Risk Ratio (M‐H, Random, 95% CI) | 1.17 [0.51, 2.70] |
| 29.4 headache | 3 | 465 | Risk Ratio (M‐H, Random, 95% CI) | 1.36 [0.88, 2.08] |
| 29.5 loss of consciousness | 1 | 212 | Risk Ratio (M‐H, Random, 95% CI) | 5.0 [0.24, 102.92] |
| 29.6 paraesthesia | 1 | 212 | Risk Ratio (M‐H, Random, 95% CI) | 3.00 [0.12, 72.82] |
| 29.7 hypoaesthesia | 1 | 212 | Risk Ratio (M‐H, Random, 95% CI) | 7.00 [0.37, 133.88] |
| 29.8 tremor | 1 | 217 | Risk Ratio (M‐H, Random, 95% CI) | 4.95 [0.59, 41.71] |
| 30 Adverse effects: 2g. Specific ‐ psychiatric ‐ short term Show forest plot | 2 | | Risk Ratio (M‐H, Random, 95% CI) | Subtotals only |
|
| 30.1 aggression | 1 | 217 | Risk Ratio (M‐H, Random, 95% CI) | 2.97 [0.12, 72.18] |
| 30.2 agitation | 1 | 212 | Risk Ratio (M‐H, Random, 95% CI) | 0.5 [0.09, 2.67] |
| 30.3 anxiety | 2 | 429 | Risk Ratio (M‐H, Random, 95% CI) | 0.73 [0.09, 5.76] |
| 30.4 crying | 1 | 212 | Risk Ratio (M‐H, Random, 95% CI) | 0.33 [0.01, 8.09] |
| 30.5 hallucination, auditory | 1 | 217 | Risk Ratio (M‐H, Random, 95% CI) | 10.90 [0.61, 194.74] |
| 30.6 insomnia | 2 | 429 | Risk Ratio (M‐H, Random, 95% CI) | 2.02 [0.04, 96.25] |
| 30.7 paranoia | 2 | 429 | Risk Ratio (M‐H, Random, 95% CI) | 1.99 [0.37, 10.75] |
| 30.8 somnolence | 2 | 429 | Risk Ratio (M‐H, Random, 95% CI) | 1.21 [0.51, 2.87] |
| 31 Adverse effects: 2h. Specific ‐ respiratory ‐ short term Show forest plot | 1 | 424 | Risk Ratio (M‐H, Fixed, 95% CI) | 3.0 [0.48, 18.89] |
|
| 31.1 cough | 1 | 212 | Risk Ratio (M‐H, Fixed, 95% CI) | 7.0 [0.37, 133.88] |
| 31.2 influenza | 1 | 212 | Risk Ratio (M‐H, Fixed, 95% CI) | 1.0 [0.06, 15.78] |
| 32 Adverse effects: 2i. Specific ‐ others ‐ short term Show forest plot | 2 | | Risk Ratio (M‐H, Random, 95% CI) | Subtotals only |
|
| 32.1 abnormal dreams | 1 | 217 | Risk Ratio (M‐H, Random, 95% CI) | 0.33 [0.01, 8.02] |
| 32.2 asthenia | 1 | 217 | Risk Ratio (M‐H, Random, 95% CI) | 0.33 [0.01, 8.02] |
| 32.3 back pain | 1 | 217 | Risk Ratio (M‐H, Random, 95% CI) | 0.99 [0.30, 3.33] |
| 32.4 dry mouth | 1 | 212 | Risk Ratio (M‐H, Random, 95% CI) | 1.0 [0.21, 4.84] |
| 32.5 fatigue | 1 | 217 | Risk Ratio (M‐H, Random, 95% CI) | 1.39 [0.45, 4.24] |
| 32.6 lymphadenopathy | 2 | 429 | Risk Ratio (M‐H, Random, 95% CI) | 2.99 [0.31, 28.48] |
| 32.7 urine abnormality | 1 | 212 | Risk Ratio (M‐H, Random, 95% CI) | 3.00 [0.12, 72.82] |
| 32.8 weight increase | 1 | 212 | Risk Ratio (M‐H, Random, 95% CI) | 3.00 [0.12, 72.82] |
| 33 Adverse effects: 3. Events ‐ co‐incident with trial ‐ short term Show forest plot | 2 | | Risk Ratio (M‐H, Random, 95% CI) | Subtotals only |
|
| 33.1 abscess | 1 | 212 | Risk Ratio (M‐H, Random, 95% CI) | 3.00 [0.12, 72.82] |
| 33.2 arthropod bite | 1 | 212 | Risk Ratio (M‐H, Random, 95% CI) | 0.33 [0.01, 8.09] |
| 33.3 endometrial cancer | 1 | 212 | Risk Ratio (M‐H, Random, 95% CI) | 3.00 [0.12, 72.82] |
| 33.5 joint injury | 1 | 217 | Risk Ratio (M‐H, Random, 95% CI) | 2.97 [0.12, 72.18] |
| 33.6 local swelling | 1 | 217 | Risk Ratio (M‐H, Random, 95% CI) | 2.97 [0.12, 72.18] |
| 33.7 nasopharyngitis | 2 | 429 | Risk Ratio (M‐H, Random, 95% CI) | 1.42 [0.28, 7.15] |
| 33.8 pharyngolaryngeal pain | 1 | 212 | Risk Ratio (M‐H, Random, 95% CI) | 3.00 [0.12, 72.82] |
| 33.9 post‐procedural pain | 1 | 217 | Risk Ratio (M‐H, Random, 95% CI) | 2.97 [0.12, 72.18] |
| 33.10 tooth abscess | 1 | 217 | Risk Ratio (M‐H, Random, 95% CI) | 2.97 [0.12, 72.18] |
| 33.11 toothache | 1 | 217 | Risk Ratio (M‐H, Random, 95% CI) | 0.40 [0.08, 2.00] |
| 33.12 upper respiratory tract infection | 2 | 429 | Risk Ratio (M‐H, Random, 95% CI) | 1.05 [0.22, 4.94] |
| 34 Adverse effects: 4a. Movement disorders ‐ average endpoint score (ESRS, high = poor, data skewed) Show forest plot | | | Other data | No numeric data |
|
| 35 Adverse effects: 4b. Movement disorders ‐ average dose (biperiden, mg, high = poor, data skewed) Show forest plot | | | Other data | No numeric data |
|