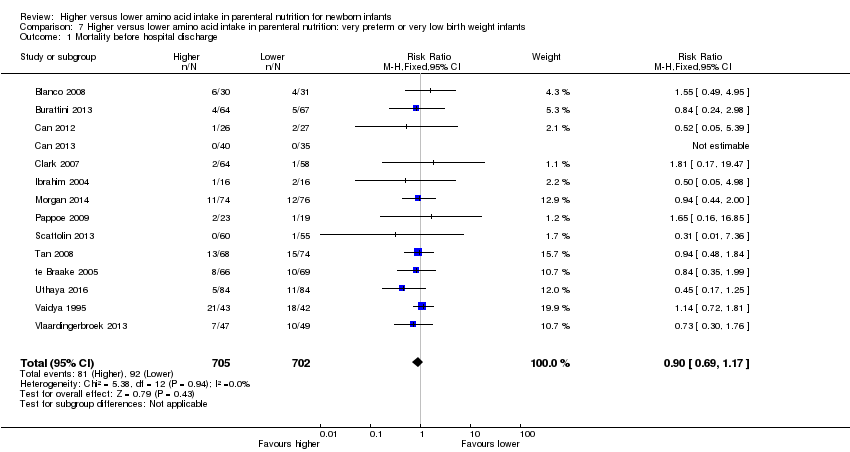
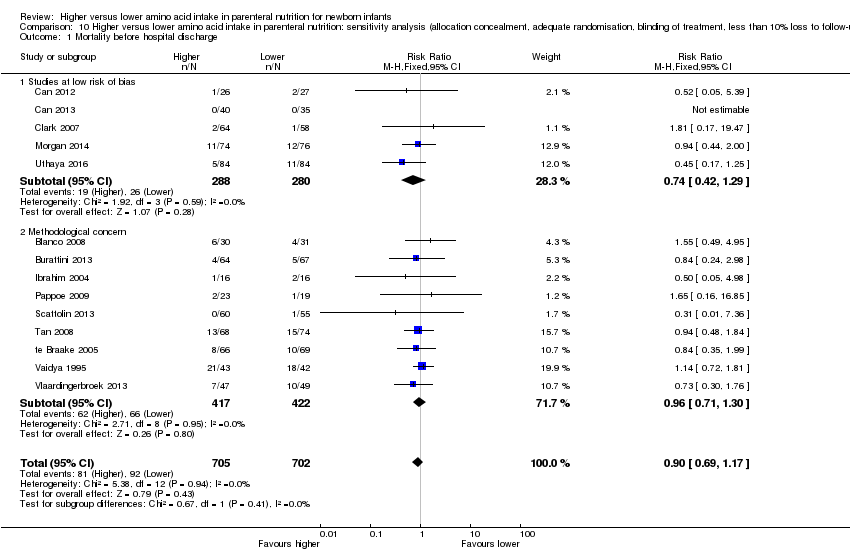
| 1 Mortality before hospital discharge Show forest plot | 14 | 1407 | Risk Ratio (M‐H, Fixed, 95% CI) | 0.90 [0.69, 1.17] |
|
| 1.1 Studies at low risk of bias | 5 | 568 | Risk Ratio (M‐H, Fixed, 95% CI) | 0.74 [0.42, 1.29] |
| 1.2 Methodological concern | 9 | 839 | Risk Ratio (M‐H, Fixed, 95% CI) | 0.96 [0.71, 1.30] |
| 2 Neurodevelopmental disability Show forest plot | 2 | 201 | Risk Ratio (M‐H, Fixed, 95% CI) | 1.04 [0.48, 2.23] |
|
| 2.1 Studies at low risk of bias | 0 | 0 | Risk Ratio (M‐H, Fixed, 95% CI) | 0.0 [0.0, 0.0] |
| 2.2 Methodological concern | 2 | 201 | Risk Ratio (M‐H, Fixed, 95% CI) | 1.04 [0.48, 2.23] |
| 3 Postnatal growth failure at discharge Show forest plot | 3 | 203 | Risk Ratio (M‐H, Fixed, 95% CI) | 0.74 [0.56, 0.97] |
|
| 3.1 Studies at low risk of bias | 1 | 50 | Risk Ratio (M‐H, Fixed, 95% CI) | 0.59 [0.39, 0.88] |
| 3.2 Methodological concern | 2 | 153 | Risk Ratio (M‐H, Fixed, 95% CI) | 0.84 [0.58, 1.20] |
| 4 Postnatal growth failure post discharge Show forest plot | 1 | 111 | Risk Ratio (M‐H, Fixed, 95% CI) | 0.66 [0.33, 1.32] |
|
| 4.1 Studies at low risk of bias | 0 | 0 | Risk Ratio (M‐H, Fixed, 95% CI) | 0.0 [0.0, 0.0] |
| 4.2 Methodological concern | 1 | 111 | Risk Ratio (M‐H, Fixed, 95% CI) | 0.66 [0.33, 1.32] |
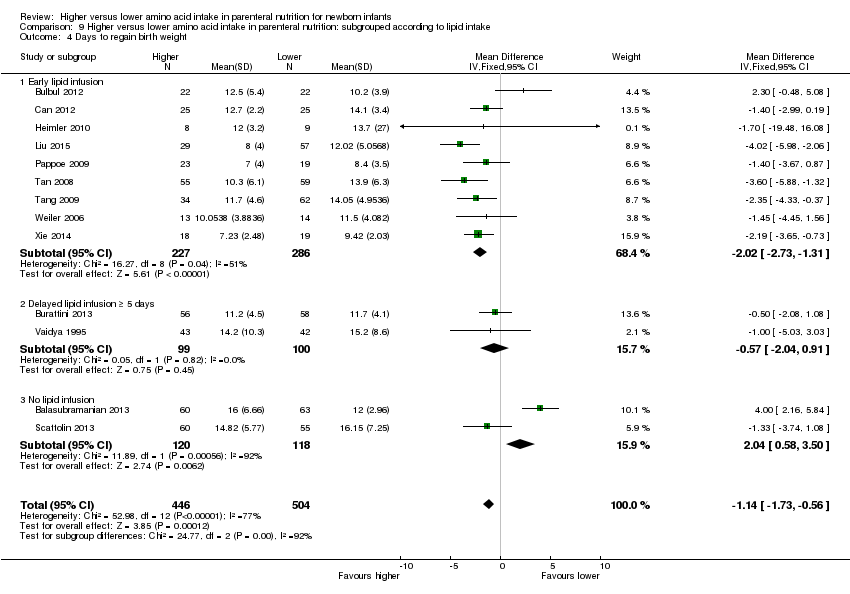
| 5 Days to regain birth weight Show forest plot | 13 | 950 | Mean Difference (IV, Fixed, 95% CI) | ‐1.14 [‐1.73, ‐0.56] |
|
| 5.1 Studies at low risk of bias | 2 | 94 | Mean Difference (IV, Fixed, 95% CI) | ‐0.49 [‐1.87, 0.89] |
| 5.2 Methodological concern | 11 | 856 | Mean Difference (IV, Fixed, 95% CI) | ‐1.29 [‐1.93, ‐0.64] |
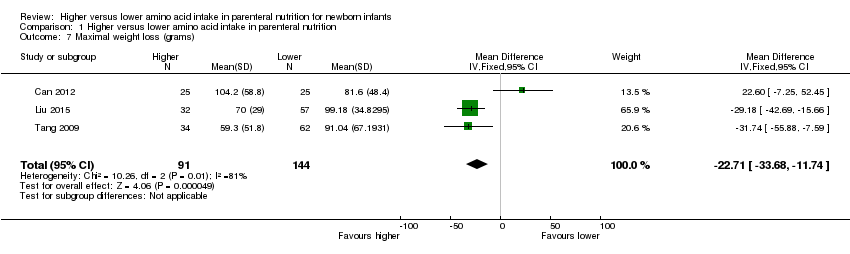
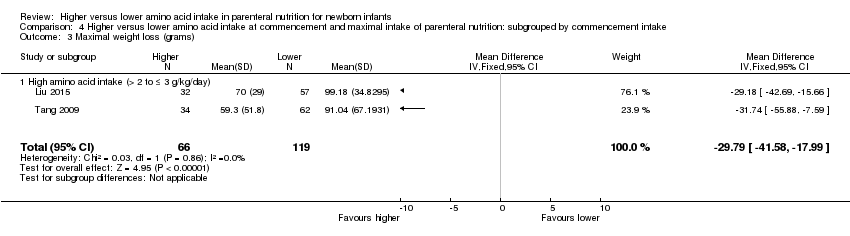
| 6 Maximal weight loss (grams) Show forest plot | 3 | 235 | Mean Difference (IV, Fixed, 95% CI) | ‐22.71 [‐33.68, ‐11.74] |
|
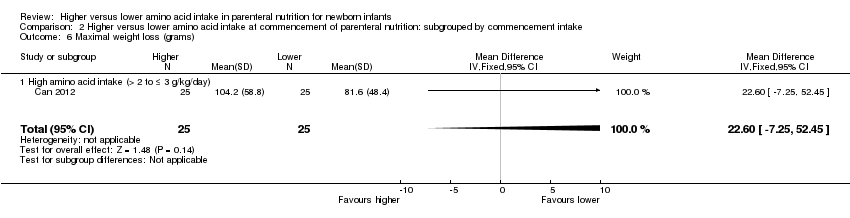
| 6.1 Studies at low risk of bias | 1 | 50 | Mean Difference (IV, Fixed, 95% CI) | 22.60 [‐7.25, 52.45] |
| 6.2 Methodological concern | 2 | 185 | Mean Difference (IV, Fixed, 95% CI) | ‐29.79 [‐41.58, ‐17.99] |
| 7 Maximal weight loss % Show forest plot | 4 | 288 | Mean Difference (IV, Fixed, 95% CI) | ‐0.33 [‐1.61, 0.96] |
|
| 7.1 Studies at low risk of bias | 0 | 0 | Mean Difference (IV, Fixed, 95% CI) | 0.0 [0.0, 0.0] |
| 7.2 Methodological concern | 4 | 288 | Mean Difference (IV, Fixed, 95% CI) | ‐0.33 [‐1.61, 0.96] |
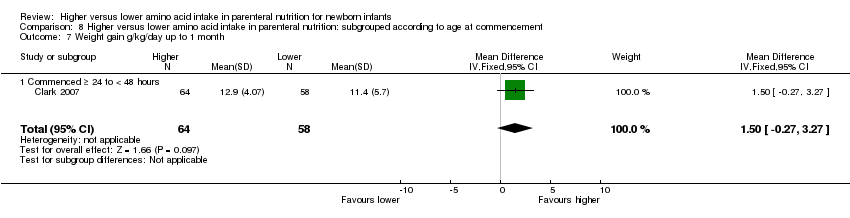
| 8 Weight gain g/kg/day up to 1 month age Show forest plot | 4 | 373 | Mean Difference (IV, Fixed, 95% CI) | ‐1.50 [‐2.56, ‐0.44] |
|
| 8.1 Studies at low risk of bias | 1 | 122 | Mean Difference (IV, Fixed, 95% CI) | 1.5 [‐0.27, 3.27] |
| 8.2 Methodological concern | 3 | 251 | Mean Difference (IV, Fixed, 95% CI) | ‐3.16 [‐4.48, ‐1.84] |
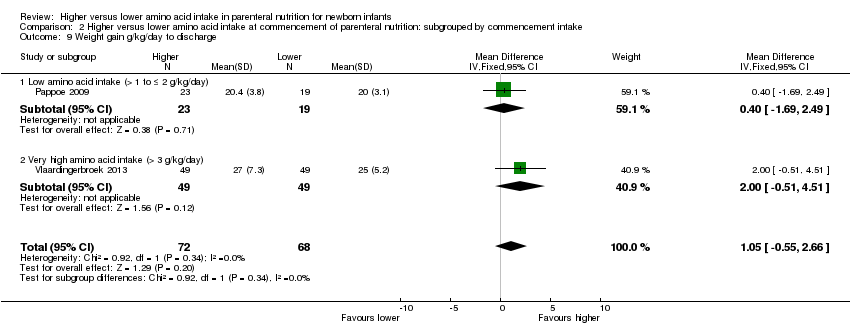
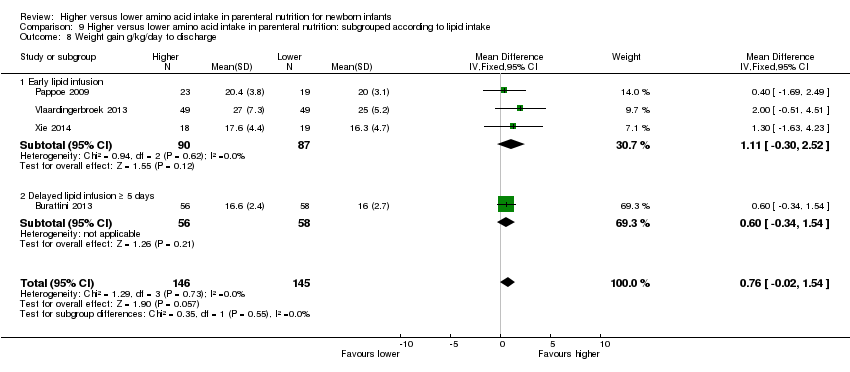
| 9 Weight gain g/kg/day to discharge Show forest plot | 4 | | Mean Difference (IV, Fixed, 95% CI) | Subtotals only |
|
| 9.1 Studies at low risk of bias | 0 | 0 | Mean Difference (IV, Fixed, 95% CI) | 0.0 [0.0, 0.0] |
| 9.2 Methodological concern | 4 | 291 | Mean Difference (IV, Fixed, 95% CI) | 0.76 [‐0.02, 1.54] |
| 10 Linear growth cm/week up to 1 month age Show forest plot | 2 | 245 | Mean Difference (IV, Fixed, 95% CI) | ‐0.16 [‐0.26, ‐0.06] |
|
| 10.1 Studies at low risk of bias | 1 | 122 | Mean Difference (IV, Fixed, 95% CI) | 0.0 [‐0.15, 0.15] |
| 10.2 Methodological concern | 1 | 123 | Mean Difference (IV, Fixed, 95% CI) | ‐0.27 [‐0.40, ‐0.14] |
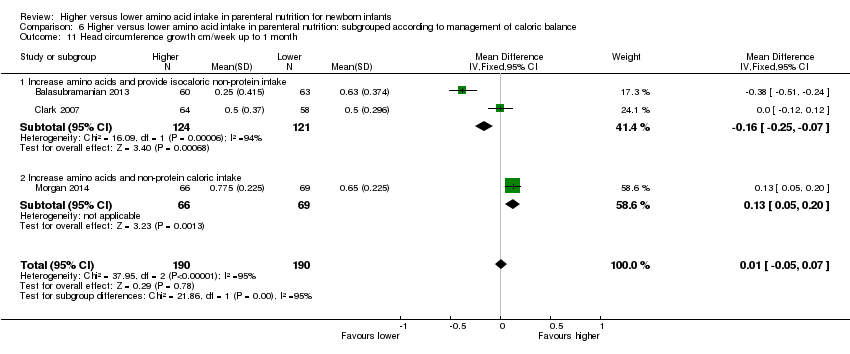
| 11 Head circumference growth cm/week up to 1 month age Show forest plot | 5 | 562 | Mean Difference (IV, Fixed, 95% CI) | 0.07 [0.03, 0.11] |
|
| 11.1 Studies at low risk of bias | 2 | 257 | Mean Difference (IV, Fixed, 95% CI) | 0.09 [0.02, 0.15] |
| 11.2 Methodological concern | 3 | 305 | Mean Difference (IV, Fixed, 95% CI) | 0.06 [0.02, 0.10] |
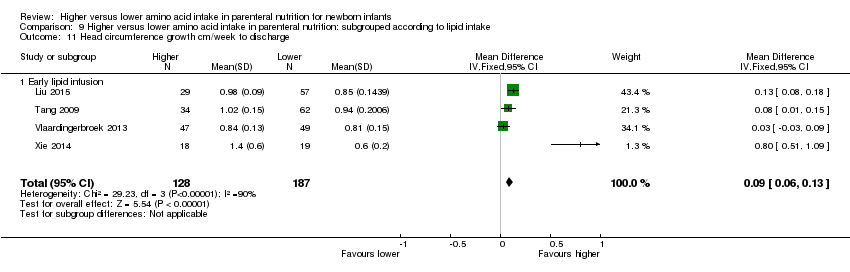
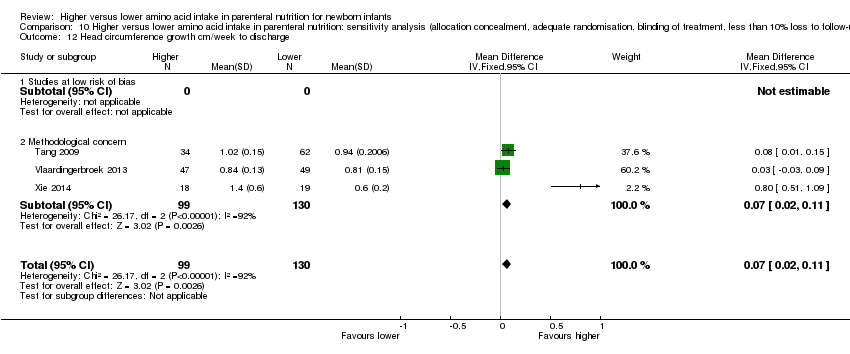
| 12 Head circumference growth cm/week to discharge Show forest plot | 3 | 229 | Mean Difference (IV, Fixed, 95% CI) | 0.07 [0.02, 0.11] |
|
| 12.1 Studies at low risk of bias | 0 | 0 | Mean Difference (IV, Fixed, 95% CI) | 0.0 [0.0, 0.0] |
| 12.2 Methodological concern | 3 | 229 | Mean Difference (IV, Fixed, 95% CI) | 0.07 [0.02, 0.11] |
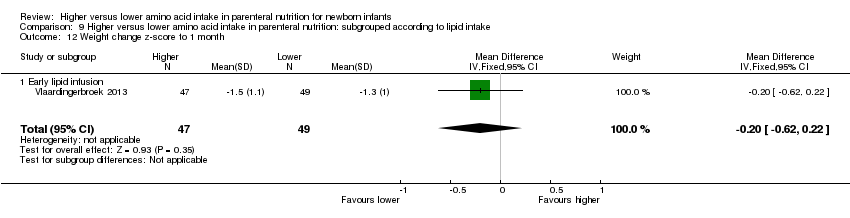
| 13 Weight change z‐score up to 1 month age Show forest plot | 1 | 96 | Mean Difference (IV, Fixed, 95% CI) | ‐0.20 [‐0.62, 0.22] |
|
| 13.1 Studies at low risk of bias | 0 | 0 | Mean Difference (IV, Fixed, 95% CI) | 0.0 [0.0, 0.0] |
| 13.2 Methodological concern | 1 | 96 | Mean Difference (IV, Fixed, 95% CI) | ‐0.20 [‐0.62, 0.22] |
| 14 Weight change z‐score to discharge Show forest plot | 2 | 207 | Mean Difference (IV, Fixed, 95% CI) | 0.01 [‐0.33, 0.36] |
|
| 14.1 Studies at low risk of bias | 0 | 0 | Mean Difference (IV, Fixed, 95% CI) | 0.0 [0.0, 0.0] |
| 14.2 Methodological concern | 2 | 207 | Mean Difference (IV, Fixed, 95% CI) | 0.01 [‐0.33, 0.36] |
| 15 Weight change z‐score post discharge Show forest plot | 2 | 201 | Mean Difference (IV, Fixed, 95% CI) | 0.13 [‐0.26, 0.52] |
|
| 15.1 Studies at low risk of bias | 0 | 0 | Mean Difference (IV, Fixed, 95% CI) | 0.0 [0.0, 0.0] |
| 15.2 Methodological concern | 2 | 201 | Mean Difference (IV, Fixed, 95% CI) | 0.13 [‐0.26, 0.52] |
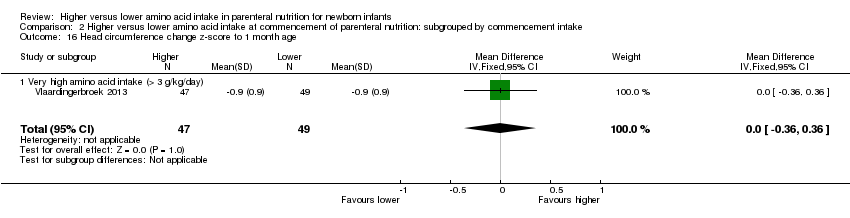
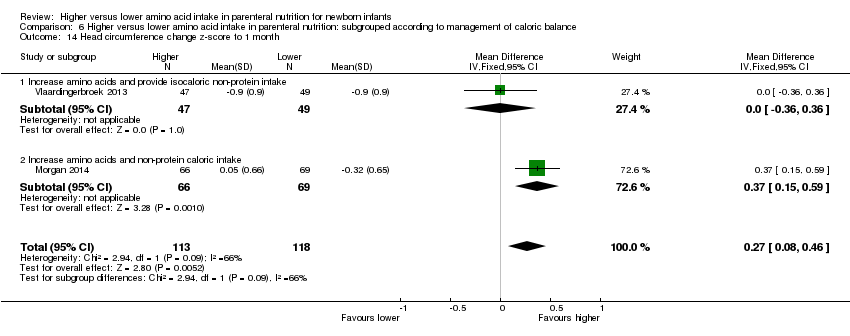
| 16 Head circumference change z‐score up to 1 month Show forest plot | 2 | 231 | Mean Difference (IV, Fixed, 95% CI) | 0.27 [0.08, 0.46] |
|
| 16.1 Studies at low risk of bias | 1 | 135 | Mean Difference (IV, Fixed, 95% CI) | 0.37 [0.15, 0.59] |
| 16.2 Methodological concern | 1 | 96 | Mean Difference (IV, Fixed, 95% CI) | 0.0 [‐0.36, 0.36] |
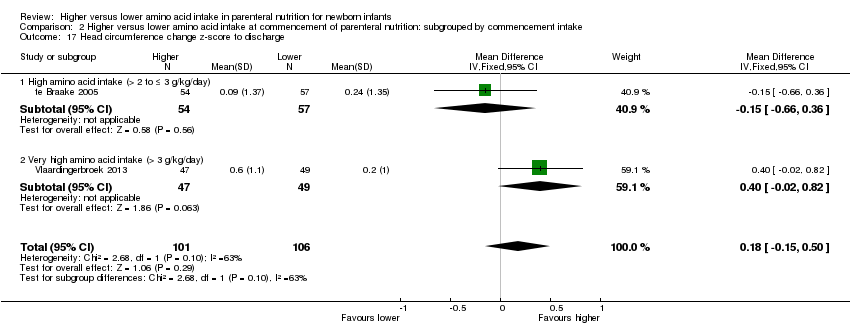
| 17 Head circumference change z‐score to discharge Show forest plot | 2 | 207 | Mean Difference (IV, Fixed, 95% CI) | 0.18 [‐0.15, 0.50] |
|
| 17.1 Studies at low risk of bias | 0 | 0 | Mean Difference (IV, Fixed, 95% CI) | 0.0 [0.0, 0.0] |
| 17.2 Methodological concern | 2 | 207 | Mean Difference (IV, Fixed, 95% CI) | 0.18 [‐0.15, 0.50] |
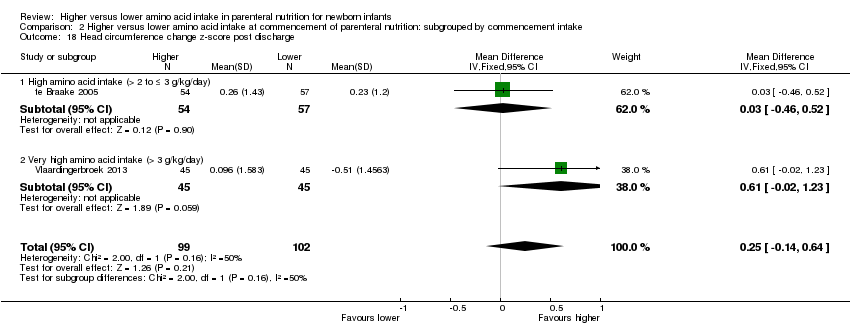
| 18 Head circumference change z‐score post discharge Show forest plot | 1 | 111 | Mean Difference (IV, Fixed, 95% CI) | 0.03 [‐0.46, 0.52] |
|
| 18.1 Studies at low risk of bias | 0 | 0 | Mean Difference (IV, Fixed, 95% CI) | 0.0 [0.0, 0.0] |
| 18.2 Methodological concern | 1 | 111 | Mean Difference (IV, Fixed, 95% CI) | 0.03 [‐0.46, 0.52] |
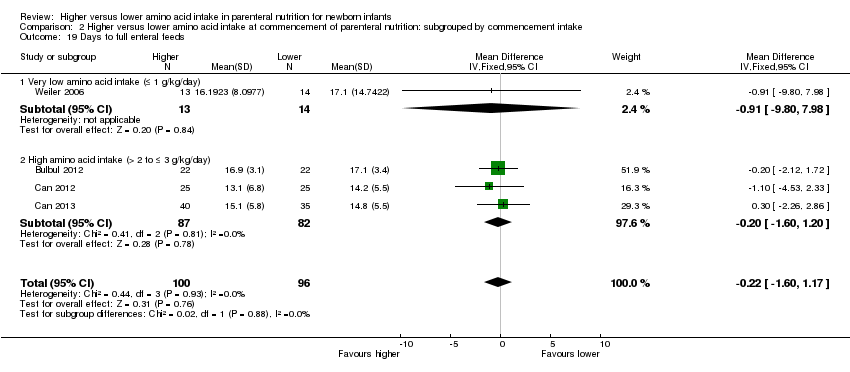
| 19 Days to full enteral feeds Show forest plot | 11 | 778 | Mean Difference (IV, Fixed, 95% CI) | ‐0.19 [‐1.07, 0.70] |
|
| 19.1 Studies at low risk of bias | 3 | 169 | Mean Difference (IV, Fixed, 95% CI) | ‐0.20 [‐1.60, 1.20] |
| 19.2 Methodological concern | 8 | 609 | Mean Difference (IV, Fixed, 95% CI) | ‐0.17 [‐1.32, 0.97] |
| 20 Late‐onset sepsis Show forest plot | 15 | 1255 | Risk Ratio (M‐H, Fixed, 95% CI) | 0.96 [0.79, 1.18] |
|
| 20.1 Studies at low risk of bias | 4 | 461 | Risk Ratio (M‐H, Fixed, 95% CI) | 0.94 [0.71, 1.25] |
| 20.2 Methodological concern | 11 | 794 | Risk Ratio (M‐H, Fixed, 95% CI) | 0.98 [0.73, 1.31] |
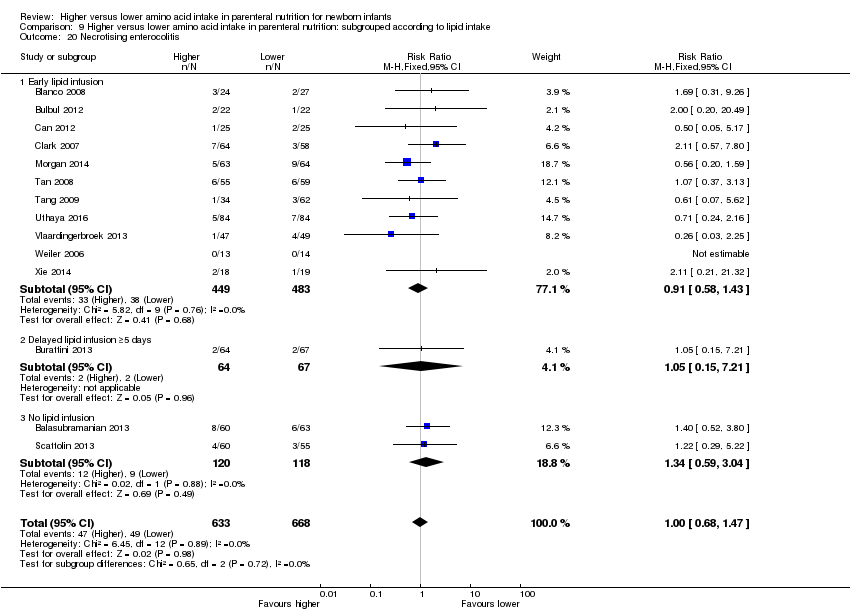
| 21 Necrotising enterocolitis Show forest plot | 14 | 1428 | Risk Ratio (M‐H, Fixed, 95% CI) | 0.93 [0.65, 1.33] |
|
| 21.1 Studies at low risk of bias | 5 | 511 | Risk Ratio (M‐H, Fixed, 95% CI) | 0.89 [0.50, 1.60] |
| 21.2 Methodological concern | 10 | 917 | Risk Ratio (M‐H, Fixed, 95% CI) | 0.95 [0.60, 1.50] |
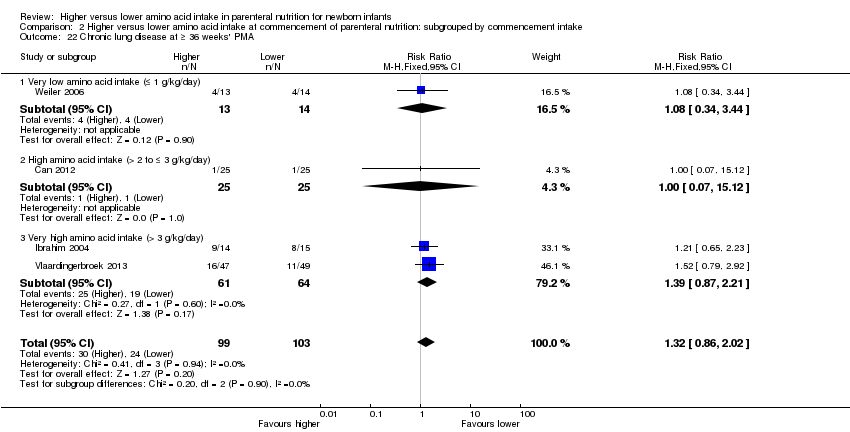
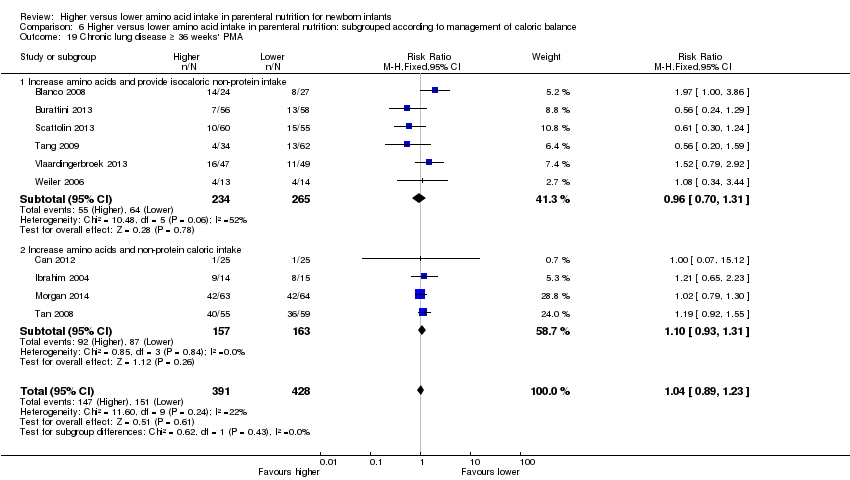
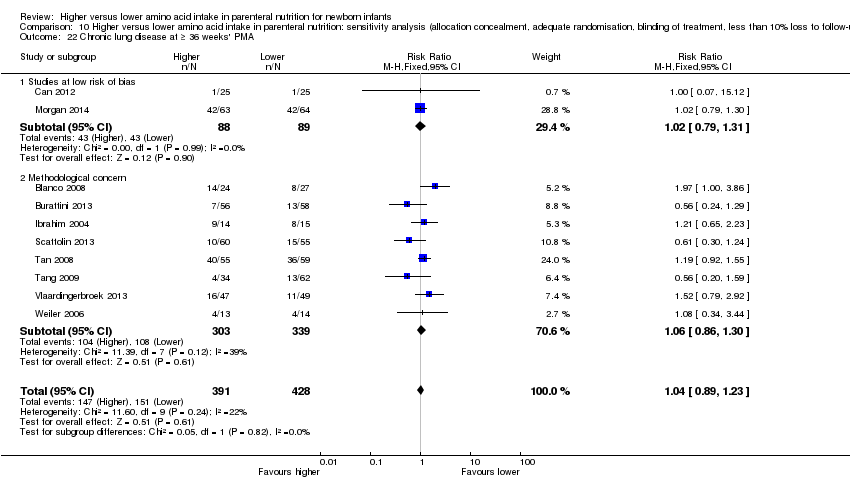
| 22 Chronic lung disease at ≥ 36 weeks' PMA Show forest plot | 10 | 819 | Risk Ratio (M‐H, Fixed, 95% CI) | 1.04 [0.89, 1.23] |
|
| 22.1 Studies at low risk of bias | 2 | 177 | Risk Ratio (M‐H, Fixed, 95% CI) | 1.02 [0.79, 1.31] |
| 22.2 Methodological concern | 8 | 642 | Risk Ratio (M‐H, Fixed, 95% CI) | 1.06 [0.86, 1.30] |
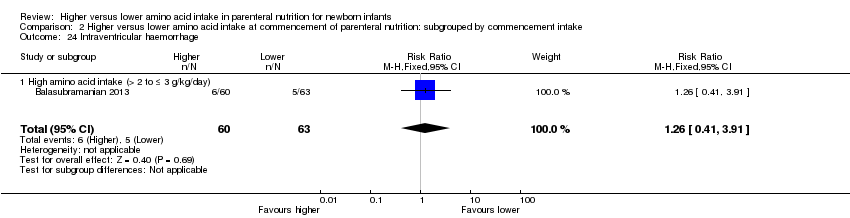
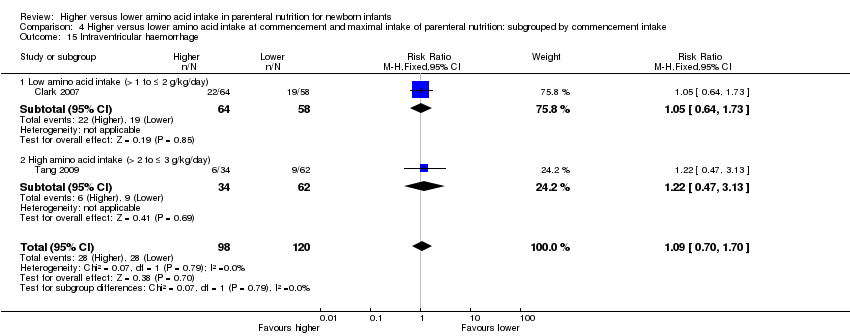
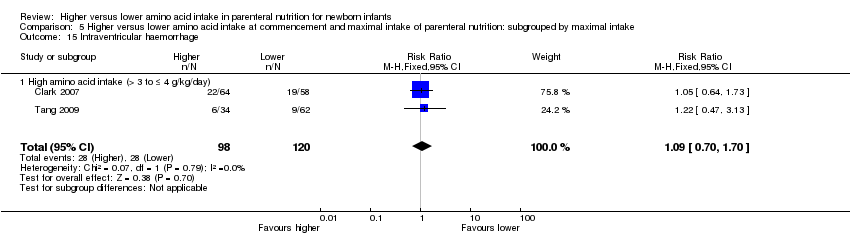
| 23 Intraventricular haemorrhage Show forest plot | 3 | 341 | Risk Ratio (M‐H, Fixed, 95% CI) | 1.12 [0.74, 1.69] |
|
| 23.1 Studies at low risk of bias | 1 | 122 | Risk Ratio (M‐H, Fixed, 95% CI) | 1.05 [0.64, 1.73] |
| 23.2 Methodological concern | 2 | 219 | Risk Ratio (M‐H, Fixed, 95% CI) | 1.23 [0.60, 2.55] |
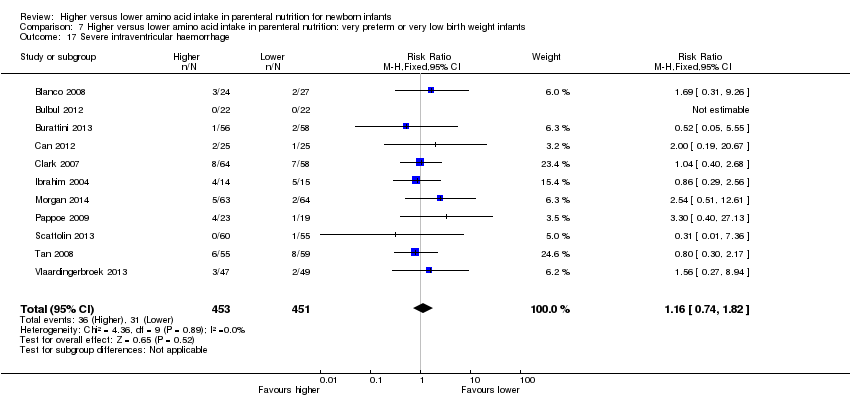
| 24 Severe intraventricular haemorrhage Show forest plot | 11 | 904 | Risk Ratio (M‐H, Fixed, 95% CI) | 1.16 [0.74, 1.82] |
|
| 24.1 Studies at low risk of bias | 4 | 343 | Risk Ratio (M‐H, Fixed, 95% CI) | 1.42 [0.66, 3.03] |
| 24.2 Methodological concern | 7 | 561 | Risk Ratio (M‐H, Fixed, 95% CI) | 1.03 [0.59, 1.81] |
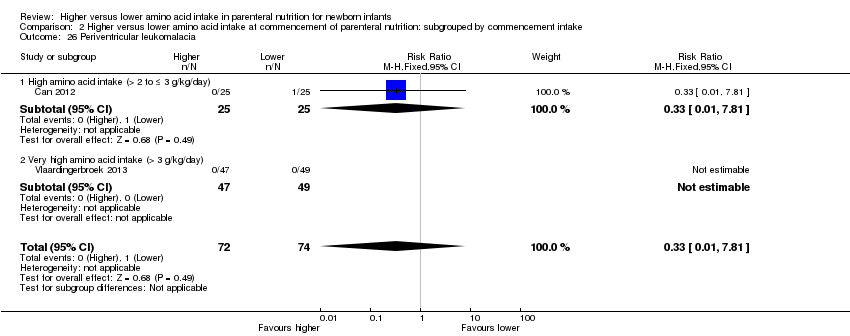
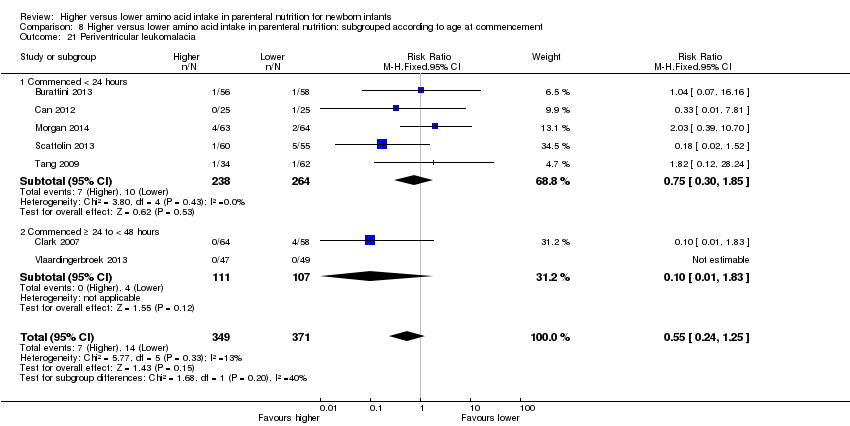
| 25 Periventricular leukomalacia Show forest plot | 7 | 720 | Risk Ratio (M‐H, Fixed, 95% CI) | 0.55 [0.24, 1.25] |
|
| 25.1 Studies at low risk of bias | 3 | 299 | Risk Ratio (M‐H, Fixed, 95% CI) | 0.61 [0.21, 1.81] |
| 25.2 Methodological concern | 4 | 421 | Risk Ratio (M‐H, Fixed, 95% CI) | 0.47 [0.13, 1.69] |
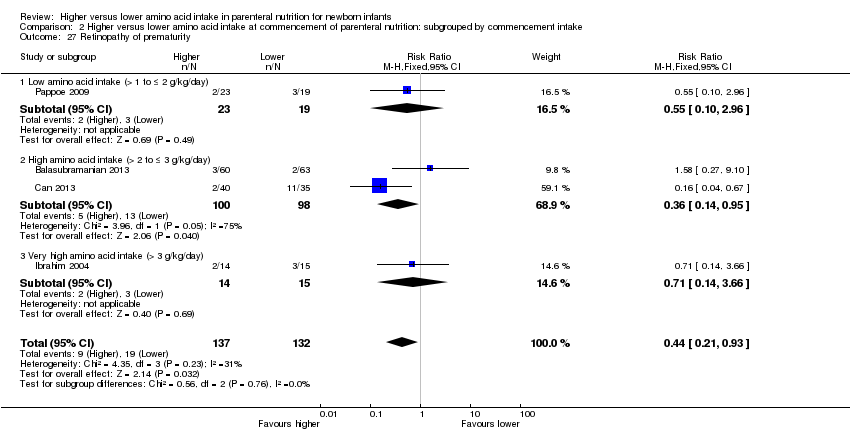
| 26 Retinopathy of prematurity Show forest plot | 4 | 269 | Risk Ratio (M‐H, Fixed, 95% CI) | 0.44 [0.21, 0.93] |
|
| 26.1 Studies at low risk of bias | 1 | 75 | Risk Ratio (M‐H, Fixed, 95% CI) | 0.16 [0.04, 0.67] |
| 26.2 Methodological concern | 3 | 194 | Risk Ratio (M‐H, Fixed, 95% CI) | 0.85 [0.33, 2.22] |
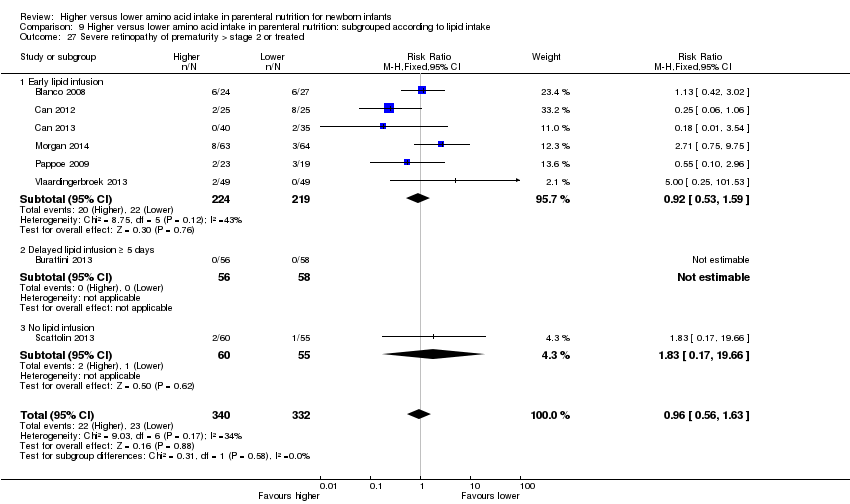
| 27 Severe retinopathy of prematurity (> stage 2 or treated) Show forest plot | 8 | 672 | Risk Ratio (M‐H, Fixed, 95% CI) | 0.96 [0.56, 1.63] |
|
| 27.1 Studies at low risk of bias | 3 | 252 | Risk Ratio (M‐H, Fixed, 95% CI) | 0.77 [0.36, 1.66] |
| 27.2 Methodological concern | 5 | 420 | Risk Ratio (M‐H, Fixed, 95% CI) | 1.20 [0.57, 2.55] |
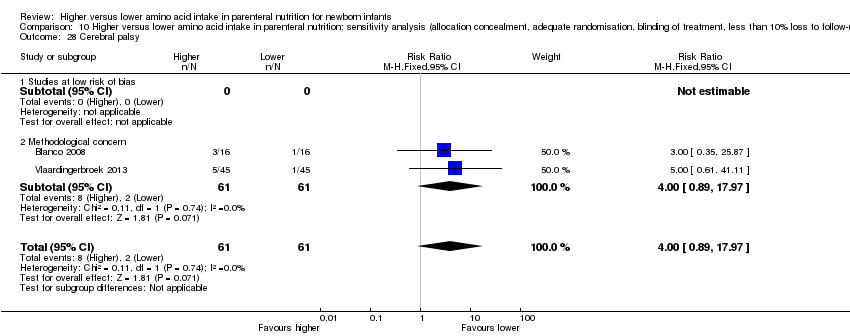
| 28 Cerebral palsy Show forest plot | 2 | 122 | Risk Ratio (M‐H, Fixed, 95% CI) | 4.0 [0.89, 17.97] |
|
| 28.1 Studies at low risk of bias | 0 | 0 | Risk Ratio (M‐H, Fixed, 95% CI) | 0.0 [0.0, 0.0] |
| 28.2 Methodological concern | 2 | 122 | Risk Ratio (M‐H, Fixed, 95% CI) | 4.0 [0.89, 17.97] |
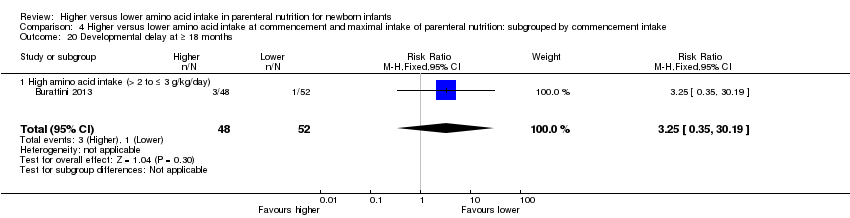
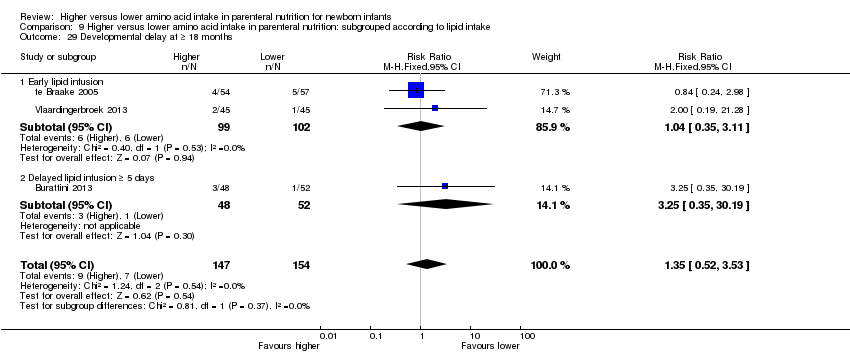
| 29 Developmental delay at ≥ 18 months Show forest plot | 3 | 301 | Risk Ratio (M‐H, Fixed, 95% CI) | 1.35 [0.52, 3.53] |
|
| 29.1 Studies at low risk of bias | 0 | 0 | Risk Ratio (M‐H, Fixed, 95% CI) | 0.0 [0.0, 0.0] |
| 29.2 Methodological concern | 3 | 301 | Risk Ratio (M‐H, Fixed, 95% CI) | 1.35 [0.52, 3.53] |
| 30 Blindness Show forest plot | 2 | 122 | Risk Ratio (M‐H, Fixed, 95% CI) | 2.0 [0.20, 19.91] |
|
| 30.1 Studies at low risk of bias | 0 | 0 | Risk Ratio (M‐H, Fixed, 95% CI) | 0.0 [0.0, 0.0] |
| 30.2 Methodological concern | 2 | 122 | Risk Ratio (M‐H, Fixed, 95% CI) | 2.0 [0.20, 19.91] |
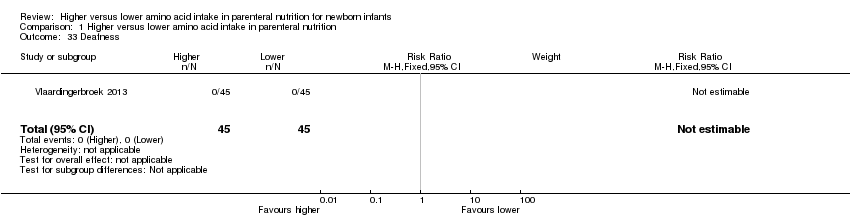
| 31 Deafness Show forest plot | 1 | 90 | Risk Ratio (M‐H, Fixed, 95% CI) | 0.0 [0.0, 0.0] |
|
| 31.1 Studies at low risk of bias | 0 | 0 | Risk Ratio (M‐H, Fixed, 95% CI) | 0.0 [0.0, 0.0] |
| 31.2 Methodological concern | 1 | 90 | Risk Ratio (M‐H, Fixed, 95% CI) | 0.0 [0.0, 0.0] |
| 32 Abnormal serum ammonia > 122 μmol/L Show forest plot | 1 | 61 | Risk Ratio (M‐H, Fixed, 95% CI) | 3.10 [0.13, 73.16] |
|
| 32.1 Studies at low risk of bias | 1 | 61 | Risk Ratio (M‐H, Fixed, 95% CI) | 3.10 [0.13, 73.16] |
| 32.2 Methodological concern | 0 | 0 | Risk Ratio (M‐H, Fixed, 95% CI) | 0.0 [0.0, 0.0] |
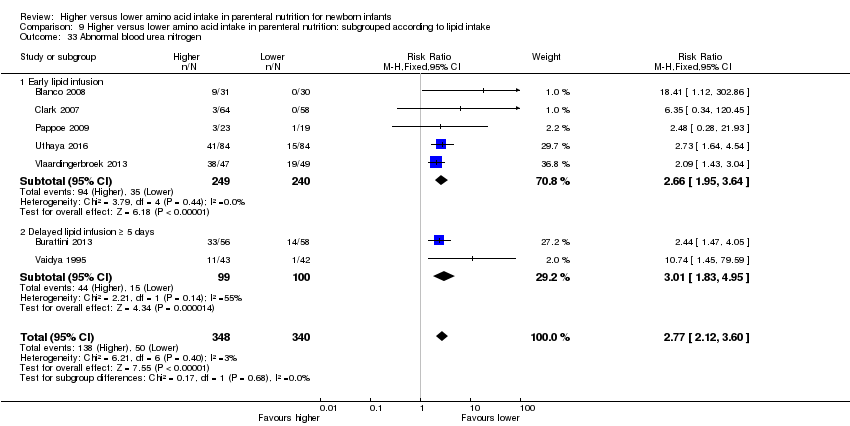
| 33 Abnormal blood urea nitrogen Show forest plot | 7 | 688 | Risk Ratio (M‐H, Fixed, 95% CI) | 2.77 [2.12, 3.60] |
|
| 33.1 Studies at low risk of bias | 2 | 183 | Risk Ratio (M‐H, Fixed, 95% CI) | 12.29 [1.66, 90.79] |
| 33.2 Methodological concern | 5 | 505 | Risk Ratio (M‐H, Fixed, 95% CI) | 2.57 [1.97, 3.34] |
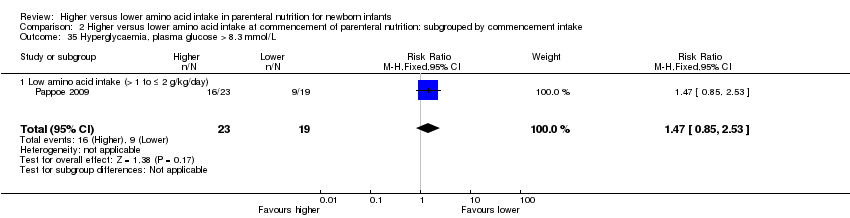
| 34 Hyperglycaemia, plasma glucose > 8.3 mmol/L Show forest plot | 5 | 505 | Risk Ratio (M‐H, Fixed, 95% CI) | 0.69 [0.49, 0.96] |
|
| 34.1 Studies at low risk of bias | 0 | 0 | Risk Ratio (M‐H, Fixed, 95% CI) | 0.0 [0.0, 0.0] |
| 34.2 Methodological concern | 5 | 505 | Risk Ratio (M‐H, Fixed, 95% CI) | 0.69 [0.49, 0.96] |
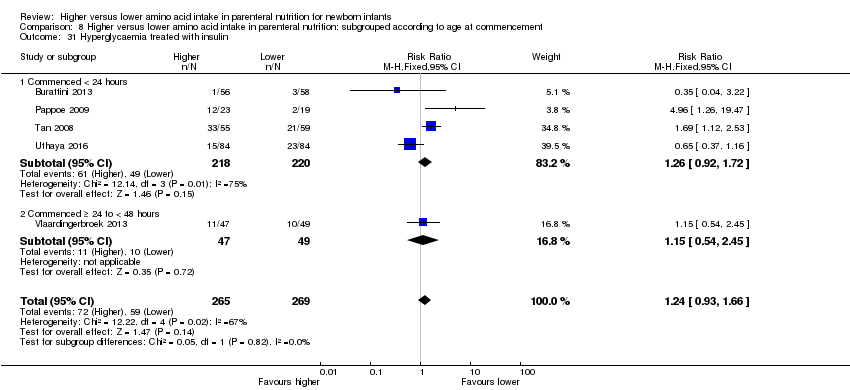
| 35 Hyperglycaemia treated with insulin Show forest plot | 5 | 534 | Risk Ratio (M‐H, Fixed, 95% CI) | 1.24 [0.93, 1.66] |
|
| 35.1 Studies at low risk of bias | 0 | 0 | Risk Ratio (M‐H, Fixed, 95% CI) | 0.0 [0.0, 0.0] |
| 35.2 Methodological concern | 5 | 534 | Risk Ratio (M‐H, Fixed, 95% CI) | 1.24 [0.93, 1.66] |
| 36 Hypoglycaemia Show forest plot | 3 | 376 | Risk Ratio (M‐H, Fixed, 95% CI) | 1.17 [0.84, 1.63] |
|
| 36.1 Studies at low risk of bias | 0 | 0 | Risk Ratio (M‐H, Fixed, 95% CI) | 0.0 [0.0, 0.0] |
| 36.2 Methodological concern | 3 | 376 | Risk Ratio (M‐H, Fixed, 95% CI) | 1.17 [0.84, 1.63] |
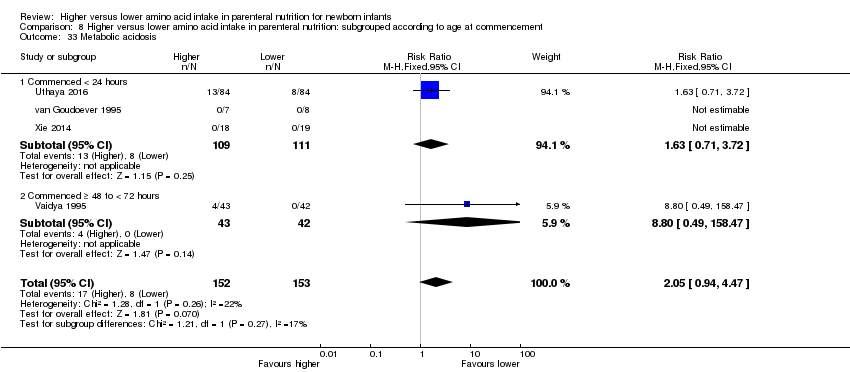
| 37 Metabolic acidosis Show forest plot | 4 | 305 | Risk Ratio (M‐H, Fixed, 95% CI) | 2.05 [0.94, 4.47] |
|
| 37.1 Studies at low risk of bias | 0 | 0 | Risk Ratio (M‐H, Fixed, 95% CI) | 0.0 [0.0, 0.0] |
| 37.2 Methodological concern | 4 | 305 | Risk Ratio (M‐H, Fixed, 95% CI) | 2.05 [0.94, 4.47] |
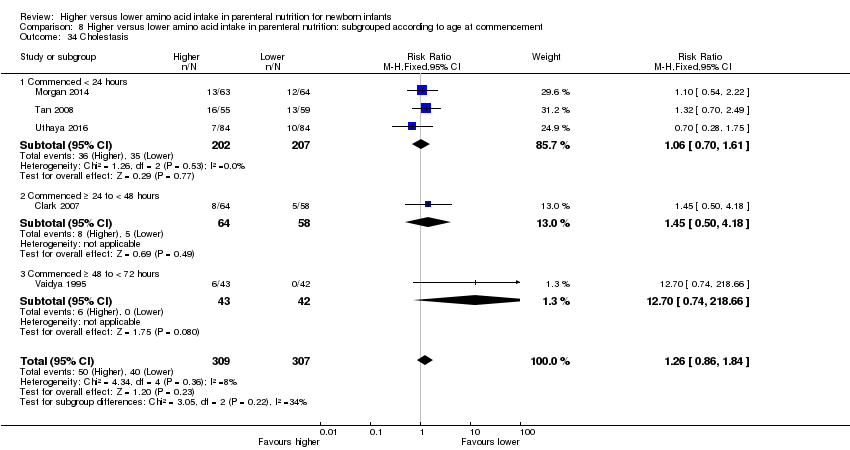
| 38 Cholestasis Show forest plot | 5 | 616 | Risk Ratio (M‐H, Fixed, 95% CI) | 1.26 [0.86, 1.84] |
|
| 38.1 Studies at low risk of bias | 2 | 249 | Risk Ratio (M‐H, Fixed, 95% CI) | 1.21 [0.67, 2.17] |
| 38.2 Methodological concern | 3 | 367 | Risk Ratio (M‐H, Fixed, 95% CI) | 1.30 [0.79, 2.13] |