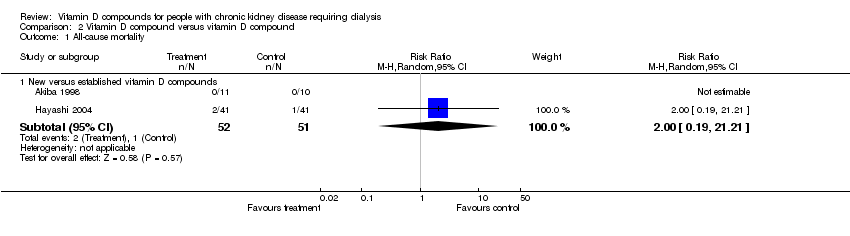
| 1 All‐cause mortality Show forest plot | 5 | 233 | Risk Ratio (M‐H, Random, 95% CI) | 1.34 [0.34, 5.24] |
|
| 1.1 Established vitamin D compounds | 3 | 168 | Risk Ratio (M‐H, Random, 95% CI) | 1.11 [0.24, 5.05] |
| 1.2 Newer vitamin D compounds | 2 | 65 | Risk Ratio (M‐H, Random, 95% CI) | 3.00 [0.13, 68.26] |
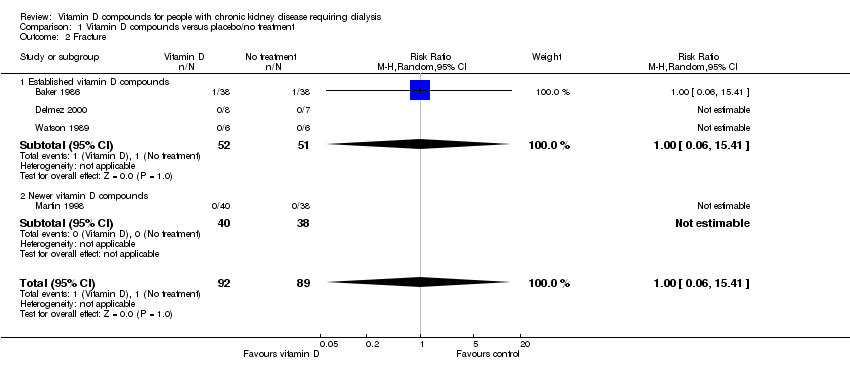
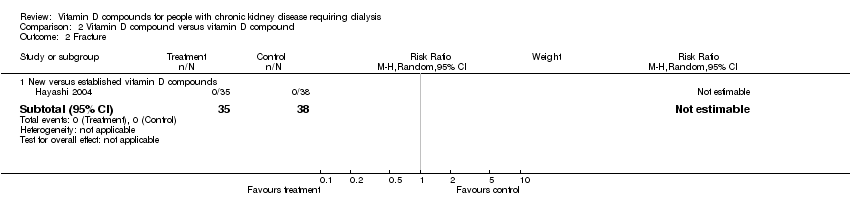
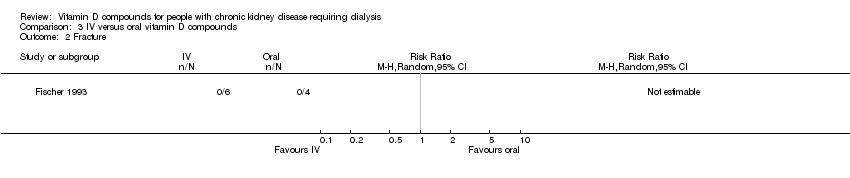
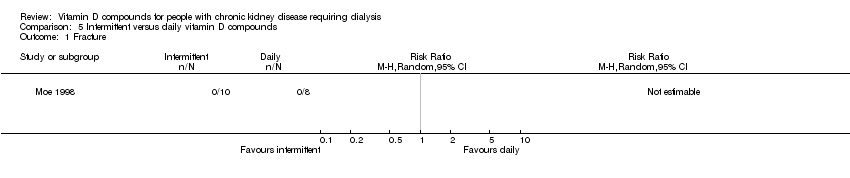
| 2 Fracture Show forest plot | 4 | 181 | Risk Ratio (M‐H, Random, 95% CI) | 1.0 [0.06, 15.41] |
|
| 2.1 Established vitamin D compounds | 3 | 103 | Risk Ratio (M‐H, Random, 95% CI) | 1.0 [0.06, 15.41] |
| 2.2 Newer vitamin D compounds | 1 | 78 | Risk Ratio (M‐H, Random, 95% CI) | 0.0 [0.0, 0.0] |
| 3 Development of bone pain Show forest plot | 4 | 109 | Risk Ratio (M‐H, Random, 95% CI) | 0.29 [0.03, 2.63] |
|
| 3.1 Established vitamin D compounds | 3 | 74 | Risk Ratio (M‐H, Random, 95% CI) | 0.41 [0.02, 9.25] |
| 3.2 Newer vitamin D compounds | 1 | 35 | Risk Ratio (M‐H, Random, 95% CI) | 0.20 [0.01, 4.65] |
| 4 Parathyroidectomy Show forest plot | 2 | | Risk Ratio (M‐H, Random, 95% CI) | Subtotals only |
|
| 4.1 Established vitamin D compounds | 2 | 133 | Risk Ratio (M‐H, Random, 95% CI) | 0.82 [0.05, 12.47] |
| 4.2 Newer vitamin D compounds | 0 | 0 | Risk Ratio (M‐H, Random, 95% CI) | 0.0 [0.0, 0.0] |
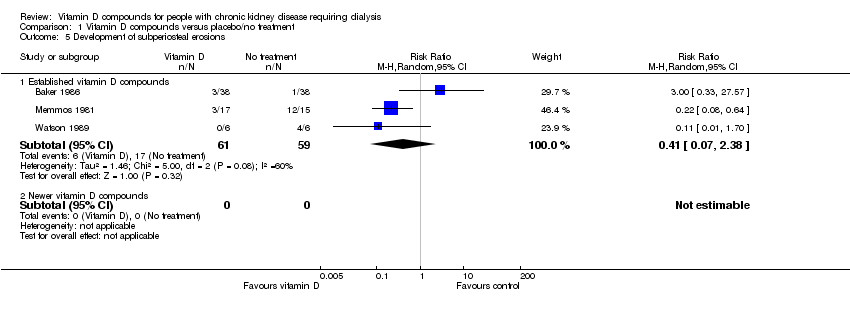
| 5 Development of subperiosteal erosions Show forest plot | 3 | | Risk Ratio (M‐H, Random, 95% CI) | Subtotals only |
|
| 5.1 Established vitamin D compounds | 3 | 120 | Risk Ratio (M‐H, Random, 95% CI) | 0.41 [0.07, 2.38] |
| 5.2 Newer vitamin D compounds | 0 | 0 | Risk Ratio (M‐H, Random, 95% CI) | 0.0 [0.0, 0.0] |
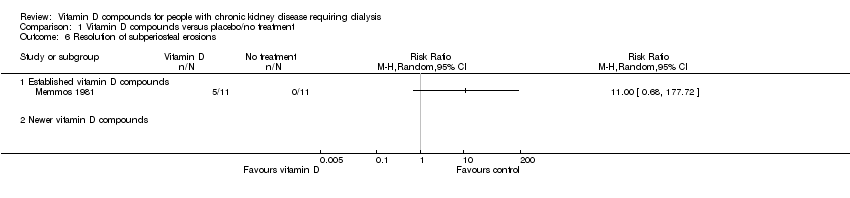
| 6 Resolution of subperiosteal erosions Show forest plot | 1 | | Risk Ratio (M‐H, Random, 95% CI) | Totals not selected |
|
| 6.1 Established vitamin D compounds | 1 | | Risk Ratio (M‐H, Random, 95% CI) | 0.0 [0.0, 0.0] |
| 6.2 Newer vitamin D compounds | 0 | | Risk Ratio (M‐H, Random, 95% CI) | 0.0 [0.0, 0.0] |
| 7 Development of vascular calcification Show forest plot | 2 | | Risk Ratio (M‐H, Random, 95% CI) | Subtotals only |
|
| 7.1 Established vitamin D compounds | 2 | 103 | Risk Ratio (M‐H, Random, 95% CI) | 1.09 [0.45, 2.67] |
| 7.2 Newer vitamin D compounds | 0 | 0 | Risk Ratio (M‐H, Random, 95% CI) | 0.0 [0.0, 0.0] |
| 8 Progression of vascular calcification Show forest plot | 1 | | Risk Ratio (M‐H, Random, 95% CI) | Totals not selected |
|
| 8.1 Established vitamin D compounds | 1 | | Risk Ratio (M‐H, Random, 95% CI) | 0.0 [0.0, 0.0] |
| 8.2 Newer vitamin D compounds | 0 | | Risk Ratio (M‐H, Random, 95% CI) | 0.0 [0.0, 0.0] |
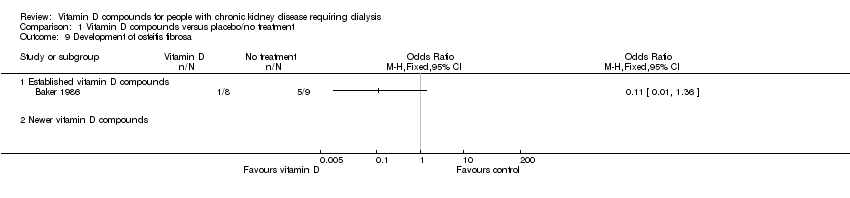
| 9 Development of osteitis fibrosa Show forest plot | 1 | | Odds Ratio (M‐H, Fixed, 95% CI) | Totals not selected |
|
| 9.1 Established vitamin D compounds | 1 | | Odds Ratio (M‐H, Fixed, 95% CI) | 0.0 [0.0, 0.0] |
| 9.2 Newer vitamin D compounds | 0 | | Odds Ratio (M‐H, Fixed, 95% CI) | 0.0 [0.0, 0.0] |
| 10 Development of osteomalacia Show forest plot | 1 | | Odds Ratio (M‐H, Fixed, 95% CI) | Totals not selected |
|
| 10.1 Established vitamin D compounds | 1 | | Odds Ratio (M‐H, Fixed, 95% CI) | 0.0 [0.0, 0.0] |
| 10.2 Newer vitamin D compounds | 0 | | Odds Ratio (M‐H, Fixed, 95% CI) | 0.0 [0.0, 0.0] |
| 11 End of treatment parathyroid hormone (pg/mL) Show forest plot | 6 | 212 | Mean Difference (IV, Random, 95% CI) | ‐196.05 [‐298.43, ‐93.66] |
|
| 11.1 Established vitamin D compounds | 4 | 104 | Mean Difference (IV, Random, 95% CI) | ‐220.54 [‐473.63, 32.55] |
| 11.2 Newer vitamin D compounds | 2 | 108 | Mean Difference (IV, Random, 95% CI) | ‐183.88 [‐217.88, ‐149.89] |
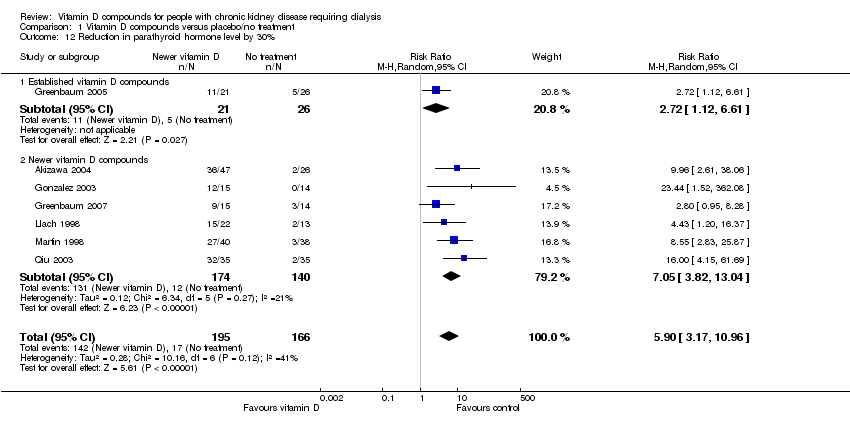
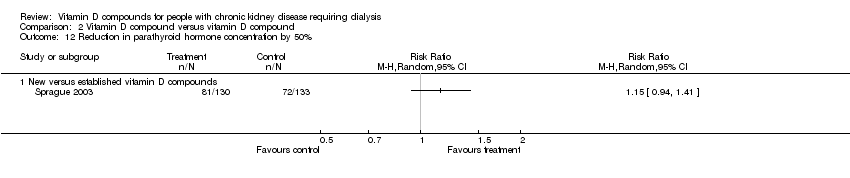
| 12 Reduction in parathyroid hormone level by 30% Show forest plot | 7 | 361 | Risk Ratio (M‐H, Random, 95% CI) | 5.90 [3.17, 10.96] |
|
| 12.1 Established vitamin D compounds | 1 | 47 | Risk Ratio (M‐H, Random, 95% CI) | 2.72 [1.12, 6.61] |
| 12.2 Newer vitamin D compounds | 6 | 314 | Risk Ratio (M‐H, Random, 95% CI) | 7.05 [3.82, 13.04] |
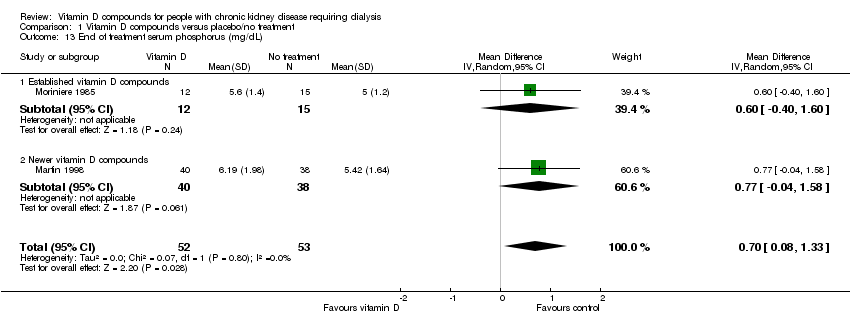
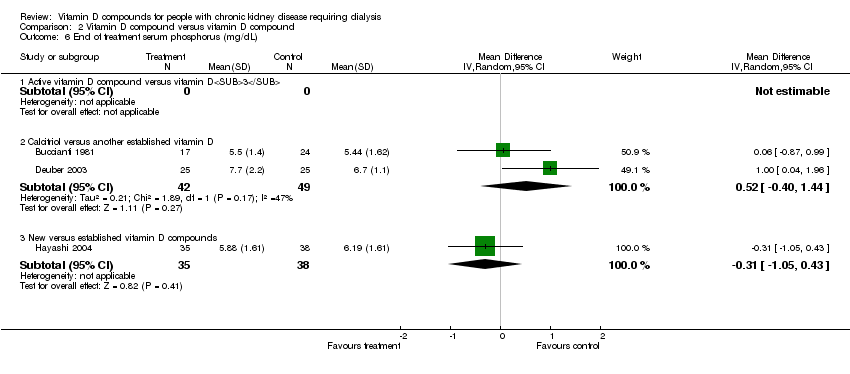
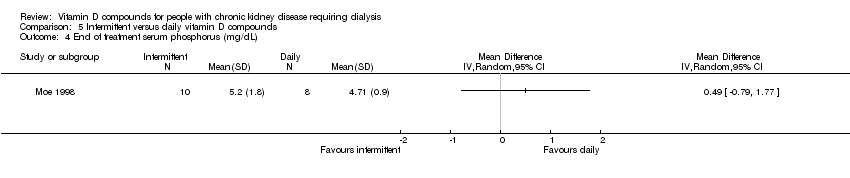
| 13 End of treatment serum phosphorus (mg/dL) Show forest plot | 2 | 105 | Mean Difference (IV, Random, 95% CI) | 0.70 [0.08, 1.33] |
|
| 13.1 Established vitamin D compounds | 1 | 27 | Mean Difference (IV, Random, 95% CI) | 0.60 [‐0.40, 1.60] |
| 13.2 Newer vitamin D compounds | 1 | 78 | Mean Difference (IV, Random, 95% CI) | 0.77 [‐0.04, 1.58] |
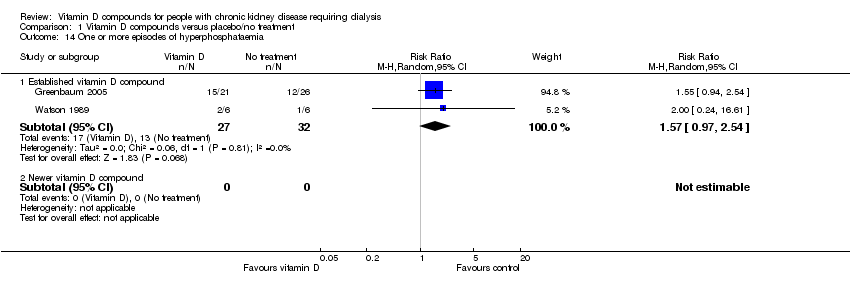
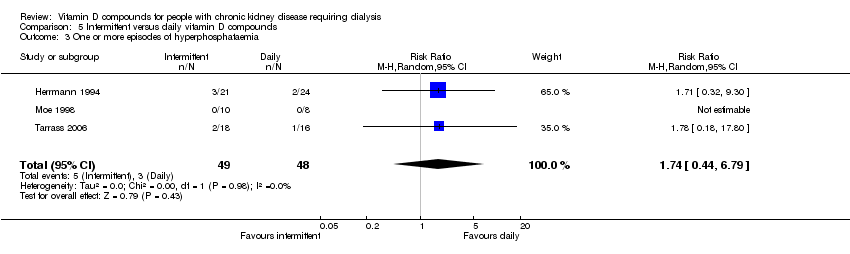
| 14 One or more episodes of hyperphosphataemia Show forest plot | 2 | | Risk Ratio (M‐H, Random, 95% CI) | Subtotals only |
|
| 14.1 Established vitamin D compound | 2 | 59 | Risk Ratio (M‐H, Random, 95% CI) | 1.57 [0.97, 2.54] |
| 14.2 Newer vitamin D compound | 0 | 0 | Risk Ratio (M‐H, Random, 95% CI) | 0.0 [0.0, 0.0] |
| 15 End of treatment serum calcium (mg/dL) Show forest plot | 2 | 105 | Mean Difference (IV, Random, 95% CI) | 0.36 [‐0.26, 0.98] |
|
| 15.1 Established vitamin D compounds | 1 | 27 | Mean Difference (IV, Random, 95% CI) | 0.0 [‐0.61, 0.61] |
| 15.2 Newer vitamin D compounds | 1 | 78 | Mean Difference (IV, Random, 95% CI) | 0.64 [0.22, 1.06] |
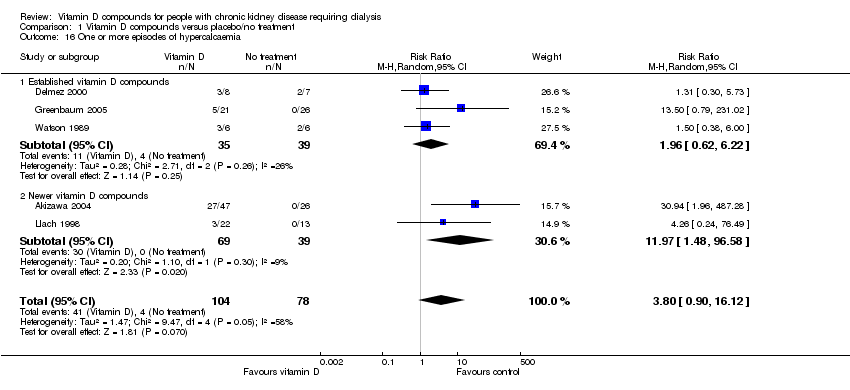
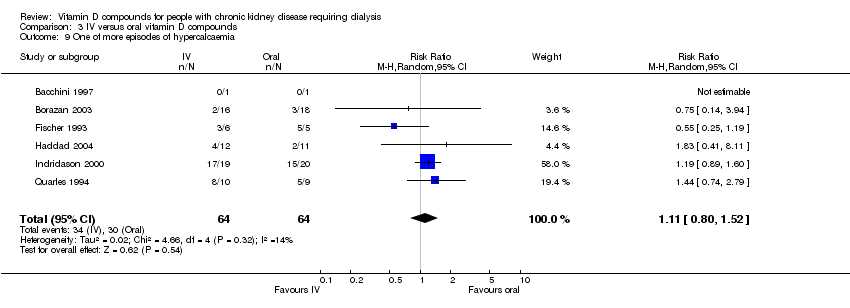
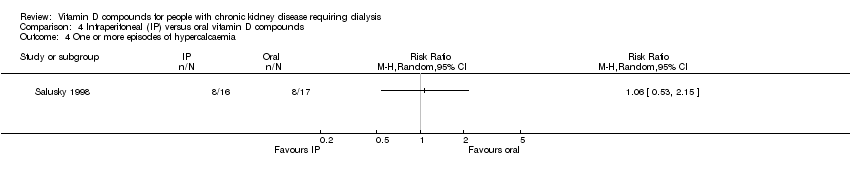
| 16 One or more episodes of hypercalcaemia Show forest plot | 5 | 182 | Risk Ratio (M‐H, Random, 95% CI) | 3.80 [0.90, 16.12] |
|
| 16.1 Established vitamin D compounds | 3 | 74 | Risk Ratio (M‐H, Random, 95% CI) | 1.96 [0.62, 6.22] |
| 16.2 Newer vitamin D compounds | 2 | 108 | Risk Ratio (M‐H, Random, 95% CI) | 11.97 [1.48, 96.58] |
| 17 Withdrawal of treatment due to hypercalcaemia Show forest plot | 4 | 196 | Risk Ratio (M‐H, Random, 95% CI) | 4.17 [1.36, 12.77] |
|
| 17.1 Established vitamin D compounds | 2 | 88 | Risk Ratio (M‐H, Random, 95% CI) | 3.66 [0.96, 14.03] |
| 17.2 Newer vitamin D compounds | 2 | 108 | Risk Ratio (M‐H, Random, 95% CI) | 5.61 [0.74, 42.45] |
| 18 One or more episodes of elevated calcium x phosphorus product Show forest plot | 1 | | Risk Ratio (M‐H, Random, 95% CI) | Totals not selected |
|
| 18.1 Established vitamin D compounds | 1 | | Risk Ratio (M‐H, Random, 95% CI) | 0.0 [0.0, 0.0] |
| 18.2 Newer vitamin D compounds | 0 | | Risk Ratio (M‐H, Random, 95% CI) | 0.0 [0.0, 0.0] |
| 19 End of treatment alkaline phosphatase (U/L) Show forest plot | 3 | 135 | Mean Difference (IV, Random, 95% CI) | ‐24.34 [‐44.34, ‐4.33] |
|
| 19.1 Established vitamin D compounds | 1 | 27 | Mean Difference (IV, Random, 95% CI) | ‐16.0 [‐54.83, 22.83] |
| 19.2 Newer vitamin D compounds | 2 | 108 | Mean Difference (IV, Random, 95% CI) | ‐27.35 [‐50.69, ‐4.01] |