Scolaris Content Display Scolaris Content Display

Methodological quality graph: review authors' judgements about each methodological quality item presented as percentages across all included trials.
Figuras y tablas -
Figure 1

Methodological quality graph: review authors' judgements about each methodological quality item presented as percentages across all included trials.

Methodological quality summary: review authors' judgements about each methodological quality item for each included study.
Figuras y tablas -
Figure 2

Methodological quality summary: review authors' judgements about each methodological quality item for each included study.

Trial sequential analysis illustrating that the cumulative Z‐curve (blue) has not crossed the monitoring boundary (red) but have surpassed the information size (n = 232) needed to detect of reject an effect size corresponding to a number needed to treat of 10 patient (or fewer) for ribavirin. Thus we can rule out a number needed to treat of 10 patients (or fewer) for ribavirin regarding sustained virological response.Trial sequential analysis was performed with a type I error of 5% and type II error of 20% (80% power). We assumed a baseline event rate of 97% without sustained virological response in the placebo/no intervention group. We used an event rate of 87% (number needed to treat = 10 patients) without sustained virological response in the ribavirin group.
Figuras y tablas -
Figure 3

Trial sequential analysis illustrating that the cumulative Z‐curve (blue) has not crossed the monitoring boundary (red) but have surpassed the information size (n = 232) needed to detect of reject an effect size corresponding to a number needed to treat of 10 patient (or fewer) for ribavirin. Thus we can rule out a number needed to treat of 10 patients (or fewer) for ribavirin regarding sustained virological response.

Trial sequential analysis was performed with a type I error of 5% and type II error of 20% (80% power). We assumed a baseline event rate of 97% without sustained virological response in the placebo/no intervention group. We used an event rate of 87% (number needed to treat = 10 patients) without sustained virological response in the ribavirin group.

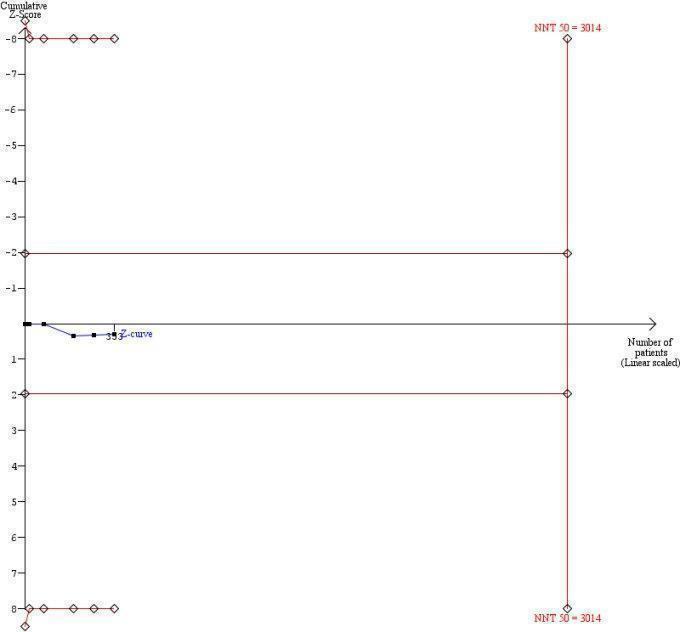
Trial sequential analysis illustrating that the cumulative Z‐curve (blue) has not crossed the monitoring boundary (red) nor reached the information size (n = 3014) needed to detect of reject an effect size corresponding to a number needed to treat of 50 (or fewer) for ribavirin. Thus we can not rule out a number needed to treat of 50 (or fewer) for ribavirin regarding sustained virological response. Additionally 2661 (3014 ‐ 353) patients are needed to detect or reject this effect size.Trial sequential analysis was performed with a type I error of 5% and type II error of 20% (80% power). We assumed a baseline event rate of 97% for sustained virological response in the placebo/no intervention group. We used an event rate of 95% (number needed to treat = 50) without sustained virological response in the ribavirin group.
Figuras y tablas -
Figure 4

Trial sequential analysis illustrating that the cumulative Z‐curve (blue) has not crossed the monitoring boundary (red) nor reached the information size (n = 3014) needed to detect of reject an effect size corresponding to a number needed to treat of 50 (or fewer) for ribavirin. Thus we can not rule out a number needed to treat of 50 (or fewer) for ribavirin regarding sustained virological response. Additionally 2661 (3014 ‐ 353) patients are needed to detect or reject this effect size.

Trial sequential analysis was performed with a type I error of 5% and type II error of 20% (80% power). We assumed a baseline event rate of 97% for sustained virological response in the placebo/no intervention group. We used an event rate of 95% (number needed to treat = 50) without sustained virological response in the ribavirin group.

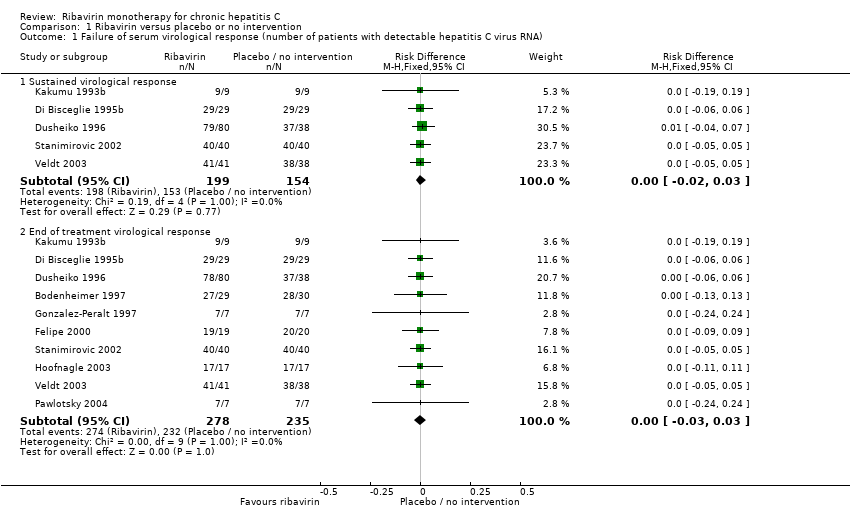
Comparison 1 Ribavirin versus placebo or no intervention, Outcome 1 Failure of serum virological response (number of patients with detectable hepatitis C virus RNA).
Figuras y tablas -
Analysis 1.1

Comparison 1 Ribavirin versus placebo or no intervention, Outcome 1 Failure of serum virological response (number of patients with detectable hepatitis C virus RNA).

Comparison 1 Ribavirin versus placebo or no intervention, Outcome 2 Liver‐related morbidity and all‐cause mortality.
Figuras y tablas -
Analysis 1.2

Comparison 1 Ribavirin versus placebo or no intervention, Outcome 2 Liver‐related morbidity and all‐cause mortality.

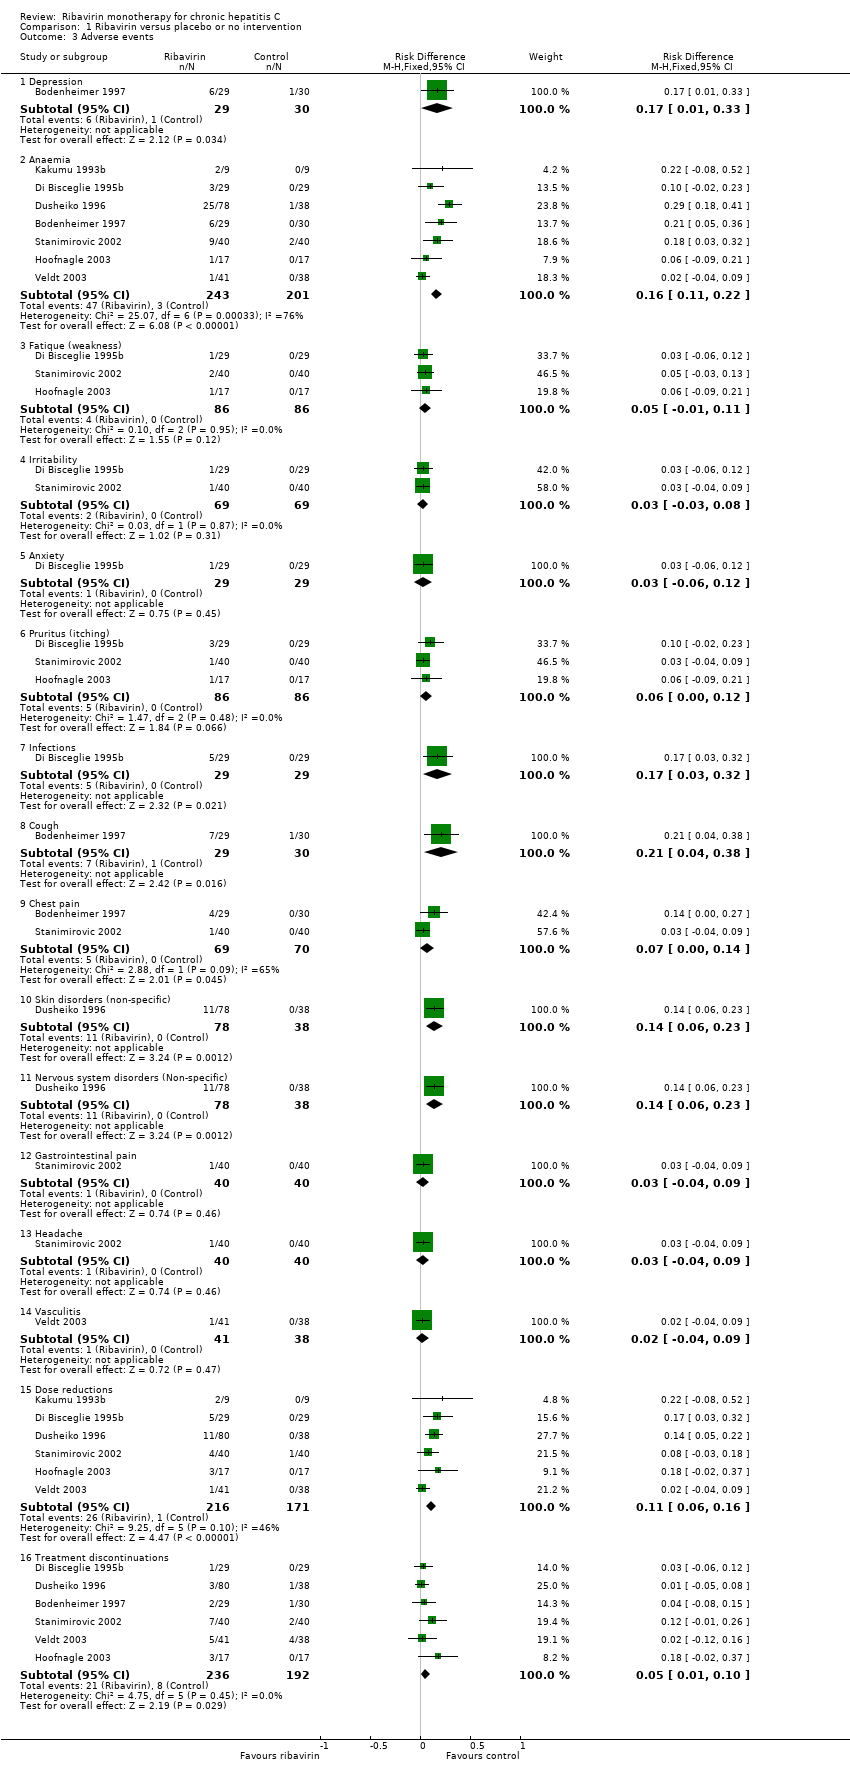
Comparison 1 Ribavirin versus placebo or no intervention, Outcome 3 Adverse events.
Figuras y tablas -
Analysis 1.3

Comparison 1 Ribavirin versus placebo or no intervention, Outcome 3 Adverse events.

Comparison 1 Ribavirin versus placebo or no intervention, Outcome 4 Failure of biochemical response (number of patients with elevated transaminase).
Figuras y tablas -
Analysis 1.4

Comparison 1 Ribavirin versus placebo or no intervention, Outcome 4 Failure of biochemical response (number of patients with elevated transaminase).

Comparison 1 Ribavirin versus placebo or no intervention, Outcome 5 Failure of histologic response (number of patients without improvement in liver histology).
Figuras y tablas -
Analysis 1.5

Comparison 1 Ribavirin versus placebo or no intervention, Outcome 5 Failure of histologic response (number of patients without improvement in liver histology).

Comparison 1 Ribavirin versus placebo or no intervention, Outcome 6 Quality of life.
Figuras y tablas -
Analysis 1.6

Comparison 1 Ribavirin versus placebo or no intervention, Outcome 6 Quality of life.

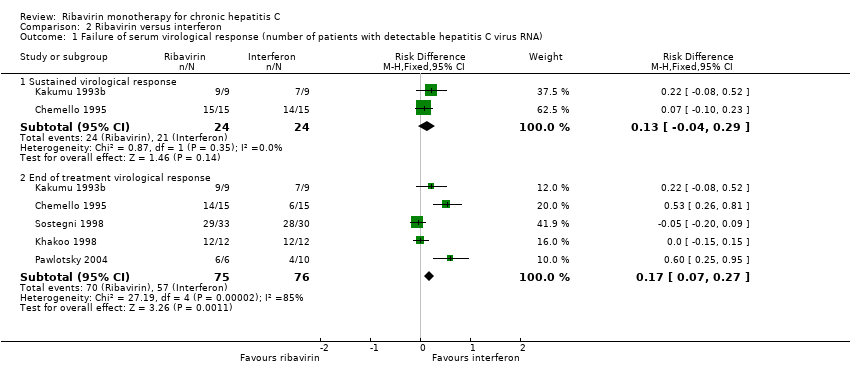
Comparison 2 Ribavirin versus interferon, Outcome 1 Failure of serum virological response (number of patients with detectable hepatitis C virus RNA).
Figuras y tablas -
Analysis 2.1

Comparison 2 Ribavirin versus interferon, Outcome 1 Failure of serum virological response (number of patients with detectable hepatitis C virus RNA).

Comparison 2 Ribavirin versus interferon, Outcome 2 Liver‐related and all‐cause morbidity and mortality.
Figuras y tablas -
Analysis 2.2

Comparison 2 Ribavirin versus interferon, Outcome 2 Liver‐related and all‐cause morbidity and mortality.

Comparison 2 Ribavirin versus interferon, Outcome 3 Failure of biochemical response (number of patients with elevated alanine aminotransferase).
Figuras y tablas -
Analysis 2.3

Comparison 2 Ribavirin versus interferon, Outcome 3 Failure of biochemical response (number of patients with elevated alanine aminotransferase).

Comparison 2 Ribavirin versus interferon, Outcome 4 Adverse events.
Figuras y tablas -
Analysis 2.4

Comparison 2 Ribavirin versus interferon, Outcome 4 Adverse events.

Comparison 1. Ribavirin versus placebo or no intervention

Outcome or subgroup title

No. of studies

No. of participants

Statistical method

Effect size

1 Failure of serum virological response (number of patients with detectable hepatitis C virus RNA) Show forest plot

10

Risk Difference (M‐H, Fixed, 95% CI)

Subtotals only

1.1 Sustained virological response

5

353

Risk Difference (M‐H, Fixed, 95% CI)

0.00 [‐0.02, 0.03]

1.2 End of treatment virological response

10

513

Risk Difference (M‐H, Fixed, 95% CI)

‐ [‐0.03, 0.03]

2 Liver‐related morbidity and all‐cause mortality Show forest plot

11

521

Risk Difference (M‐H, Fixed, 95% CI)

0.00 [‐0.02, 0.03]

3 Adverse events Show forest plot

7

Risk Difference (M‐H, Fixed, 95% CI)

Subtotals only

3.1 Depression

1

59

Risk Difference (M‐H, Fixed, 95% CI)

0.17 [0.01, 0.33]

3.2 Anaemia

7

444

Risk Difference (M‐H, Fixed, 95% CI)

0.16 [0.11, 0.22]

3.3 Fatique (weakness)

3

172

Risk Difference (M‐H, Fixed, 95% CI)

0.05 [‐0.01, 0.11]

3.4 Irritability

2

138

Risk Difference (M‐H, Fixed, 95% CI)

0.03 [‐0.03, 0.08]

3.5 Anxiety

1

58

Risk Difference (M‐H, Fixed, 95% CI)

0.03 [‐0.06, 0.12]

3.6 Pruritus (itching)

3

172

Risk Difference (M‐H, Fixed, 95% CI)

0.06 [‐0.00, 0.12]

3.7 Infections

1

58

Risk Difference (M‐H, Fixed, 95% CI)

0.17 [0.03, 0.32]

3.8 Cough

1

59

Risk Difference (M‐H, Fixed, 95% CI)

0.21 [0.04, 0.38]

3.9 Chest pain

2

139

Risk Difference (M‐H, Fixed, 95% CI)

0.07 [0.00, 0.14]

3.10 Skin disorders (non‐specific)

1

116

Risk Difference (M‐H, Fixed, 95% CI)

0.14 [0.06, 0.23]

3.11 Nervous system disorders (Non‐specific)

1

116

Risk Difference (M‐H, Fixed, 95% CI)

0.14 [0.06, 0.23]

3.12 Gastrointestinal pain

1

80

Risk Difference (M‐H, Fixed, 95% CI)

0.03 [‐0.04, 0.09]

3.13 Headache

1

80

Risk Difference (M‐H, Fixed, 95% CI)

0.03 [‐0.04, 0.09]

3.14 Vasculitis

1

79

Risk Difference (M‐H, Fixed, 95% CI)

0.02 [‐0.04, 0.09]

3.15 Dose reductions

6

387

Risk Difference (M‐H, Fixed, 95% CI)

0.11 [0.06, 0.16]

3.16 Treatment discontinuations

6

428

Risk Difference (M‐H, Fixed, 95% CI)

0.05 [0.01, 0.10]

4 Failure of biochemical response (number of patients with elevated transaminase) Show forest plot

10

Risk Difference (M‐H, Fixed, 95% CI)

Subtotals only

4.1 Sustained biochemical response

5

294

Risk Difference (M‐H, Fixed, 95% CI)

0.00 [‐0.05, 0.06]

4.2 End of treatment biochemical response

10

509

Risk Difference (M‐H, Fixed, 95% CI)

‐0.23 [‐0.29, ‐0.17]

5 Failure of histologic response (number of patients without improvement in liver histology) Show forest plot

3

Risk Difference (M‐H, Fixed, 95% CI)

Subtotals only

5.1 Combined necro‐inflammatory and fibrosis score (Intention to treat)

3

211

Risk Difference (M‐H, Fixed, 95% CI)

‐0.14 [‐0.25, ‐0.02]

5.2 Combined necro‐inflammatory and fibrosis score (Per protocol)

3

156

Risk Difference (M‐H, Fixed, 95% CI)

‐0.20 [‐0.35, ‐0.06]

6 Quality of life Show forest plot

1

Risk Difference (M‐H, Fixed, 95% CI)

Subtotals only

6.1 Improvement of fatigue at end of treatment

1

59

Risk Difference (M‐H, Fixed, 95% CI)

‐0.11 [‐0.27, 0.06]

Figuras y tablas -
Comparison 1. Ribavirin versus placebo or no intervention
Comparison 2. Ribavirin versus interferon

Outcome or subgroup title

No. of studies

No. of participants

Statistical method

Effect size

1 Failure of serum virological response (number of patients with detectable hepatitis C virus RNA) Show forest plot

5

Risk Difference (M‐H, Fixed, 95% CI)

Subtotals only

1.1 Sustained virological response

2

48

Risk Difference (M‐H, Fixed, 95% CI)

0.13 [‐0.04, 0.29]

1.2 End of treatment virological response

5

151

Risk Difference (M‐H, Fixed, 95% CI)

0.17 [0.07, 0.27]

2 Liver‐related and all‐cause morbidity and mortality Show forest plot

5

151

Risk Difference (M‐H, Fixed, 95% CI)

0.0 [‐0.06, 0.06]

3 Failure of biochemical response (number of patients with elevated alanine aminotransferase) Show forest plot

4

Risk Difference (M‐H, Fixed, 95% CI)

Subtotals only

3.1 Sustained biochemical response

2

48

Risk Difference (M‐H, Fixed, 95% CI)

0.17 [‐0.01, 0.35]

3.2 End of treatment biochemical response

4

135

Risk Difference (M‐H, Fixed, 95% CI)

0.17 [0.05, 0.29]

4 Adverse events Show forest plot

4

Risk Difference (M‐H, Fixed, 95% CI)

Subtotals only

4.1 Flu‐like syndrome (non‐specific)

1

30

Risk Difference (M‐H, Fixed, 95% CI)

‐0.2 [‐0.42, 0.02]

4.2 Weight loss

1

30

Risk Difference (M‐H, Fixed, 95% CI)

0.0 [‐0.18, 0.18]

4.3 Fatique/Weakness

2

54

Risk Difference (M‐H, Fixed, 95% CI)

0.11 [‐0.09, 0.31]

4.4 Irritability

2

93

Risk Difference (M‐H, Fixed, 95% CI)

‐0.00 [‐0.12, 0.11]

4.5 Abdominal pain

2

93

Risk Difference (M‐H, Fixed, 95% CI)

0.13 [0.03, 0.23]

4.6 Diarrhea

1

30

Risk Difference (M‐H, Fixed, 95% CI)

0.13 [‐0.06, 0.33]

4.7 Pruritus

2

93

Risk Difference (M‐H, Fixed, 95% CI)

0.06 [‐0.03, 0.15]

4.8 Herpes labialis

1

30

Risk Difference (M‐H, Fixed, 95% CI)

0.13 [‐0.11, 0.37]

4.9 Anaemia

2

93

Risk Difference (M‐H, Fixed, 95% CI)

0.09 [‐0.01, 0.18]

4.10 Headache

1

24

Risk Difference (M‐H, Fixed, 95% CI)

‐0.17 [‐0.51, 0.17]

4.11 Pharyngitis

1

24

Risk Difference (M‐H, Fixed, 95% CI)

0.08 [‐0.12, 0.29]

4.12 Viral infections

1

24

Risk Difference (M‐H, Fixed, 95% CI)

0.08 [‐0.12, 0.29]

4.13 Myalgia

1

24

Risk Difference (M‐H, Fixed, 95% CI)

‐0.08 [‐0.29, 0.12]

4.14 Dose reductions

3

72

Risk Difference (M‐H, Fixed, 95% CI)

0.08 [‐0.04, 0.21]

4.15 Treatment discontinuations

3

117

Risk Difference (M‐H, Fixed, 95% CI)

0.01 [‐0.09, 0.11]

Figuras y tablas -
Comparison 2. Ribavirin versus interferon