Ejercicio acuático para el tratamiento de la osteoartritis de rodilla y cadera
Información
- DOI:
- https://doi.org/10.1002/14651858.CD005523.pub3Copiar DOI

- Base de datos:
-
- Cochrane Database of Systematic Reviews
- Versión publicada:
-
- 23 marzo 2016see what's new
- Tipo:
-
- Intervention
- Etapa:
-
- Review
- Grupo Editorial Cochrane:
-
Grupo Cochrane de Salud musculoesquelética
- Copyright:
-
- Copyright © 2016 The Cochrane Collaboration. Published by John Wiley & Sons, Ltd.
Cifras del artículo
Altmetric:
Citado por:
Autores
Contributions of authors
Bartels EM, Juhl CB, Christensen R, Hagen KB, Danneskiold‐Samsøe B, Dagfinrud H, and Lund H contributed to the review content.
Bartels EM, Juhl CB, Christensen R, Hagen KB, Dagfinrud H, and Lund H assisted with the methodology.
Juhl CB, Christensen R, Hagen KB, and Lund H performed and interpreted the statistical analyses.
Sources of support
Internal sources
-
Oak Foundation, Denmark.
-
Copenhagen University Library, Denmark.
External sources
-
No sources of support supplied
Declarations of interest
Christensen R, Danneskiold‐Samsøe B, and Lund H were co‐authors of the Lund 2008 trial. Otherwise none known. EM Bartels has no known conflicts of interests. CB Juhl has no known conflicts of interests, R Christensen has no known conflicts of interests, H Dagfinrud has no known conflicts of interests, KB Hagen has no known conflicts of interests, B Danneskiold‐Samsøe has no known conflicts of interests, and H Lund has no known conflicts of interests.
Acknowledgements
We thank the staff at Interlibrary Loan Department, Copenhagen University Library North, for finding even the most obscure references.
The Oak Foundation supported this Cochrane review.
Version history
| Published | Title | Stage | Authors | Version |
| 2016 Mar 23 | Aquatic exercise for the treatment of knee and hip osteoarthritis | Review | Else Marie Bartels, Carsten B Juhl, Robin Christensen, Kåre Birger Hagen, Bente Danneskiold‐Samsøe, Hanne Dagfinrud, Hans Lund | |
| 2007 Oct 17 | Aquatic exercise for the treatment of knee and hip osteoarthritis | Review | Else Marie Bartels, Hans Lund, Kåre Birger Hagen, Hanne Dagfinrud, Robin Christensen, Bente Danneskiold‐Samsøe | |
| 2005 Oct 19 | Aquatic exercise for the treatment of knee and hip osteoarthritis | Protocol | Else Marie Bartels, Hans Lund, Kåre Birger Hagen, Hanne Dagfinrud, Robin Christensen, Bente Danneskiold‐Samsøe | |
Differences between protocol and review
We have made the following changes since the Cochrane protocol was published (Bartels 2005):
-
Authorship: we added CB Juhl to the list of review authors.
-
In order to secure the highest possible quality of included studies, we only included randomized controlled trials (RCTs) and no quasi‐RCTs.
-
In order to focus the systematic review, we restricted the research question to compare aquatic exercise vs no intervention, thus we only included trials with a control group of no specific intervention, i.e. usual care, education, social attention, telephone call, etc. That lead to an exclusion of two trials included in the first version of this Cochrane review (Bartels 2007): we excluded Wang 2004 because it is a PhD thesis and Wang 2006 is a scientific paper about the same trial. We excluded Wyatt 2001 because it was only a comparison between land‐based and aquatic exercise.
-
Based upon the recommendations from OMERACT (Bellamy 1997), we only included trials using pain, disability, or radiographics as outcomes.
-
In order to improve the literature search, we also checked the Cochrane's Central Register of Controlled Trials (CENTRAL) database.
-
Acknowledging the difficulties to reach all study authors, we chose not to contact any authors of the included trials to identify any additional published or unpublished data.
-
In accordance with the Cochrane recommendations, we based the 'Risk of bias' assessment on the 'Risk of bias' tool from the Cochrane Handbook of Systematic Reviews of Interventions (Higgins 2011).
-
We were unable to make a clear distinction between the major types of aquatic exercise, thus we did not perform any analyses of subcategories involving type of interventions.
-
Since the publication of the Cochrane protocol, Juhl 2012 has presented a hierarchy of outcomes. Thus, when an included trial reported more than one pain or disability outcome, we based our choice upon the outcome hierarchy suggested by Juhl 2012.
-
Since there are a large number of different outcomes covering pain and disability, we performed all meta‐analyses using random‐effect models and only presented standardized mean difference (SMD) values.
-
In accordance with Cochrane recommendations, we evaluated heterogeneity in all analyses (i.e. both Cochran's Q test and the I² statistic test) (Higgins 2011)
-
In accordance with Cochrane recommendations, we assessed the quality of the evidence according to the Grading of Recommendations Assessment, Development and Evaluation (GRADE) approach (Higgins 2011).
Keywords
MeSH
Medical Subject Headings (MeSH) Keywords
Medical Subject Headings Check Words
Aged; Female; Humans; Male;
PICO

Study flow diagram.
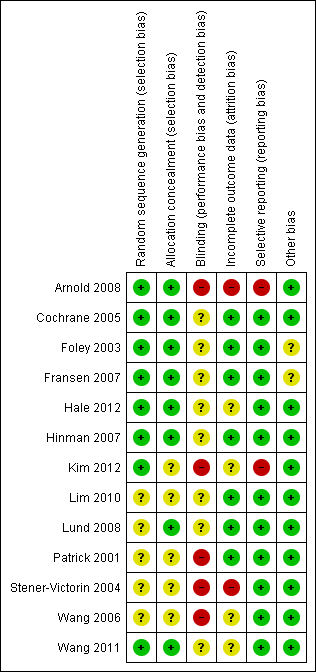
'Risk of bias' summary: review authors' judgements about each 'Risk of bias' item for each included trial.

'Risk of bias' graph: review authors' judgements about each 'Risk of bias' item presented as percentages across all included trials.

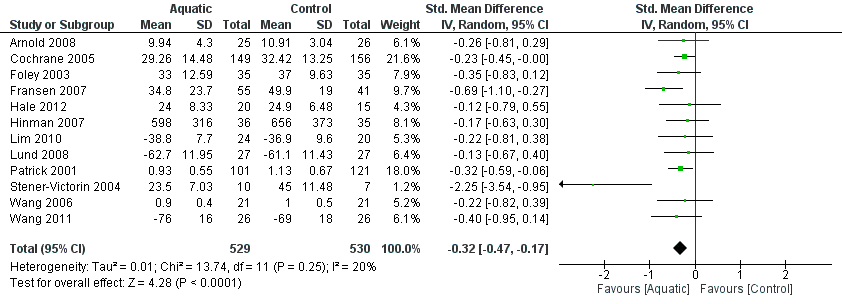
Forest plot of comparison: 1 Aquatic exercise vs control immediately after treatment ‐ knee & hip OA, outcome: 1.1 Pain.
Forest plot of comparison: 1 Aquatic exercise vs control immediately after treatment ‐ knee & hip OA, outcome: 1.2 Disability.
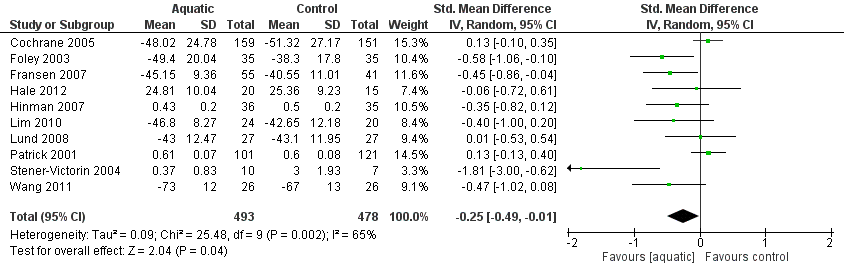
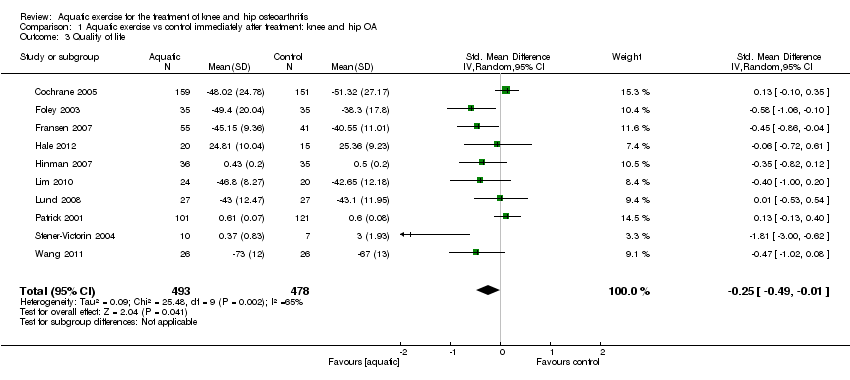
Forest plot of comparison: 1 Aquatic exercise vs control immediately after treatment: knee & hip OA, outcome: 1.3 QoL.

Comparison 1 Aquatic exercise vs control immediately after treatment: knee and hip OA, Outcome 1 Pain.

Comparison 1 Aquatic exercise vs control immediately after treatment: knee and hip OA, Outcome 2 Disability.
Comparison 1 Aquatic exercise vs control immediately after treatment: knee and hip OA, Outcome 3 Quality of life.

Comparison 2 Aquatic exercise vs control immediately after treatment: knee OA, Outcome 1 Pain.
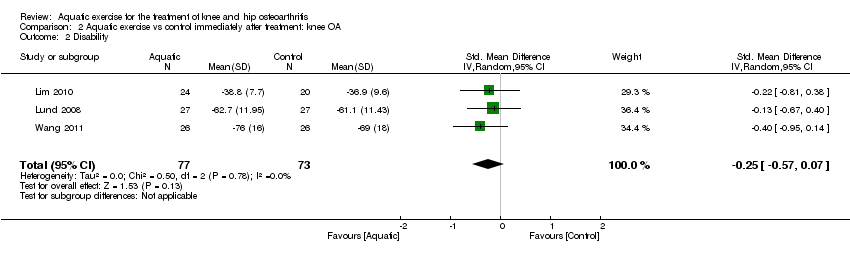
Comparison 2 Aquatic exercise vs control immediately after treatment: knee OA, Outcome 2 Disability.
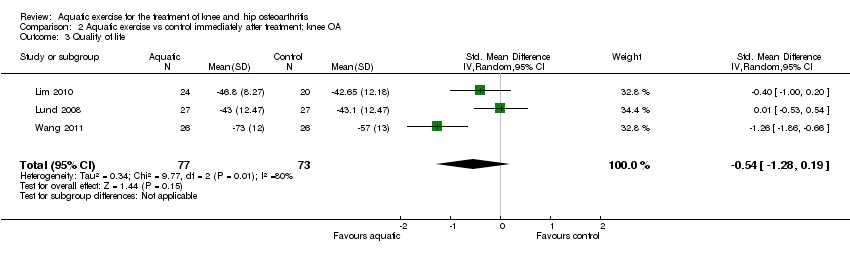
Comparison 2 Aquatic exercise vs control immediately after treatment: knee OA, Outcome 3 Quality of life.

Comparison 3 Aquatic exercise vs control immediately after treatment: hip OA, Outcome 1 Pain.
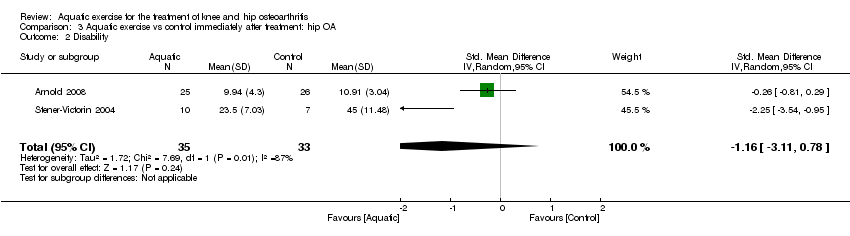
Comparison 3 Aquatic exercise vs control immediately after treatment: hip OA, Outcome 2 Disability.
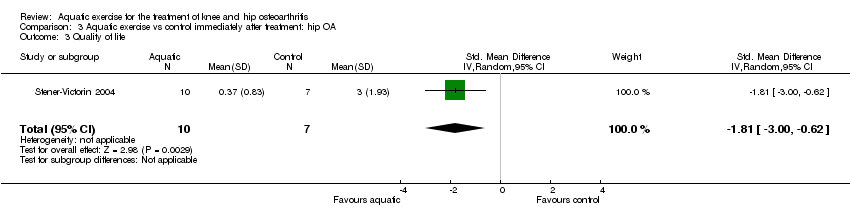
Comparison 3 Aquatic exercise vs control immediately after treatment: hip OA, Outcome 3 Quality of life.
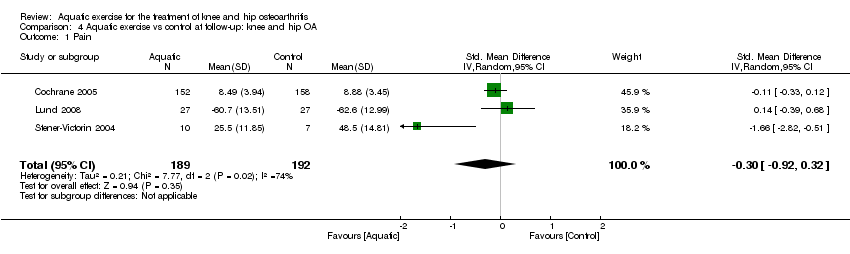
Comparison 4 Aquatic exercise vs control at follow‐up: knee and hip OA, Outcome 1 Pain.
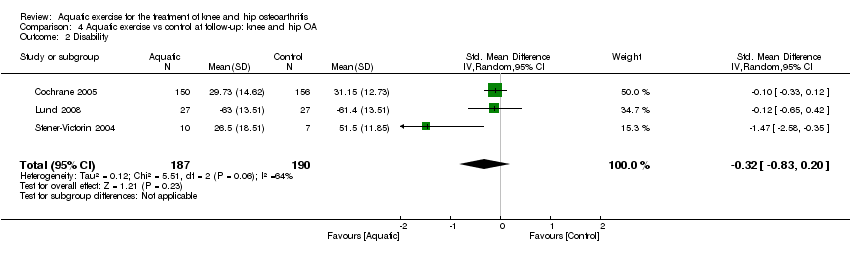
Comparison 4 Aquatic exercise vs control at follow‐up: knee and hip OA, Outcome 2 Disability.

Comparison 4 Aquatic exercise vs control at follow‐up: knee and hip OA, Outcome 3 Quality of life.

Comparison 5 Aquatic exercise vs control at follow‐up: knee OA, Outcome 1 Pain.

Comparison 5 Aquatic exercise vs control at follow‐up: knee OA, Outcome 2 Disability.

Comparison 5 Aquatic exercise vs control at follow‐up: knee OA, Outcome 3 Quality of life.

Comparison 6 Aquatic exercise vs control at follow‐up: hip OA, Outcome 1 Pain.
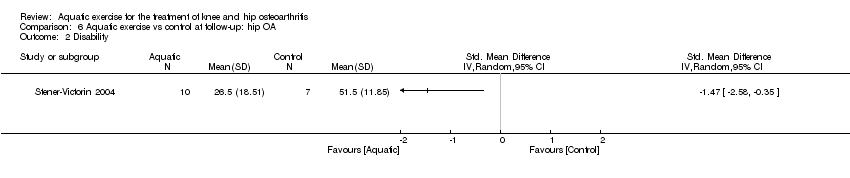
Comparison 6 Aquatic exercise vs control at follow‐up: hip OA, Outcome 2 Disability.
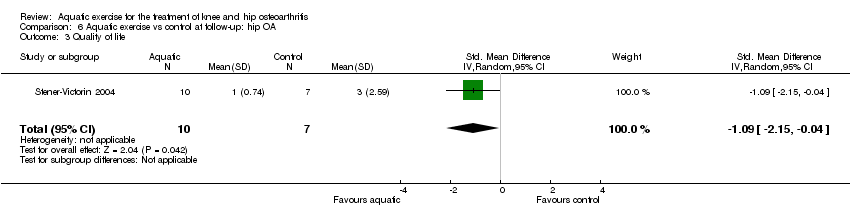
Comparison 6 Aquatic exercise vs control at follow‐up: hip OA, Outcome 3 Quality of life.

Comparison 7 Adverse events, Outcome 1 Adverse events.
| Aquatic exercise for treating people with knee and hip osteoarthritis | ||||||
| Participants: people with knee and hip osteoarthritis. Settings: outpatient. Comparison: control treatment (e.g. usual care, information). | ||||||
| Outcomes | Illustrative comparative risks (95% CI) | Effect size | Number of participants | Quality of the evidence | Comments | |
| Assumed effect | Corresponding effect | |||||
| Control treatment | Exercise therapy | |||||
| Pain on a 0 to 100 scale. (lower score is better) | Weighted mean pain in control groups was 46 points (95% CI 32 points up to 73) on a 0 to 100 scale | The mean pain in the aquatic exercise groups was 5 points lower (95% CI 3 to 8 points lower) compared with the control group.1 | SMD −0.31 (95% CI −0.47 to −0.15). | 1135 | ⊕⊕⊕⊝2 moderate | Absolute change: 5% (95% CI 3% to 8%) NNTB: 9 (95% CI 6 to 16).3 |
| Disability on a 0 to 100 scale. Various disability scales (lower score is better) | Weighted mean disability in control groups was 44 points (95% CI 33 points up to 63) on a 0 to 100 scale | The mean disability in the aquatic exercise groups was 5 points lower (95% CI 3 to 8 points lower) compared with control group.1 | SMD −0.32 (95% CI −0.47 to −0.17). | 1116 | ⊕⊕⊕⊝2 moderate | Absolute change: 5% (95% CI 3% to 8%) Relative change: 12.4% (95% CI 6.6% to 18.2%) NNTB: 11 (95% CI 8 to 19).3 |
| Quality of life on a 0 to 100 scale. Various quality of life scales. (higher score is better) | Weighted mean quality of life in control groups was 50 points (95% CI 24 points up to 67 points) on a 0 to 100 scale | The mean quality of life in the aquatic exercise groups was 7 points higher (95% CI 0 to 13 points higher) compared with the control group.4 | SMD −0.25 (95% CI −0.49 to −0.01). | 1027 (10 trials) | ⊕⊕⊕⊝2 moderate | Absolute change: 7% (0 to 13%) Relative change 13.2% (95% CI 0.5% to 25.9%). NNTB: 13 (95% CI 8 to 288).5 |
| Withdrawals | 15 per 100 | 18 per 100 (14 to 23) | RR 1.25 (95% CI 0.98 to 1.60) | 1190 | ⊕⊕⊕⊝2 moderate | Absolute change: 3% (95% CI ‐1% to 9%) Relative percent change 22% (95% CI 6% fewer withdrawals % to 57 more withdrawals%) NNTH: 31 (95%CI 14 to ∞)6 |
| Radiographic evaluation | see comments | see comments | see comments | see comments | see comments | The included trials did not perform any radiographic evaluation. |
| Short term serious adverse effects from trials | see comments | see comments | see comments | see comments | see comments | None reported. |
| Long term adverse effects or toxicity from observational studies | see comments | see comments | see comments | see comments | see comments | None reported. |
| 1Estimated from the SMD into percent improvement based on Bliddal 2009. 2Downgraded by one level due to high risk of bias. 3We estimated the NNTB (Number Needed to Treat for an additional beneficial outcome) from the OR. We transformed the SMD value to the OR using the equation of Chinn 2000. We set the patient expected event rate (PEER) to 0.4 for pain and to 0.26 for disability, based on Tubach 2005. 4The SD value from the largest trial (Cochrane 2005; SD in control group = 27.17) was multiplied with the SMD value of QoL (SMD −0.25, 95% CI −0.49 to −0.01). 5We estimated the NNTB from the OR. We transformed the SMD value to the OR using the equation of Chinn 2000. Since we assumed a strong relation between QoL and disability, we chose the PEER of 0.26 for disability based on Tubach 2005. 6 We estimated the NNTH (Number Needed to Treat for an additional harmful outcome) from the RR, where the assumed control risk is the number of withdrawals in the control group. | ||||||
| GRADE Working Group grades of evidence | ||||||
| Abbreviations: SMD: standardized mean difference; OR: odds ratio; CI: confidence interval; PEER: patient expected event rate; SD: standard deviation; QoL: quality of life. | ||||||
| Outcome or subgroup title | No. of studies | No. of participants | Statistical method | Effect size |
| 1 Pain Show forest plot | 12 | 1076 | Std. Mean Difference (IV, Random, 95% CI) | ‐0.31 [‐0.47, ‐0.15] |
| 2 Disability Show forest plot | 12 | 1059 | Std. Mean Difference (IV, Random, 95% CI) | ‐0.32 [‐0.47, ‐0.17] |
| 3 Quality of life Show forest plot | 10 | 971 | Std. Mean Difference (IV, Random, 95% CI) | ‐0.25 [‐0.49, ‐0.01] |
| Outcome or subgroup title | No. of studies | No. of participants | Statistical method | Effect size |
| 1 Pain Show forest plot | 3 | 150 | Std. Mean Difference (IV, Random, 95% CI) | ‐0.28 [‐0.69, 0.12] |
| 2 Disability Show forest plot | 3 | 150 | Std. Mean Difference (IV, Random, 95% CI) | ‐0.25 [‐0.57, 0.07] |
| 3 Quality of life Show forest plot | 3 | 150 | Std. Mean Difference (IV, Random, 95% CI) | ‐0.54 [‐1.28, 0.19] |
| Outcome or subgroup title | No. of studies | No. of participants | Statistical method | Effect size |
| 1 Pain Show forest plot | 1 | Std. Mean Difference (IV, Random, 95% CI) | Totals not selected | |
| 2 Disability Show forest plot | 2 | 68 | Std. Mean Difference (IV, Random, 95% CI) | ‐1.16 [‐3.11, 0.78] |
| 3 Quality of life Show forest plot | 1 | 17 | Std. Mean Difference (IV, Random, 95% CI) | ‐1.81 [‐1.00, ‐0.62] |
| Outcome or subgroup title | No. of studies | No. of participants | Statistical method | Effect size |
| 1 Pain Show forest plot | 3 | 381 | Std. Mean Difference (IV, Random, 95% CI) | ‐0.30 [‐0.92, 0.32] |
| 2 Disability Show forest plot | 3 | 377 | Std. Mean Difference (IV, Random, 95% CI) | ‐0.32 [‐0.83, 0.20] |
| 3 Quality of life Show forest plot | 3 | 381 | Std. Mean Difference (IV, Random, 95% CI) | ‐0.15 [‐0.64, 0.34] |
| Outcome or subgroup title | No. of studies | No. of participants | Statistical method | Effect size |
| 1 Pain Show forest plot | 1 | Std. Mean Difference (IV, Random, 95% CI) | Totals not selected | |
| 2 Disability Show forest plot | 1 | Std. Mean Difference (IV, Random, 95% CI) | Totals not selected | |
| 3 Quality of life Show forest plot | 1 | 54 | Std. Mean Difference (IV, Random, 95% CI) | ‐0.11 [‐0.65, 0.42] |
| Outcome or subgroup title | No. of studies | No. of participants | Statistical method | Effect size |
| 1 Pain Show forest plot | 1 | Std. Mean Difference (IV, Random, 95% CI) | Totals not selected | |
| 2 Disability Show forest plot | 1 | Std. Mean Difference (IV, Random, 95% CI) | Totals not selected | |
| 3 Quality of life Show forest plot | 1 | 17 | Std. Mean Difference (IV, Random, 95% CI) | ‐1.09 [‐2.15, ‐0.04] |
| Outcome or subgroup title | No. of studies | No. of participants | Statistical method | Effect size |
| 1 Adverse events Show forest plot | 13 | 1190 | Risk Ratio (M‐H, Fixed, 95% CI) | 1.25 [0.98, 1.60] |