Scolaris Content Display Scolaris Content Display

Study flow diagram.
Figuras y tablas -
Figure 1

Study flow diagram.

'Risk of bias' summary: review authors' judgements about each 'Risk of bias' item for each included trial.
Figuras y tablas -
Figure 2

'Risk of bias' summary: review authors' judgements about each 'Risk of bias' item for each included trial.

'Risk of bias' graph: review authors' judgements about each 'Risk of bias' item presented as percentages across all included trials.
Figuras y tablas -
Figure 3

'Risk of bias' graph: review authors' judgements about each 'Risk of bias' item presented as percentages across all included trials.

Forest plot of comparison: 1 Aquatic exercise vs control immediately after treatment ‐ knee & hip OA, outcome: 1.1 Pain.
Figuras y tablas -
Figure 4

Forest plot of comparison: 1 Aquatic exercise vs control immediately after treatment ‐ knee & hip OA, outcome: 1.1 Pain.

Forest plot of comparison: 1 Aquatic exercise vs control immediately after treatment ‐ knee & hip OA, outcome: 1.2 Disability.
Figuras y tablas -
Figure 5

Forest plot of comparison: 1 Aquatic exercise vs control immediately after treatment ‐ knee & hip OA, outcome: 1.2 Disability.

Forest plot of comparison: 1 Aquatic exercise vs control immediately after treatment: knee & hip OA, outcome: 1.3 QoL.
Figuras y tablas -
Figure 6

Forest plot of comparison: 1 Aquatic exercise vs control immediately after treatment: knee & hip OA, outcome: 1.3 QoL.

Comparison 1 Aquatic exercise vs control immediately after treatment: knee and hip OA, Outcome 1 Pain.
Figuras y tablas -
Analysis 1.1

Comparison 1 Aquatic exercise vs control immediately after treatment: knee and hip OA, Outcome 1 Pain.

Comparison 1 Aquatic exercise vs control immediately after treatment: knee and hip OA, Outcome 2 Disability.
Figuras y tablas -
Analysis 1.2

Comparison 1 Aquatic exercise vs control immediately after treatment: knee and hip OA, Outcome 2 Disability.

Comparison 1 Aquatic exercise vs control immediately after treatment: knee and hip OA, Outcome 3 Quality of life.
Figuras y tablas -
Analysis 1.3

Comparison 1 Aquatic exercise vs control immediately after treatment: knee and hip OA, Outcome 3 Quality of life.

Comparison 2 Aquatic exercise vs control immediately after treatment: knee OA, Outcome 1 Pain.
Figuras y tablas -
Analysis 2.1

Comparison 2 Aquatic exercise vs control immediately after treatment: knee OA, Outcome 1 Pain.

Comparison 2 Aquatic exercise vs control immediately after treatment: knee OA, Outcome 2 Disability.
Figuras y tablas -
Analysis 2.2

Comparison 2 Aquatic exercise vs control immediately after treatment: knee OA, Outcome 2 Disability.

Comparison 2 Aquatic exercise vs control immediately after treatment: knee OA, Outcome 3 Quality of life.
Figuras y tablas -
Analysis 2.3

Comparison 2 Aquatic exercise vs control immediately after treatment: knee OA, Outcome 3 Quality of life.

Comparison 3 Aquatic exercise vs control immediately after treatment: hip OA, Outcome 1 Pain.
Figuras y tablas -
Analysis 3.1

Comparison 3 Aquatic exercise vs control immediately after treatment: hip OA, Outcome 1 Pain.

Comparison 3 Aquatic exercise vs control immediately after treatment: hip OA, Outcome 2 Disability.
Figuras y tablas -
Analysis 3.2

Comparison 3 Aquatic exercise vs control immediately after treatment: hip OA, Outcome 2 Disability.

Comparison 3 Aquatic exercise vs control immediately after treatment: hip OA, Outcome 3 Quality of life.
Figuras y tablas -
Analysis 3.3

Comparison 3 Aquatic exercise vs control immediately after treatment: hip OA, Outcome 3 Quality of life.

Comparison 4 Aquatic exercise vs control at follow‐up: knee and hip OA, Outcome 1 Pain.
Figuras y tablas -
Analysis 4.1

Comparison 4 Aquatic exercise vs control at follow‐up: knee and hip OA, Outcome 1 Pain.

Comparison 4 Aquatic exercise vs control at follow‐up: knee and hip OA, Outcome 2 Disability.
Figuras y tablas -
Analysis 4.2

Comparison 4 Aquatic exercise vs control at follow‐up: knee and hip OA, Outcome 2 Disability.

Comparison 4 Aquatic exercise vs control at follow‐up: knee and hip OA, Outcome 3 Quality of life.
Figuras y tablas -
Analysis 4.3

Comparison 4 Aquatic exercise vs control at follow‐up: knee and hip OA, Outcome 3 Quality of life.

Comparison 5 Aquatic exercise vs control at follow‐up: knee OA, Outcome 1 Pain.
Figuras y tablas -
Analysis 5.1

Comparison 5 Aquatic exercise vs control at follow‐up: knee OA, Outcome 1 Pain.

Comparison 5 Aquatic exercise vs control at follow‐up: knee OA, Outcome 2 Disability.
Figuras y tablas -
Analysis 5.2

Comparison 5 Aquatic exercise vs control at follow‐up: knee OA, Outcome 2 Disability.

Comparison 5 Aquatic exercise vs control at follow‐up: knee OA, Outcome 3 Quality of life.
Figuras y tablas -
Analysis 5.3

Comparison 5 Aquatic exercise vs control at follow‐up: knee OA, Outcome 3 Quality of life.

Comparison 6 Aquatic exercise vs control at follow‐up: hip OA, Outcome 1 Pain.
Figuras y tablas -
Analysis 6.1

Comparison 6 Aquatic exercise vs control at follow‐up: hip OA, Outcome 1 Pain.

Comparison 6 Aquatic exercise vs control at follow‐up: hip OA, Outcome 2 Disability.
Figuras y tablas -
Analysis 6.2

Comparison 6 Aquatic exercise vs control at follow‐up: hip OA, Outcome 2 Disability.

Comparison 6 Aquatic exercise vs control at follow‐up: hip OA, Outcome 3 Quality of life.
Figuras y tablas -
Analysis 6.3

Comparison 6 Aquatic exercise vs control at follow‐up: hip OA, Outcome 3 Quality of life.

Comparison 7 Adverse events, Outcome 1 Adverse events.
Figuras y tablas -
Analysis 7.1

Comparison 7 Adverse events, Outcome 1 Adverse events.

Aquatic exercise for treating people with knee and hip osteoarthritis

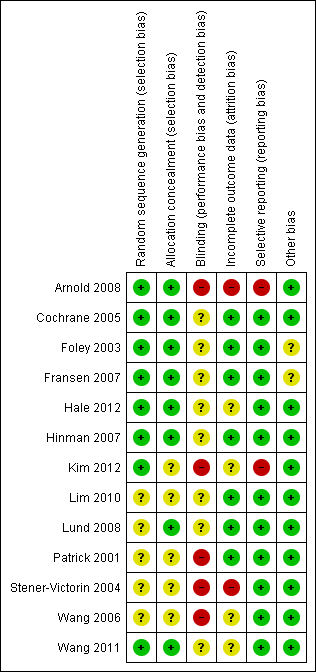
Participants: people with knee and hip osteoarthritis.

Settings: outpatient.
Intervention: aquatic exercise programme.

Comparison: control treatment (e.g. usual care, information).

Outcomes

Illustrative comparative risks (95% CI)

Effect size
(95% CI)

Number of participants
(trials)

Quality of the evidence
(GRADE)

Comments

Assumed effect

Corresponding effect

Control treatment

Exercise therapy

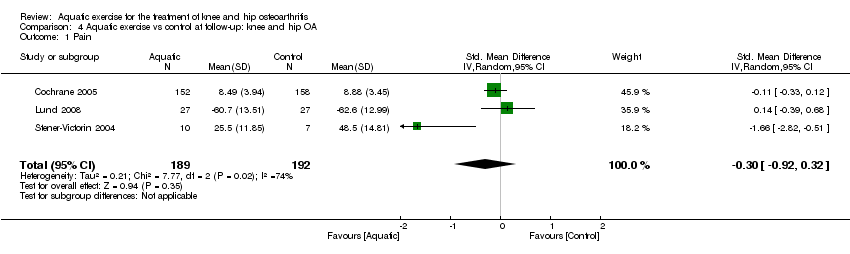
Pain

on a 0 to 100 scale.
Various pain scales.

(lower score is better)

Weighted mean pain in control groups was 46 points (95% CI 32 points up to 73) on a 0 to 100 scale

The mean pain in the aquatic exercise groups was 5 points lower (95% CI 3 to 8 points lower) compared with the control group.1

SMD −0.31

(95% CI −0.47 to −0.15).

1135
(12 trials)

⊕⊕⊕⊝2

moderate

Absolute change: 5% (95% CI 3% to 8%)
Relative change: 9.0.% (95% CI 4.3% to 13.6%).1

NNTB: 9 (95% CI 6 to 16).3

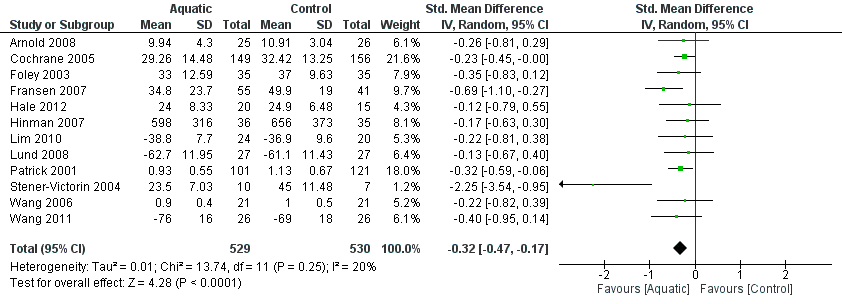
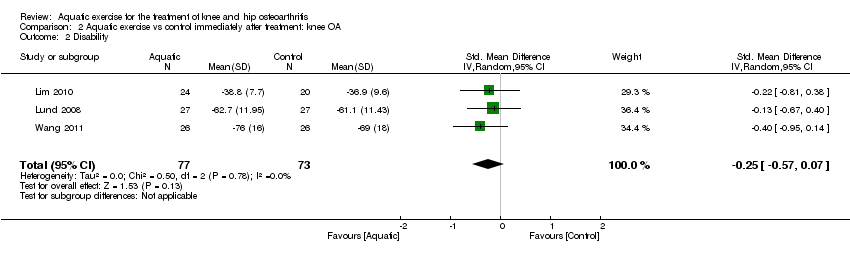
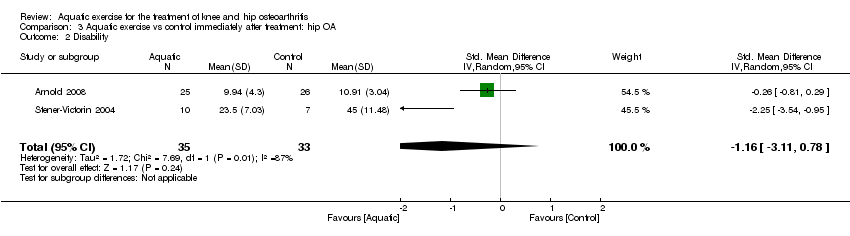
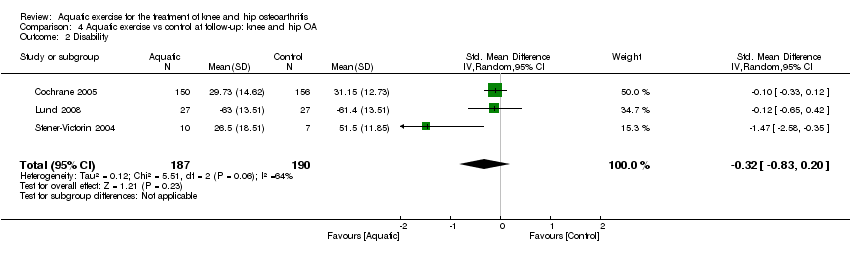
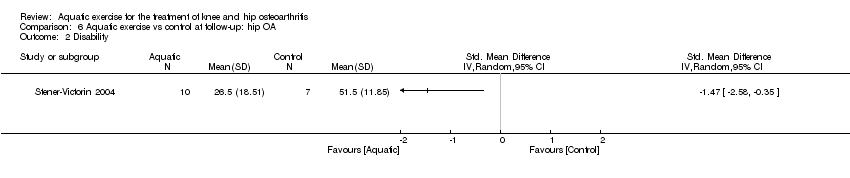
Disability

on a 0 to 100 scale.

Various disability scales

(lower score is better)

Weighted mean disability in control groups was 44 points (95% CI 33 points up to 63) on a 0 to 100 scale

The mean disability in the aquatic exercise groups was 5 points lower (95% CI 3 to 8 points lower) compared with control group.1

SMD −0.32

(95% CI −0.47 to −0.17).

1116
(12 trials)

⊕⊕⊕⊝2

moderate

Absolute change: 5% (95% CI 3% to 8%)

Relative change: 12.4% (95% CI 6.6% to 18.2%)

NNTB: 11 (95% CI 8 to 19).3

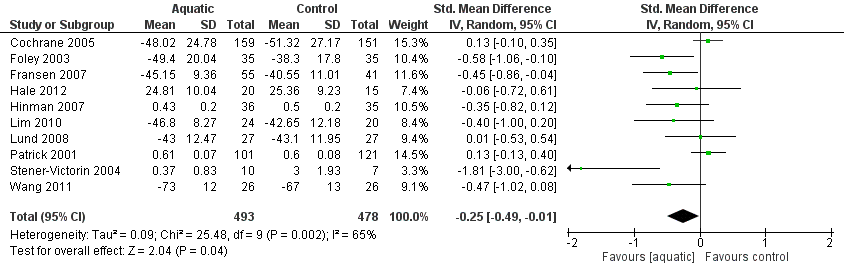
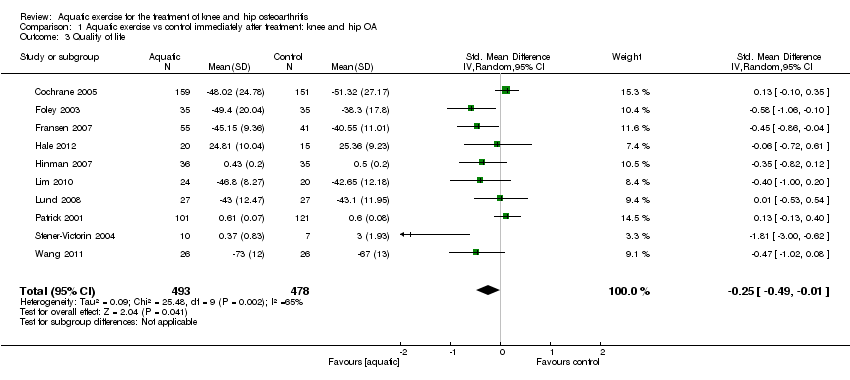
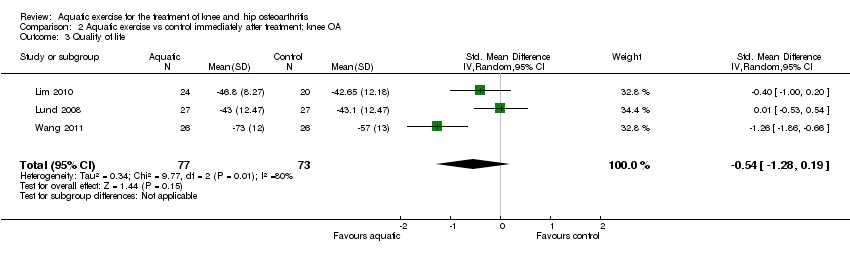
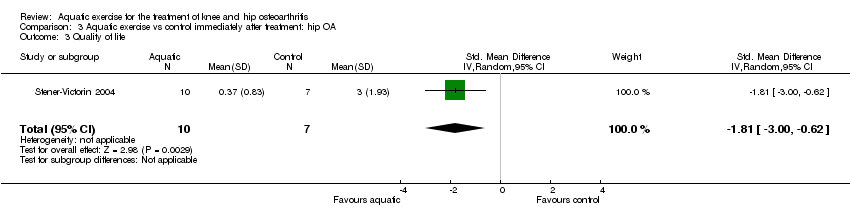
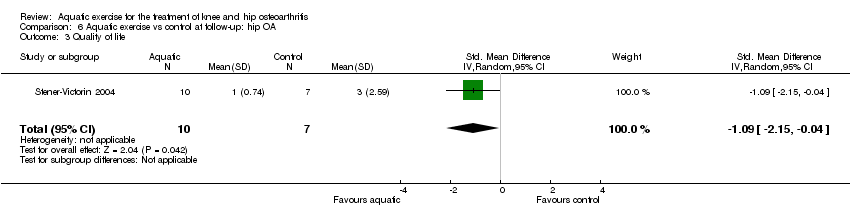
Quality of life

on a 0 to 100 scale.

Various quality of life scales.

(higher score is better)

Weighted mean quality of life in control groups was 50 points (95% CI 24 points up to 67 points) on a 0 to 100 scale

The mean quality of life in the aquatic exercise groups was 7 points higher (95% CI 0 to 13 points higher) compared with the control group.4

SMD −0.25

(95% CI −0.49 to −0.01).

1027

(10 trials)

⊕⊕⊕⊝2 moderate

Absolute change: 7% (0 to 13%)

Relative change 13.2% (95% CI 0.5% to 25.9%).

NNTB: 13 (95% CI 8 to 288).5

Withdrawals

15 per 100

18 per 100 (14 to 23)

RR 1.25 (95% CI 0.98 to 1.60)

1190
(13 trials)

⊕⊕⊕⊝2

moderate

Absolute change: 3% (95% CI ‐1% to 9%)

Relative percent change 22% (95% CI 6% fewer withdrawals % to 57 more withdrawals%)

NNTH: 31 (95%CI 14 to ∞)6

Radiographic evaluation

see comments

see comments

see comments

see comments

see comments

The included trials did not perform any radiographic evaluation.

Short term serious adverse effects from trials

see comments

see comments

see comments

see comments

see comments

None reported.

Long term adverse effects or toxicity from observational studies

see comments

see comments

see comments

see comments

see comments

None reported.

1Estimated from the SMD into percent improvement based on Bliddal 2009.

2Downgraded by one level due to high risk of bias.

3We estimated the NNTB (Number Needed to Treat for an additional beneficial outcome) from the OR. We transformed the SMD value to the OR using the equation of Chinn 2000. We set the patient expected event rate (PEER) to 0.4 for pain and to 0.26 for disability, based on Tubach 2005.

4The SD value from the largest trial (Cochrane 2005; SD in control group = 27.17) was multiplied with the SMD value of QoL (SMD −0.25, 95% CI −0.49 to −0.01).

5We estimated the NNTB from the OR. We transformed the SMD value to the OR using the equation of Chinn 2000. Since we assumed a strong relation between QoL and disability, we chose the PEER of 0.26 for disability based on Tubach 2005.

6 We estimated the NNTH (Number Needed to Treat for an additional harmful outcome) from the RR, where the assumed control risk is the number of withdrawals in the control group.

GRADE Working Group grades of evidence
High quality: further research is very unlikely to change our confidence in the estimate of effect.
Moderate quality: further research is likely to have an important impact on our confidence in the estimate of effect and may change the estimate.
Low quality: further research is very likely to have an important impact on our confidence in the estimate of effect and is likely to change the estimate.
Very low quality: we are very uncertain about the estimate.

Abbreviations: SMD: standardized mean difference; OR: odds ratio; CI: confidence interval; PEER: patient expected event rate; SD: standard deviation; QoL: quality of life.

Figuras y tablas -
Comparison 1. Aquatic exercise vs control immediately after treatment: knee and hip OA

Outcome or subgroup title

No. of studies

No. of participants

Statistical method

Effect size

1 Pain Show forest plot

12

1076

Std. Mean Difference (IV, Random, 95% CI)

‐0.31 [‐0.47, ‐0.15]

2 Disability Show forest plot

12

1059

Std. Mean Difference (IV, Random, 95% CI)

‐0.32 [‐0.47, ‐0.17]

3 Quality of life Show forest plot

10

971

Std. Mean Difference (IV, Random, 95% CI)

‐0.25 [‐0.49, ‐0.01]

Figuras y tablas -
Comparison 1. Aquatic exercise vs control immediately after treatment: knee and hip OA
Comparison 2. Aquatic exercise vs control immediately after treatment: knee OA

Outcome or subgroup title

No. of studies

No. of participants

Statistical method

Effect size

1 Pain Show forest plot

3

150

Std. Mean Difference (IV, Random, 95% CI)

‐0.28 [‐0.69, 0.12]

2 Disability Show forest plot

3

150

Std. Mean Difference (IV, Random, 95% CI)

‐0.25 [‐0.57, 0.07]

3 Quality of life Show forest plot

3

150

Std. Mean Difference (IV, Random, 95% CI)

‐0.54 [‐1.28, 0.19]

Figuras y tablas -
Comparison 2. Aquatic exercise vs control immediately after treatment: knee OA
Comparison 3. Aquatic exercise vs control immediately after treatment: hip OA

Outcome or subgroup title

No. of studies

No. of participants

Statistical method

Effect size

1 Pain Show forest plot

1

Std. Mean Difference (IV, Random, 95% CI)

Totals not selected

2 Disability Show forest plot

2

68

Std. Mean Difference (IV, Random, 95% CI)

‐1.16 [‐3.11, 0.78]

3 Quality of life Show forest plot

1

17

Std. Mean Difference (IV, Random, 95% CI)

‐1.81 [‐1.00, ‐0.62]

Figuras y tablas -
Comparison 3. Aquatic exercise vs control immediately after treatment: hip OA
Comparison 4. Aquatic exercise vs control at follow‐up: knee and hip OA

Outcome or subgroup title

No. of studies

No. of participants

Statistical method

Effect size

1 Pain Show forest plot

3

381

Std. Mean Difference (IV, Random, 95% CI)

‐0.30 [‐0.92, 0.32]

2 Disability Show forest plot

3

377

Std. Mean Difference (IV, Random, 95% CI)

‐0.32 [‐0.83, 0.20]

3 Quality of life Show forest plot

3

381

Std. Mean Difference (IV, Random, 95% CI)

‐0.15 [‐0.64, 0.34]

Figuras y tablas -
Comparison 4. Aquatic exercise vs control at follow‐up: knee and hip OA
Comparison 5. Aquatic exercise vs control at follow‐up: knee OA

Outcome or subgroup title

No. of studies

No. of participants

Statistical method

Effect size

1 Pain Show forest plot

1

Std. Mean Difference (IV, Random, 95% CI)

Totals not selected

2 Disability Show forest plot

1

Std. Mean Difference (IV, Random, 95% CI)

Totals not selected

3 Quality of life Show forest plot

1

54

Std. Mean Difference (IV, Random, 95% CI)

‐0.11 [‐0.65, 0.42]

Figuras y tablas -
Comparison 5. Aquatic exercise vs control at follow‐up: knee OA
Comparison 6. Aquatic exercise vs control at follow‐up: hip OA

Outcome or subgroup title

No. of studies

No. of participants

Statistical method

Effect size

1 Pain Show forest plot

1

Std. Mean Difference (IV, Random, 95% CI)

Totals not selected

2 Disability Show forest plot

1

Std. Mean Difference (IV, Random, 95% CI)

Totals not selected

3 Quality of life Show forest plot

1

17

Std. Mean Difference (IV, Random, 95% CI)

‐1.09 [‐2.15, ‐0.04]

Figuras y tablas -
Comparison 6. Aquatic exercise vs control at follow‐up: hip OA
Comparison 7. Adverse events

Outcome or subgroup title

No. of studies

No. of participants

Statistical method

Effect size

1 Adverse events Show forest plot

13

1190

Risk Ratio (M‐H, Fixed, 95% CI)

1.25 [0.98, 1.60]

Figuras y tablas -
Comparison 7. Adverse events