Contenido relacionado
Revisiones y protocolos relacionados
Else Marie Bartels, Carsten B Juhl, Robin Christensen, Kåre Birger Hagen, Bente Danneskiold‐Samsøe, Hanne Dagfinrud, Hans Lund | 23 marzo 2016
Tijs Duivenvoorden, Reinoud W Brouwer, Tom M van Raaij, Arianne P Verhagen, Jan AN Verhaar, Sita MA Bierma‐Zeinstra | 16 marzo 2015
Alexandra A Leaney, Jenna R Lyttle, Julian Segan, Donna M Urquhart, Flavia M Cicuttini, Louisa Chou, Anita E Wluka | 21 octubre 2022
Julia Bidonde, Angela J Busch, Sandra C Webber, Candice L Schachter, Adrienne Danyliw, Tom J Overend, Rachel S Richards, Tamara Rader | 28 octubre 2014
Michael Hurley, Kelly Dickson, Rachel Hallett, Robert Grant, Hanan Hauari, Nicola Walsh, Claire Stansfield, Sandy Oliver | 17 abril 2018
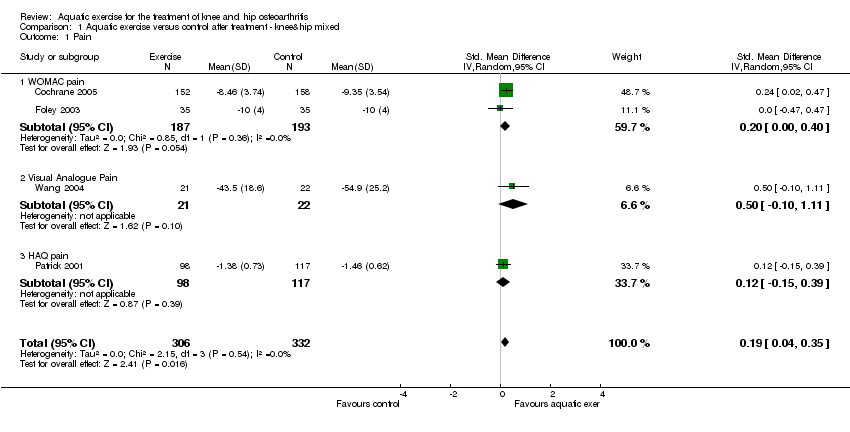
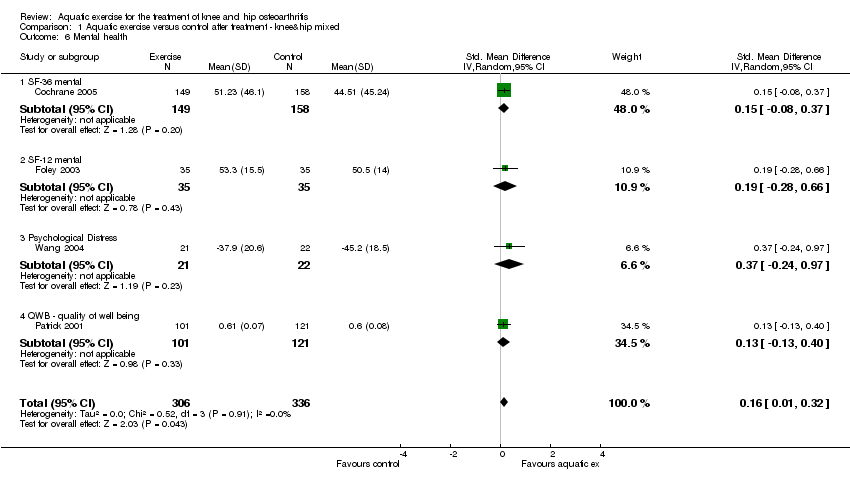
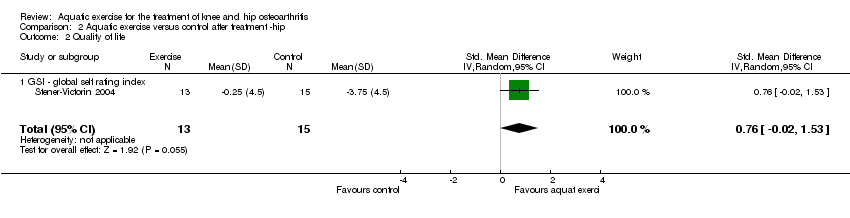
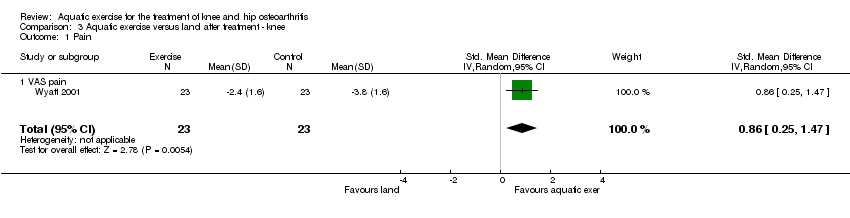
Arianne P Verhagen, Sita MA Bierma‐Zeinstra, Maarten Boers, Jefferson Rosa Cardoso, Johan Lambeck, Rob de Bie, Henrica CW de Vet | 17 octubre 2007
Eric Manheimera, Ke Chenga, L. Susan Wieland, Xueyong Shen, Lixing Lao, Menghu Guo, Brian M Berman | 5 mayo 2018
Marlene Fransen, Sara McConnell, Gabriela Hernandez‐Molina, Stephan Reichenbach | 22 abril 2014
Lucie Brosseau, L MacLeay, Vivian Welch, Peter Tugwell, George A Wells | 28 febrero 2013
Helen P French, J Haxby Abbott, Rose Galvin | 17 octubre 2022