Ejercicio acuático para el tratamiento de la osteoartritis de rodilla y cadera
Referencias
Referencias de los estudios incluidos en esta revisión
Referencias de los estudios excluidos de esta revisión
Referencias adicionales
Characteristics of studies
Characteristics of included studies [ordered by study ID]
Ir a:
| Methods | Intention to treat | |
| Participants | 312 volunteers randomised into Aquatic: 153, Control: 159 | |
| Interventions | Aquatic exercise: stretching, strengthening and aerobic exercises, primarily low to moderate intensity. | |
| Outcomes | Pain (WOMAC), stiffness (WOMAC) and function (WOMAC). | |
| Notes | GOLD | |
| Risk of bias | ||
| Bias | Authors' judgement | Support for judgement |
| Allocation concealment? | Low risk | A ‐ Adequate |
| Methods | Intention to treat | |
| Participants | 105 volunteers randomised into | |
| Interventions | Aquatic exercise: | |
| Outcomes | Pain (WOMAC), stiffness (WOMAC), function (WOMAC), Quality of life (SF‐12) | |
| Notes | GOLD | |
| Risk of bias | ||
| Bias | Authors' judgement | Support for judgement |
| Allocation concealment? | Low risk | A ‐ Adequate |
| Methods | Intention to treat | |
| Participants | 249 volunteers randomised into | |
| Interventions | Aquatic: | |
| Outcomes | Pain (HAQ), function (HAQ), quality of life (QOL), quality of well being (QWB) | |
| Notes | GOLD | |
| Risk of bias | ||
| Bias | Authors' judgement | Support for judgement |
| Allocation concealment? | Unclear risk | B ‐ Unclear |
| Methods | Intention to treat | |
| Participants | 45 volunteers randomised into | |
| Interventions | Patient education + electro‐acupuncture | |
| Outcomes | Disability rating index (DRI) | |
| Notes | SILVER | |
| Risk of bias | ||
| Bias | Authors' judgement | Support for judgement |
| Allocation concealment? | Unclear risk | B ‐ Unclear |
| Methods | Intention to Treat | |
| Participants | 43 volunteers randomised into aquatic exercise: 21 | |
| Interventions | Aquatic exercise with focus on strengthening exercise | |
| Outcomes | Pain in joint | |
| Notes | GOLD | |
| Risk of bias | ||
| Bias | Authors' judgement | Support for judgement |
| Allocation concealment? | Low risk | A ‐ Adequate |
| Methods | No intention to treat analysis | |
| Participants | 46 volunteers randomised into a land‐based and aquatic exercise program. Number of participants in each group not reported | |
| Interventions | Aquatic and | |
| Outcomes | VAS pain | |
| Notes | SILVER | |
| Risk of bias | ||
| Bias | Authors' judgement | Support for judgement |
| Allocation concealment? | Unclear risk | D ‐ Not used |
See grading system in text for definition of Gold and Silver.
ACR criteria for the hip joint: age greater than 40 years, weight‐bearing pain, pain relieved by sitting, antalgic gait, decreased painful range of motion, a normal erythrocyte sedimentation rate (ESR) and a negative rheumatoid factor test.
ACR criteria for the knee joint: age greater than 50 years, knee pain, stiffness < 30 min, crepitus, bony tenderness, bony enlargement, no palpable warmth, a normal erythrocyte sedimentation rate (ESR) and a negative rheumatoid factor test.
EUROQOL: The EuroQol is a multidimensional health profile developed by the EuroQol Group in 1990 and revised in 1993.
HAQ: Health Assessment Questionnaire.
PQOL: The Perceived Quality of Life Scale is a generic instrument for assessing perceived quality of life among adults.
VAS: Visual analogue scale
WOMAC: Western Ontario and McMaster Universities Osteoarthritis Index
Characteristics of excluded studies [ordered by study ID]
Ir a:
| Study | Reason for exclusion |
| Poor randomization procedure. No follow up. But the immediate effect is described for pain, stiffness, depression, self‐efficacy. | |
| Not randomized. Mix of different patient categories (OA, 27; RA 3; FMS 1; Psoriasis 1). | |
| OA in different joints not hip and/or knee alone. | |
| No aquatic exercise, not possible to assess the effect of water treatment alone, | |
| Abstract only | |
| Aquatic exercise is combined with land exercise. Mix of both OA and RA. | |
| No exercise, only water immersion. | |
| Only data on surrogate outcomes | |
| No exercise (only SPA therapy). No randomization. | |
| Not possible to evaluate the effect on KNEE OA (Mix of OA, RA and FMS). No randomization. | |
| No exercise, only water immersion. | |
| Only comparing two different types of aquatic exercises | |
| No exercise, only immersion. | |
| Not randomised | |
| When it is possible to distinguish between OA and RA, it is not possible to distinguish between aquatic and non‐aquatic exercise / control. | |
| Mix of hip, knee and lumbar OA. No exercise, a mixed modality of spa and balneotherapy. | |
| Only effect sizes reported, and no SD was given, thus it was impossible to include the results in the meta‐analysis | |
| No exercise | |
| Mix of RA and OA. | |
| Mix of RA and OA. | |
| Mix of RA and OA. | |
| No exercise, only water immersion. |
OA: Osteoarthritis
RA: Rheumatoid arthritis
FMS: Fibromyalgia syndrome
SPA therapy: treatment including water, but not including exercise
SD: Standard deviation
Data and analyses
| Outcome or subgroup title | No. of studies | No. of participants | Statistical method | Effect size |
| 1 Pain Show forest plot | 4 | 638 | Std. Mean Difference (IV, Random, 95% CI) | 0.19 [0.04, 0.35] |
| Analysis 1.1  Comparison 1 Aquatic exercise versus control after treatment ‐ knee&hip mixed, Outcome 1 Pain. | ||||
| 1.1 WOMAC pain | 2 | 380 | Std. Mean Difference (IV, Random, 95% CI) | 0.20 [‐0.00, 0.40] |
| 1.2 Visual Analogue Pain | 1 | 43 | Std. Mean Difference (IV, Random, 95% CI) | 0.50 [‐0.10, 1.11] |
| 1.3 HAQ pain | 1 | 215 | Std. Mean Difference (IV, Random, 95% CI) | 0.12 [‐0.15, 0.39] |
| 2 Function Show forest plot | 4 | 648 | Std. Mean Difference (IV, Random, 95% CI) | 0.26 [0.11, 0.42] |
| Analysis 1.2  Comparison 1 Aquatic exercise versus control after treatment ‐ knee&hip mixed, Outcome 2 Function. | ||||
| 2.1 WOMAC function | 2 | 375 | Std. Mean Difference (IV, Random, 95% CI) | 0.23 [0.03, 0.44] |
| 2.2 HAQ function | 2 | 273 | Std. Mean Difference (IV, Random, 95% CI) | 0.31 [0.07, 0.55] |
| 3 Walking ability Show forest plot | 2 | 355 | Std. Mean Difference (IV, Random, 95% CI) | 0.18 [‐0.03, 0.39] |
| Analysis 1.3  Comparison 1 Aquatic exercise versus control after treatment ‐ knee&hip mixed, Outcome 3 Walking ability. | ||||
| 3.1 Six‐minute walk | 1 | 43 | Std. Mean Difference (IV, Random, 95% CI) | ‐0.03 [‐0.63, 0.57] |
| 3.2 8‐foot walk time | 1 | 312 | Std. Mean Difference (IV, Random, 95% CI) | 0.21 [‐0.01, 0.43] |
| 4 Stiffness Show forest plot | 2 | 380 | Std. Mean Difference (IV, Random, 95% CI) | 0.14 [‐0.06, 0.34] |
| Analysis 1.4  Comparison 1 Aquatic exercise versus control after treatment ‐ knee&hip mixed, Outcome 4 Stiffness. | ||||
| 4.1 WOMAC stiffness | 2 | 380 | Std. Mean Difference (IV, Random, 95% CI) | 0.14 [‐0.06, 0.34] |
| 5 Quality of life Show forest plot | 3 | 599 | Std. Mean Difference (IV, Random, 95% CI) | 0.32 [0.03, 0.61] |
| Analysis 1.5  Comparison 1 Aquatic exercise versus control after treatment ‐ knee&hip mixed, Outcome 5 Quality of life. | ||||
| 5.1 SF‐12 physical | 1 | 70 | Std. Mean Difference (IV, Random, 95% CI) | 0.69 [0.21, 1.17] |
| 5.2 PQOL ‐ perceived quality of life | 1 | 222 | Std. Mean Difference (IV, Random, 95% CI) | 0.35 [0.09, 0.62] |
| 5.3 EURO‐QOL | 1 | 307 | Std. Mean Difference (IV, Random, 95% CI) | 0.10 [‐0.12, 0.33] |
| 6 Mental health Show forest plot | 4 | 642 | Std. Mean Difference (IV, Random, 95% CI) | 0.16 [0.01, 0.32] |
| Analysis 1.6  Comparison 1 Aquatic exercise versus control after treatment ‐ knee&hip mixed, Outcome 6 Mental health. | ||||
| 6.1 SF‐36 mental | 1 | 307 | Std. Mean Difference (IV, Random, 95% CI) | 0.15 [‐0.08, 0.37] |
| 6.2 SF‐12 mental | 1 | 70 | Std. Mean Difference (IV, Random, 95% CI) | 0.19 [‐0.28, 0.66] |
| 6.3 Psychological Distress | 1 | 43 | Std. Mean Difference (IV, Random, 95% CI) | 0.37 [‐0.24, 0.97] |
| 6.4 QWB ‐ quality of well being | 1 | 222 | Std. Mean Difference (IV, Random, 95% CI) | 0.13 [‐0.13, 0.40] |
| Outcome or subgroup title | No. of studies | No. of participants | Statistical method | Effect size |
| 1 Function Show forest plot | 1 | 28 | Std. Mean Difference (IV, Random, 95% CI) | 0.76 [‐0.02, 1.53] |
| Analysis 2.1  Comparison 2 Aquatic exercise versus control after treatment ‐hip, Outcome 1 Function. | ||||
| 1.1 DRI‐disability rating index | 1 | 28 | Std. Mean Difference (IV, Random, 95% CI) | 0.76 [‐0.02, 1.53] |
| 2 Quality of life Show forest plot | 1 | 28 | Std. Mean Difference (IV, Random, 95% CI) | 0.76 [‐0.02, 1.53] |
| Analysis 2.2  Comparison 2 Aquatic exercise versus control after treatment ‐hip, Outcome 2 Quality of life. | ||||
| 2.1 GSI ‐ global self rating index | 1 | 28 | Std. Mean Difference (IV, Random, 95% CI) | 0.76 [‐0.02, 1.53] |
| Outcome or subgroup title | No. of studies | No. of participants | Statistical method | Effect size |
| 1 Pain Show forest plot | 1 | 46 | Std. Mean Difference (IV, Random, 95% CI) | 0.86 [0.25, 1.47] |
| Analysis 3.1  Comparison 3 Aquatic exercise versus land after treatment ‐ knee, Outcome 1 Pain. | ||||
| 1.1 VAS pain | 1 | 46 | Std. Mean Difference (IV, Random, 95% CI) | 0.86 [0.25, 1.47] |
| 2 Walking ability Show forest plot | 1 | 46 | Std. Mean Difference (IV, Random, 95% CI) | 0.43 [‐0.16, 1.01] |
| Analysis 3.2  Comparison 3 Aquatic exercise versus land after treatment ‐ knee, Outcome 2 Walking ability. | ||||
| 2.1 1 MILE walk time | 1 | 46 | Std. Mean Difference (IV, Random, 95% CI) | 0.43 [‐0.16, 1.01] |
| 3 Stiffness Show forest plot | 1 | 46 | Std. Mean Difference (IV, Random, 95% CI) | ‐0.26 [‐0.84, 0.32] |
| Analysis 3.3  Comparison 3 Aquatic exercise versus land after treatment ‐ knee, Outcome 3 Stiffness. | ||||
| Outcome or subgroup title | No. of studies | No. of participants | Statistical method | Effect size |
| 1 Pain Show forest plot | 1 | 310 | Std. Mean Difference (IV, Random, 95% CI) | 0.11 [‐0.12, 0.33] |
| Analysis 4.1  Comparison 4 Aquatic exercise versus control at follow up ‐ knee&hip mixed, Outcome 1 Pain. | ||||
| 1.1 WOMAC pain | 1 | 310 | Std. Mean Difference (IV, Random, 95% CI) | 0.11 [‐0.12, 0.33] |
| 2 Function Show forest plot | 1 | 306 | Std. Mean Difference (IV, Random, 95% CI) | 0.10 [‐0.12, 0.33] |
| Analysis 4.2  Comparison 4 Aquatic exercise versus control at follow up ‐ knee&hip mixed, Outcome 2 Function. | ||||
| 2.1 WOMAC function | 1 | 306 | Std. Mean Difference (IV, Random, 95% CI) | 0.10 [‐0.12, 0.33] |
| 3 Stiffness Show forest plot | 1 | 310 | Std. Mean Difference (IV, Random, 95% CI) | 0.13 [‐0.09, 0.36] |
| Analysis 4.3  Comparison 4 Aquatic exercise versus control at follow up ‐ knee&hip mixed, Outcome 3 Stiffness. | ||||
| 3.1 WOMAC stiffness | 1 | 310 | Std. Mean Difference (IV, Random, 95% CI) | 0.13 [‐0.09, 0.36] |
| 4 Mental health Show forest plot | 1 | 309 | Std. Mean Difference (IV, Random, 95% CI) | 0.05 [‐0.17, 0.27] |
| Analysis 4.4  Comparison 4 Aquatic exercise versus control at follow up ‐ knee&hip mixed, Outcome 4 Mental health. | ||||
| 4.1 SF‐36 mental | 1 | 309 | Std. Mean Difference (IV, Random, 95% CI) | 0.05 [‐0.17, 0.27] |
| Outcome or subgroup title | No. of studies | No. of participants | Statistical method | Effect size |
| 1 Pain Show forest plot | 1 | 17 | Std. Mean Difference (IV, Random, 95% CI) | 1.00 [‐0.04, 2.04] |
| Analysis 5.1  Comparison 5 Aquatic exercise versus control at follow up ‐ hip, Outcome 1 Pain. | ||||
| 1.1 VAS pain | 1 | 17 | Std. Mean Difference (IV, Random, 95% CI) | 1.00 [‐0.04, 2.04] |
| 2 Function Show forest plot | 1 | 17 | Std. Mean Difference (IV, Random, 95% CI) | 1.00 [‐0.04, 2.04] |
| Analysis 5.2  Comparison 5 Aquatic exercise versus control at follow up ‐ hip, Outcome 2 Function. | ||||
| 2.1 DRI‐disability rating index | 1 | 17 | Std. Mean Difference (IV, Random, 95% CI) | 1.00 [‐0.04, 2.04] |
| 3 Quality of life Show forest plot | 1 | 17 | Std. Mean Difference (IV, Random, 95% CI) | 1.00 [‐0.04, 2.04] |
| Analysis 5.3  Comparison 5 Aquatic exercise versus control at follow up ‐ hip, Outcome 3 Quality of life. | ||||
| 3.1 GSI ‐ global self rating index | 1 | 17 | Std. Mean Difference (IV, Random, 95% CI) | 1.00 [‐0.04, 2.04] |
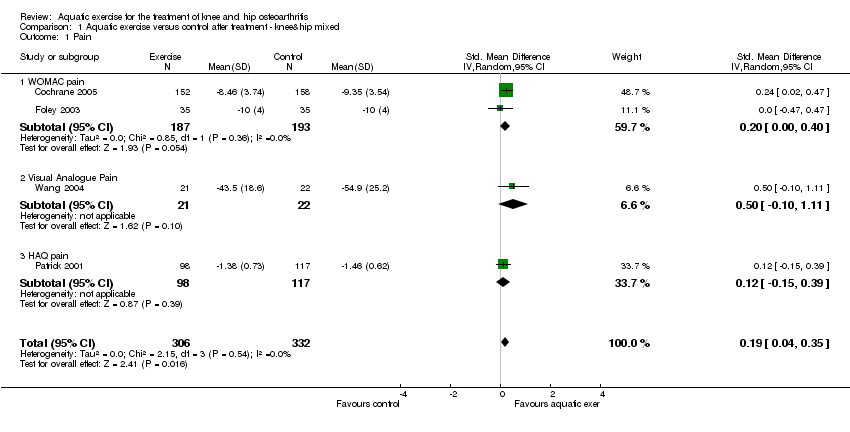
Comparison 1 Aquatic exercise versus control after treatment ‐ knee&hip mixed, Outcome 1 Pain.

Comparison 1 Aquatic exercise versus control after treatment ‐ knee&hip mixed, Outcome 2 Function.

Comparison 1 Aquatic exercise versus control after treatment ‐ knee&hip mixed, Outcome 3 Walking ability.

Comparison 1 Aquatic exercise versus control after treatment ‐ knee&hip mixed, Outcome 4 Stiffness.

Comparison 1 Aquatic exercise versus control after treatment ‐ knee&hip mixed, Outcome 5 Quality of life.
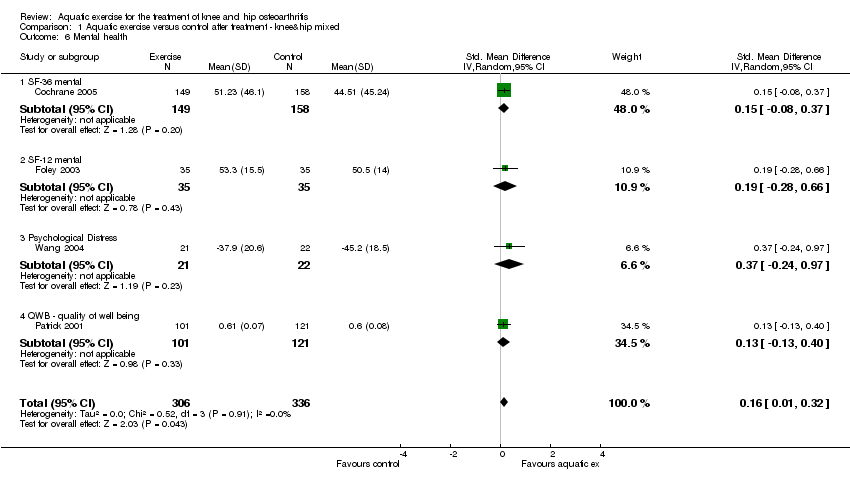
Comparison 1 Aquatic exercise versus control after treatment ‐ knee&hip mixed, Outcome 6 Mental health.

Comparison 2 Aquatic exercise versus control after treatment ‐hip, Outcome 1 Function.
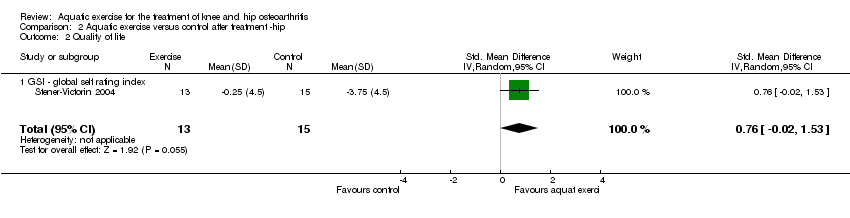
Comparison 2 Aquatic exercise versus control after treatment ‐hip, Outcome 2 Quality of life.
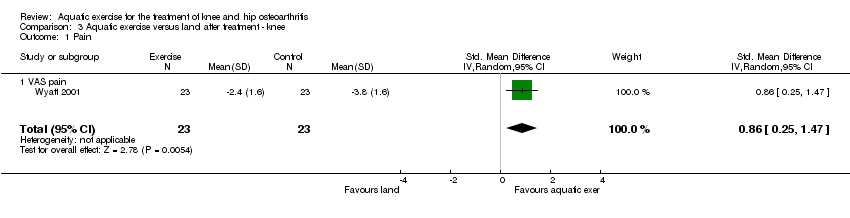
Comparison 3 Aquatic exercise versus land after treatment ‐ knee, Outcome 1 Pain.
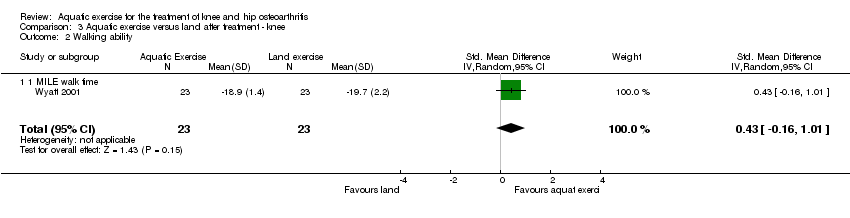
Comparison 3 Aquatic exercise versus land after treatment ‐ knee, Outcome 2 Walking ability.

Comparison 3 Aquatic exercise versus land after treatment ‐ knee, Outcome 3 Stiffness.

Comparison 4 Aquatic exercise versus control at follow up ‐ knee&hip mixed, Outcome 1 Pain.

Comparison 4 Aquatic exercise versus control at follow up ‐ knee&hip mixed, Outcome 2 Function.
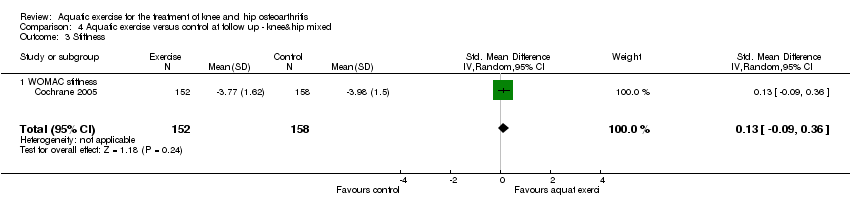
Comparison 4 Aquatic exercise versus control at follow up ‐ knee&hip mixed, Outcome 3 Stiffness.
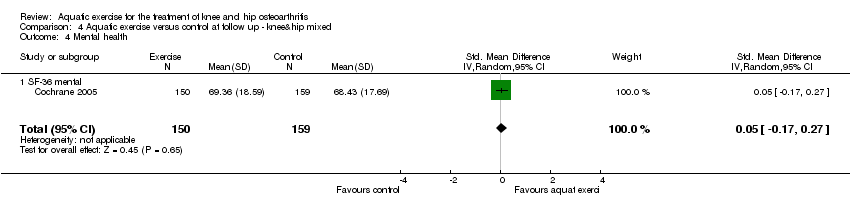
Comparison 4 Aquatic exercise versus control at follow up ‐ knee&hip mixed, Outcome 4 Mental health.
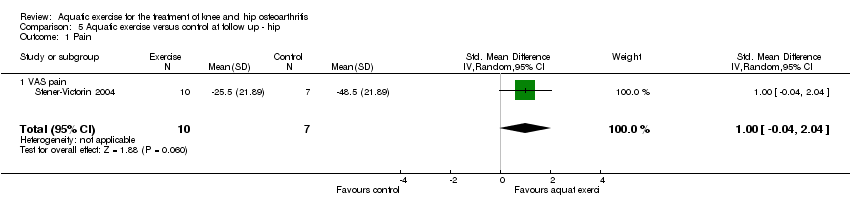
Comparison 5 Aquatic exercise versus control at follow up ‐ hip, Outcome 1 Pain.

Comparison 5 Aquatic exercise versus control at follow up ‐ hip, Outcome 2 Function.

Comparison 5 Aquatic exercise versus control at follow up ‐ hip, Outcome 3 Quality of life.
| Study | Outcome (scale) | # patients (# trials | Ctl baseline mean,SD | Wt absolute change | Relative % change | Statistical Sig. | Quality of evidence |
| Cochrane (2005) ; Foley (2003) | WOMAC (Western Ontario McMaster Osteoarthritis Index) (pain) (0‐20) | 380 (2) | 9.10 (3.14) | 3.0% (0.6 fewer points on a scale 0 to 20 scale) | 6.6% (I) | statistically significant but not clinically significant | GOLD |
| Wang (2004) | VAS (Visual Analogue Scale) pain (0‐100) | 43 (1) | 55.3 (24.6) | 12% (12.3 fewer points on a 0‐100 scale) | 0.2% (I) | not significant | GOLD |
| Patrick (2001) | HAQ (Health Assessment Questionnaire) pain (0‐3) | 249 (1) | 1.05 (0.61) | 2% (0.07 fewer points on a 0‐3 scale) | 7% (I) | not significant | GOLD |
| Cochrane (2005); Foley (2003) | WOMAC function (0‐68) | 380 (2) | 31.05 (11.24) | 4.3% (2.9 points on scale of 0 to 68) | 9.4% (1) | statistically significant but not clinically significant | GOLD |
| Patrick (2001); Wang (2004) | HAQ function (0‐3) | 292 (2) | 0.95 (0.5) | 5.2% (0.16 fewer points on a 0‐3 scale) | 16.3% (I) | statistically significant | GOLD |
| Cochrane (2005) | WOMAC pain (0‐20) | 310 (1) | 9.10 (3.14) | 0.3% (0.35 points fewer on a 0‐20 scale) | 4% (I) | not significant | GOLD |
| Cochrane (2005) | WOMAC function (0‐68) | 310 (1) | 31.05 (11.24) | 0.1% (0.11 fewer points on a 0‐68 scale) | 0.4% (I) | not significant | GOLD |
| Legend: ctl=control group; SD=standard deviation; wt=weighted; I=improvement; sig=significance; |
| Study | Outcome (scale) | #patients #(trials) | Ctl baseline mean,SD | Absolute change | Relative % change | Statistical sig. | Quality of evidence |
| Stener‐Victorin (2004) | VAS (Visual Analog Scale) pain (0‐100) | 28 (1) | 56.0 (21.89) | 22% (21.9 fewer points on a 0‐100 scale) | 40% (I) | not statistically significant | SILVER |
| Legend: ctl=control group, SD=standard deviation, sig=significance, I=improvement |
| Study | Outcome (scale) | #patients (# trials) | Ctl baseline mean,SD | Absolute change | Relative % change | Statisitical sig. | Quality of evidence |
| Wyatt (2001) | VAS (Visual Analog Scale) pain (0‐10) | 46 (1) | 5.6 (1.4) | 12% (1.2 fewer points on a 0‐10 scale) | 22% (I) | statistically significant | SILVER |
| Legend: ctl=control group; sig=significance; I=improvement |
| Outcome or subgroup title | No. of studies | No. of participants | Statistical method | Effect size |
| 1 Pain Show forest plot | 4 | 638 | Std. Mean Difference (IV, Random, 95% CI) | 0.19 [0.04, 0.35] |
| 1.1 WOMAC pain | 2 | 380 | Std. Mean Difference (IV, Random, 95% CI) | 0.20 [‐0.00, 0.40] |
| 1.2 Visual Analogue Pain | 1 | 43 | Std. Mean Difference (IV, Random, 95% CI) | 0.50 [‐0.10, 1.11] |
| 1.3 HAQ pain | 1 | 215 | Std. Mean Difference (IV, Random, 95% CI) | 0.12 [‐0.15, 0.39] |
| 2 Function Show forest plot | 4 | 648 | Std. Mean Difference (IV, Random, 95% CI) | 0.26 [0.11, 0.42] |
| 2.1 WOMAC function | 2 | 375 | Std. Mean Difference (IV, Random, 95% CI) | 0.23 [0.03, 0.44] |
| 2.2 HAQ function | 2 | 273 | Std. Mean Difference (IV, Random, 95% CI) | 0.31 [0.07, 0.55] |
| 3 Walking ability Show forest plot | 2 | 355 | Std. Mean Difference (IV, Random, 95% CI) | 0.18 [‐0.03, 0.39] |
| 3.1 Six‐minute walk | 1 | 43 | Std. Mean Difference (IV, Random, 95% CI) | ‐0.03 [‐0.63, 0.57] |
| 3.2 8‐foot walk time | 1 | 312 | Std. Mean Difference (IV, Random, 95% CI) | 0.21 [‐0.01, 0.43] |
| 4 Stiffness Show forest plot | 2 | 380 | Std. Mean Difference (IV, Random, 95% CI) | 0.14 [‐0.06, 0.34] |
| 4.1 WOMAC stiffness | 2 | 380 | Std. Mean Difference (IV, Random, 95% CI) | 0.14 [‐0.06, 0.34] |
| 5 Quality of life Show forest plot | 3 | 599 | Std. Mean Difference (IV, Random, 95% CI) | 0.32 [0.03, 0.61] |
| 5.1 SF‐12 physical | 1 | 70 | Std. Mean Difference (IV, Random, 95% CI) | 0.69 [0.21, 1.17] |
| 5.2 PQOL ‐ perceived quality of life | 1 | 222 | Std. Mean Difference (IV, Random, 95% CI) | 0.35 [0.09, 0.62] |
| 5.3 EURO‐QOL | 1 | 307 | Std. Mean Difference (IV, Random, 95% CI) | 0.10 [‐0.12, 0.33] |
| 6 Mental health Show forest plot | 4 | 642 | Std. Mean Difference (IV, Random, 95% CI) | 0.16 [0.01, 0.32] |
| 6.1 SF‐36 mental | 1 | 307 | Std. Mean Difference (IV, Random, 95% CI) | 0.15 [‐0.08, 0.37] |
| 6.2 SF‐12 mental | 1 | 70 | Std. Mean Difference (IV, Random, 95% CI) | 0.19 [‐0.28, 0.66] |
| 6.3 Psychological Distress | 1 | 43 | Std. Mean Difference (IV, Random, 95% CI) | 0.37 [‐0.24, 0.97] |
| 6.4 QWB ‐ quality of well being | 1 | 222 | Std. Mean Difference (IV, Random, 95% CI) | 0.13 [‐0.13, 0.40] |
| Outcome or subgroup title | No. of studies | No. of participants | Statistical method | Effect size |
| 1 Function Show forest plot | 1 | 28 | Std. Mean Difference (IV, Random, 95% CI) | 0.76 [‐0.02, 1.53] |
| 1.1 DRI‐disability rating index | 1 | 28 | Std. Mean Difference (IV, Random, 95% CI) | 0.76 [‐0.02, 1.53] |
| 2 Quality of life Show forest plot | 1 | 28 | Std. Mean Difference (IV, Random, 95% CI) | 0.76 [‐0.02, 1.53] |
| 2.1 GSI ‐ global self rating index | 1 | 28 | Std. Mean Difference (IV, Random, 95% CI) | 0.76 [‐0.02, 1.53] |
| Outcome or subgroup title | No. of studies | No. of participants | Statistical method | Effect size |
| 1 Pain Show forest plot | 1 | 46 | Std. Mean Difference (IV, Random, 95% CI) | 0.86 [0.25, 1.47] |
| 1.1 VAS pain | 1 | 46 | Std. Mean Difference (IV, Random, 95% CI) | 0.86 [0.25, 1.47] |
| 2 Walking ability Show forest plot | 1 | 46 | Std. Mean Difference (IV, Random, 95% CI) | 0.43 [‐0.16, 1.01] |
| 2.1 1 MILE walk time | 1 | 46 | Std. Mean Difference (IV, Random, 95% CI) | 0.43 [‐0.16, 1.01] |
| 3 Stiffness Show forest plot | 1 | 46 | Std. Mean Difference (IV, Random, 95% CI) | ‐0.26 [‐0.84, 0.32] |
| Outcome or subgroup title | No. of studies | No. of participants | Statistical method | Effect size |
| 1 Pain Show forest plot | 1 | 310 | Std. Mean Difference (IV, Random, 95% CI) | 0.11 [‐0.12, 0.33] |
| 1.1 WOMAC pain | 1 | 310 | Std. Mean Difference (IV, Random, 95% CI) | 0.11 [‐0.12, 0.33] |
| 2 Function Show forest plot | 1 | 306 | Std. Mean Difference (IV, Random, 95% CI) | 0.10 [‐0.12, 0.33] |
| 2.1 WOMAC function | 1 | 306 | Std. Mean Difference (IV, Random, 95% CI) | 0.10 [‐0.12, 0.33] |
| 3 Stiffness Show forest plot | 1 | 310 | Std. Mean Difference (IV, Random, 95% CI) | 0.13 [‐0.09, 0.36] |
| 3.1 WOMAC stiffness | 1 | 310 | Std. Mean Difference (IV, Random, 95% CI) | 0.13 [‐0.09, 0.36] |
| 4 Mental health Show forest plot | 1 | 309 | Std. Mean Difference (IV, Random, 95% CI) | 0.05 [‐0.17, 0.27] |
| 4.1 SF‐36 mental | 1 | 309 | Std. Mean Difference (IV, Random, 95% CI) | 0.05 [‐0.17, 0.27] |
| Outcome or subgroup title | No. of studies | No. of participants | Statistical method | Effect size |
| 1 Pain Show forest plot | 1 | 17 | Std. Mean Difference (IV, Random, 95% CI) | 1.00 [‐0.04, 2.04] |
| 1.1 VAS pain | 1 | 17 | Std. Mean Difference (IV, Random, 95% CI) | 1.00 [‐0.04, 2.04] |
| 2 Function Show forest plot | 1 | 17 | Std. Mean Difference (IV, Random, 95% CI) | 1.00 [‐0.04, 2.04] |
| 2.1 DRI‐disability rating index | 1 | 17 | Std. Mean Difference (IV, Random, 95% CI) | 1.00 [‐0.04, 2.04] |
| 3 Quality of life Show forest plot | 1 | 17 | Std. Mean Difference (IV, Random, 95% CI) | 1.00 [‐0.04, 2.04] |
| 3.1 GSI ‐ global self rating index | 1 | 17 | Std. Mean Difference (IV, Random, 95% CI) | 1.00 [‐0.04, 2.04] |