Procedimientos de endodoncia para el retratamiento de las lesiones periapicales
Resumen
Antecedentes
Cuando falla el tratamiento primario del conducto radicular, las lesiones periapicales se pueden tratar de nuevo con o sin cirugía. El retratamiento del conducto radicular es un procedimiento no quirúrgico que incluye la extracción de los materiales de relleno del conducto radicular del diente, seguido de la limpieza, el moldeado y la obturación de los canales. La resección del extremo radicular es un procedimiento quirúrgico que implica la exposición de la lesión periapical mediante una osteotomía, la extirpación quirúrgica de la lesión, la eliminación de parte del extremo radicular, la desinfección y, habitualmente, el sellado retrógrado o la obturación de la parte apical del conducto radicular restante. Esta revisión actualiza una publicada en 2008.
Objetivos
Evaluar los efectos del tratamiento quirúrgico y no quirúrgico para el retratamiento de los dientes con periodontitis apical.
Evaluar los efectos de la resección quirúrgica del extremo radicular en diversas condiciones, por ejemplo, cuando se utilizan diferentes materiales, dispositivos o técnicas.
Métodos de búsqueda
Se realizaron búsquedas en las siguientes bases de datos electrónicas: el Registro de ensayos del Grupo Cochrane de Salud oral (Cochrane Oral Health) (hasta el 10 de febrero de 2016), el Registro Cochrane central de ensayos controlados (Cochrane Central Register of Controlled Trials [CENTRAL]; 2016, número 1), MEDLINE Ovid (1946 hasta el 10 de febrero de 2016) y Embase Ovid (1980 hasta el 10 de febrero de 2016). Se hicieron búsquedas de ensayos en curso en el US National Registry of Clinical Trials (ClinicalTrials.gov) y en la Plataforma de registros internacionales de ensayos clínicos de la Organización Mundial de la Salud (hasta el 10 de febrero de 2016). No se establecieron restricciones en cuanto al idioma ni la fecha de publicación. Se realizaron búsquedas manuales en las listas de referencias de los estudios identificados y en revistas importantes en el área de la endodoncia.
Criterios de selección
Se incluyeron ensayos controlados aleatorizados (ECA) que reclutaron personas con patosis periapical. Los estudios podían comparar la cirugía versus tratamiento no quirúrgico o podían comparar diferentes tipos de cirugía. Las medidas de desenlace fueron la cicatrización de la lesión periapical evaluada al año de seguimiento o más; el dolor y las molestias posoperatorias; y los efectos adversos como la pérdida de dientes, la movilidad, la recesión de tejidos blandos, el absceso, la infección, el daño neurológico o la pérdida del material de sellado radicular, evaluados mediante radiografías.
Obtención y análisis de los datos
Dos autores de la revisión, de forma independiente, extrajeron los datos de los estudios incluidos y evaluaron su riesgo de sesgo. Se estableció contacto con los autores de los estudios para obtener la información que faltaba. Los resultados de los ensayos que evaluaron desenlaces comparables se combinaron mediante el modelo de efectos fijos, con las razones de riesgos (RR) para los desenlaces dicotómicos y las diferencias de medias (DM) para los desenlaces continuos, e intervalos de confianza (IC) del 95%. Se utilizó la varianza inversa genérica para los estudios de boca dividida.
Resultados principales
Se incluyeron 20 ECA. Dos ensayos con alto riesgo de sesgo evaluaron la cirugía versus un enfoque no quirúrgico: la resección del extremo radicular con la obturación del extremo radicular versus el retratamiento del conducto radicular. Los otros 18 ensayos evaluaron diferentes protocolos quirúrgicos: tomografía computarizada de haz cónico (CBCT) versus radiografía periapical para la evaluación preoperatoria (un estudio con alto riesgo de sesgo); profilaxis antibiótica versus placebo (un estudio con riesgo incierto); diferentes dispositivos de aumento (lupas, microscopio quirúrgico, endoscopio) (dos estudios con alto riesgo); tipos de incisión (incisión en la base de las papilas, incisión sulcular) (un estudio de alto riesgo y otro de riesgo incierto); dispositivos ultrasónicos versus fresas manuales (un estudio de alto riesgo); tipos de material de obturación del extremo radicular (cemento de ionómero de vidrio, amalgama, material restaurador intermedio [IRM], agregado de trióxido mineral [MTA], gutapercha [GP], ácido superetoxibenzoico [EBA]) (cinco estudios con alto riesgo de sesgo, uno con riesgo incierto y uno con riesgo bajo); injerto versus no injerto (tres estudios con alto riesgo y uno con riesgo incierto); y terapia láser de bajo nivel de energía versus placebo (irradiación sin activación láser) versus control (sin el uso del dispositivo láser) (un estudio con alto riesgo).
No hubo evidencia clara de la superioridad del enfoque quirúrgico o no quirúrgico para la cicatrización al año de seguimiento (RR 1,15; IC del 95%: 0,97 a 1,35; dos ECA, 126 participantes) o a los cuatro o diez años de seguimiento (un ECA, 82 a 95 participantes), aunque la evidencia es de calidad muy baja. Más participantes del grupo tratado quirúrgicamente notificaron dolor en la primera semana después del tratamiento (RR 3,34; IC del 95%: 2,05 a 5,43; un ECA, 87 participantes; evidencia de calidad baja).
En cuanto a los protocolos quirúrgicos, hubo alguna evidencia no concluyente de que los dispositivos ultrasónicos para la preparación del extremo radicular podrían mejorar la cicatrización al año después del retratamiento, en comparación con la fresa tradicional (RR 1,14; IC del 95%: 1,00 a 1,30; un ECA, 290 participantes; evidencia de calidad baja).
Hubo evidencia de una mejor cicatrización cuando los extremos radiculares se rellenaron con MTA que cuando se trataron mediante el alisado del relleno ortógrado de la raíz con GP, después de un año de seguimiento (RR 1,60; IC del 95%: 1,14 a 2,24; un ECA, 46 participantes; evidencia de calidad baja).
No hubo evidencia de que el uso de la CBCT en lugar de la radiografía para la evaluación preoperatoria fuera ventajoso para la cicatrización (RR 1,02; IC del 95%: 0,70 a 1,47; un ECA, 39 participantes; evidencia de calidad muy baja), ni de que algún dispositivo de aumento afectara la cicatrización más que otro (lupas versus endoscopio al año: RR 1,05; IC del 95%: 0,92 a 1,20; microscopio versus endoscopio a los dos años: RR 1,01; IC del 95%: 0,89 a 1,15; un ECA, 70 participantes, evidencia de calidad baja).
No hubo evidencia de que la profilaxis antibiótica redujera la incidencia de infección posoperatoria (RR 0,49; IC del 95%: 0,09 a 2,64; un ECA, 250 participantes; evidencia de calidad baja).
Hubo alguna evidencia de que el uso de una incisión en la base de las papilas (PBI) podría ser beneficioso para la preservación de la papila interdental en comparación con la movilización completa de la papila (un ECA [boca dividida], 12 participantes/24 centros; evidencia de calidad muy baja). No hubo evidencia de menos dolor en el grupo de PBI en el primer día después de la cirugía (un ECA, 38 participantes; evidencia de calidad muy baja).
Hubo evidencia de que el uso adyuvante de un gel de plasma rico en factores de crecimiento redujo el dolor posoperatorio en comparación con ningún injerto (medido en la escala visual analógica: DM del primer día posoperatorio ‐51,60 mm; IC del 95%: ‐63,43 a ‐39,77; un ECA, 36 participantes; evidencia de calidad baja).
No hubo evidencia de que el uso del tratamiento con láser con bajo nivel de energía (TLNB) previniera el dolor posoperatorio (evidencia de calidad muy baja).
Conclusiones de los autores
La evidencia disponible no proporciona a los médicos guías confiables para tratar las lesiones periapicales. Se necesitan estudios de investigación adicionales para comprender los efectos de los enfoques quirúrgicos versus no quirúrgicos y para determinar qué procedimientos quirúrgicos proporcionan los mejores resultados para la cicatrización de la lesión periapical y la calidad de vida posoperatoria. Los estudios futuros deben usar técnicas y criterios de éxito estandarizados, desenlaces definidos de forma precisa y el participante como la unidad de análisis.
PICO
Resumen en términos sencillos
Procedimientos para el retratamiento del conducto radicular luego del fracaso del tratamiento
Pregunta de la revisión
Se procuraba determinar la mejor forma de volver a tratar a los pacientes en los que ha fallado el tratamiento del conducto radicular. Se deseaba saber si es mejor el retratamiento quirúrgico o no quirúrgico, y si el uso de materiales, dispositivos o procedimientos específicos en la cirugía podría mejorar la cicatrización de la lesión o reducir el malestar del paciente después de la cirugía. Esta revisión actualiza una publicada en 2008.
Antecedentes
En el tratamiento del conducto radicular se retira la pulpa infectada del diente y la cavidad de la raíz se desinfecta y se rellena con un material de sellado. Sin embargo, si los microorganismos que causaron la infección no se eliminan completamente, después de algún tiempo pueden causar una enfermedad en el extremo de la raíz, llamada lesión periapical. El tratamiento para esta afección requiere una segunda intervención, que se puede realizar de la misma manera que el primer tratamiento, desde la corona hasta el canal radicular, para eliminar el relleno existente y limpiar y desinfectar lo mejor posible antes de sellar nuevamente. Como alternativa, si este procedimiento fracasara, o si no fuese posible, se puede realizar una intervención quirúrgica.
Características de los estudios
Se realizó una amplia búsqueda de la literatura médica y dental hasta el 10 de febrero de 2016. Se identificaron 20 estudios que asignaron al azar a los participantes a grupos que recibieron diferentes formas de retratamiento de las lesiones periapicales. Estos estudios evaluaron nueve comparaciones diferentes el tratamiento quirúrgico frente al no quirúrgico (dos estudios, uno de ellos con seguimiento de los participantes hasta diez años); dos técnicas radiográficas de diagnóstico (un estudio); la aparición de infección posoperatoria con o sin antibióticos (un estudio); el uso de diferentes dispositivos para mejorar la visión del cirujano durante los pasos más críticos del procedimiento quirúrgico (un estudio); el aspecto estético de la encía junto al diente tratado y el dolor después de la operación cuando se utilizaron dos tipos diferentes de incisión gingival (dos estudios); el uso de dispositivos ultrasónicos mínimamente invasivos o de fresas giratorias tradicionales para tratar el extremo de la raíz (un estudio); el uso de diferentes materiales para rellenar del extremo de la raíz (siete estudios); el relleno de la lesión periapical con un material de injerto (cuatro estudios); y la exposición de la zona quirúrgica a un láser de bajo nivel de energía para reducir el dolor (un estudio).
Resultados clave
No existe evidencia de que un abordaje quirúrgico produzca mejores resultados en comparación con el retratamiento no quirúrgico un año más tarde (o a los cuatro o diez años) después de la intervención. Sin embargo, las personas tratadas quirúrgicamente informaron más dolor e inflamación durante la primera semana después del tratamiento.
Se evaluaron diferentes técnicas quirúrgicas. La cicatrización al año de seguimiento pareció mejorar con el uso de dispositivos ultrasónicos, en lugar de la fresa tradicional, para la preparación del extremo de la raíz. Hubo alguna evidencia de una mejor cicatrización al año de seguimiento cuando el extremo de la raíz se rellenó con agregado de trióxido mineral en comparación con el tratamiento con alisamiento del relleno ortógrado de la raíz con gutapercha.
El uso de un injerto compuesto de un gel enriquecido con las propias plaquetas del paciente aplicado al defecto durante el procedimiento quirúrgico alivió de forma significativa el dolor posoperatorio. La exposición a un láser de bajo nivel de energía aparentemente no alivió el dolor en el sitio quirúrgico.
Una incisión gingival pequeña podría preservar la encía entre dos dientes adyacentes, mejorando la apariencia estética y causando menos dolor después de la cirugía.
No hubo evidencia de que la administración de antibióticos redujera la aparición de infección posoperatoria (aunque cuando el procedimiento se realiza de forma adecuada, la infección es un episodio muy poco frecuente).
Las diferentes formas de mejorar la visión del cirujano no dieron lugar a diferentes resultados al menos un año después de la cirugía, y los resultados del retratamiento fueron independientes de la técnica radiográfica utilizada para hacer el diagnóstico.
Calidad de la evidencia
Se considera que la calidad de la evidencia es deficiente, por lo que no se puede confiar en los resultados. Sólo un estudio tuvo bajo riesgo de sesgo; la mayoría se consideró con alto riesgo de sesgo.
Conclusiones de los autores
Es difícil establecer conclusiones debido a que la evidencia disponible actualmente es de calidad baja a muy baja. Se necesitan más ensayos controlados aleatorizados, realizados con un estándar alto, para determinar los efectos del enfoque quirúrgico versus no quirúrgico y, cuando se utiliza la cirugía, qué materiales, dispositivos o protocolos quirúrgicos son mejores para optimizar la cicatrización de la lesión y reducir el malestar del paciente.
Authors' conclusions
Summary of findings
| Root‐end resection versus root canal retreatment | ||||||
| Patient or population: people requiring retreatment of periapical lesions Comparison: root canal retreatment | ||||||
| Outcomes | Anticipated absolute effects* (95% CI) | Relative effect | Number of participants | Quality of the evidence | Comments | |
| Risk with root canal retreatment | Risk with root‐end resection and filling | |||||
| Healing ‐ 1 year | 726 per 1000 | 835 per 1000 | RR 1.15 | 126 | ⊕⊝⊝⊝ | RR after 4 years was 1.03 (0.89 to 1.20) (1 study, 82 participants) RR after 10 years was 1.11 (0.88 to 1.41) (1 study, 95 participants) |
| Pain assessed with visual analogue scale (VAS) from 0 to 100 ‐ 1 day | Not assessed | |||||
| Prevalence of pain ‐ 1 day | 279 out of 1000 | 932 out of 1000 (572 to 1515) | RR 3.34 (2.05 to 5.43) | 87 (1 study) | ⊕⊕⊝⊝ | Number of participants reporting pain each day in the first postoperative week was significantly higher in the surgical group than in the non‐surgical group. |
| Occurrence of postoperative infection ‐ 4 weeks | Not assessed | |||||
| Height loss of interdental papilla | Not assessed | |||||
| Maximum pain assessed with verbal rating scale (VRS) | Not assessed | |||||
| *The risk in the intervention group (and its 95% confidence interval) is based on the assumed risk in the comparison group and the relative effect of the intervention (and its 95% CI). | ||||||
| GRADE Working Group grades of evidence | ||||||
| aQuality of evidence was downgraded owing to heterogeneity (inconsistency). bQuality of evidence was downgraded owing to imprecision (CI includes RR of 1.0). cQuality of evidence was downgraded because both studies had high risk of bias. dQuality of evidence was downgraded because it was based on a single small study at high risk of bias. | ||||||
| CBCT versus periapical radiography | ||||||
| Patient or population: people requiring retreatment of periapical lesions | ||||||
| Outcomes | Anticipated absolute effects* (95% CI) | Relative effect | Number of participants | Quality of the evidence | Comments | |
| Risk with periapical radiography | Risk with CBCT | |||||
| Healing ‐ 1 year | 737 per 1000 | 752 per 1000 | RR 1.02 | 39 | ⊕⊝⊝⊝ | |
| Pain assessed with visual analogue scale (VAS) from 0 to 100 ‐ 1 day | Not assessed | |||||
| Prevalence of pain ‐ 1 day | Not assessed | |||||
| Occurrence of postoperative infection ‐ 4 weeks | Not assessed | |||||
| Height loss of interdental papilla | Not assessed | |||||
| Maximum pain assessed with verbal rating scale (VRS) | Not assessed | |||||
| *The risk in the intervention group (and its 95% confidence interval) is based on the assumed risk in the comparison group and the relative effect of the intervention (and its 95% CI). | ||||||
| GRADE Working Group grades of evidence | ||||||
| aQuality of evidence was downgraded because it was derived from a single study at high risk of bias with imprecise results. | ||||||
| Preoperative antibiotic prophylaxis versus placebo | ||||||
| Patient or population: people requiring retreatment of periapical lesions | ||||||
| Outcomes | Anticipated absolute effects* (95% CI) | Relative effect | Number of participants | Quality of the evidence | Comments | |
| Risk with placebo | Risk with antibiotic prophylaxis | |||||
| Healing ‐ 1 year | Not assessed | |||||
| Pain assessed with visual analogue scale (VAS) from 0 to 100 ‐ 1 day | Not assessed | |||||
| Prevalence of pain ‐ 1 day | Not assessed | |||||
| Occurrence of postoperative infection ‐ 4 weeks | 32 per 1000 | 16 per 1000 | RR 0.49 | 250 | ⊕⊝⊝⊝ | |
| Height loss of interdental papilla | Not assessed | |||||
| Maximum pain assessed with verbal rating scale (VRS) | Not assessed | |||||
| *The risk in the intervention group (and its 95% confidence interval) is based on the assumed risk in the comparison group and the relative effect of the intervention (and its 95% CI). | ||||||
| GRADE Working Group grades of evidence | ||||||
| aQuality of evidence was downgraded because it was derived from a single study at unclear risk of bias with very imprecise results. | ||||||
| Different types of magnification devices | ||||||
| Patient or population: people requiring retreatment of periapical lesions | ||||||
| Outcomes | Anticipated absolute effects* (95% CI) | Relative effect | Number of participants | Quality of the evidence | Comments | |
| Risk with loupes or microscope | Risk with endoscope | |||||
| Loupes vs endoscope ‐ healing at 1 year | 906 per 1000 | 952 per 1000 | RR 1.05 | 62 (71 teeth) | ⊕⊕⊝⊝ | |
| Microscope vs endoscope ‐ healing at 2 years | 902 per 1000 | 911 per 1000 | RR 1.01 | 70 (100 teeth) | ⊕⊕⊝⊝ | |
| Pain assessed with visual analogue scale (VAS) from 0 to 100 ‐ 1 day | Not assessed | |||||
| Prevalence of pain ‐ 1 day | Not assessed | |||||
| Occurrence of postoperative infection ‐ 4 weeks | Not assessed | |||||
| Height loss of interdental papilla | Not assessed | |||||
| Maximum pain assessed with verbal rating scale (VRS) | Not assessed | |||||
| *The risk in the intervention group (and its 95% confidence interval) is based on the assumed risk in the comparison group and the relative effect of the intervention (and its 95% CI). | ||||||
| GRADE Working Group grades of evidence | ||||||
| aQuality of evidence was downgraded because it was derived from a single study at high risk of bias. | ||||||
| Papilla base incision (PBI) versus complete mobilisation | ||||||
| Patient or population: people requiring retreatment of periapical lesions | ||||||
| Outcomes | Anticipated absolute effects* (95% CI) | Relative effect | Number of participants | Quality of the evidence | Comments | |
| Risk with complete mobilisation | Risk with PBI | |||||
| Healing ‐ 1 year | Not assessed | |||||
| Pain assessed with visual analogue scale (VAS) from 0 to 100 ‐ 1 day | Mean pain was 90 mm | Mean pain in the intervention group was 2.25 lower (7.17 lower to 2.67 higher). | ‐ | 38 | ⊕⊝⊝⊝ | |
| Prevalence of pain ‐ 1 day | Not assessed | |||||
| Occurrence of postoperative infection ‐ 4 weeks | Not assessed | |||||
| Height loss of interdental papilla ‐ 1 year | Mean height loss of interdental papilla was 0.98 mm. | Mean height loss of interdental papilla in the intervention group was 1.04 mm lower (1.48 lower to 0.60 lower). | ‐ | 12 | ⊕⊝⊝⊝ | |
| Maximum pain assessed with verbal rating scale (VRS) | Not assessed | |||||
| *The risk in the intervention group (and its 95% confidence interval) is based on the assumed risk in the comparison group and the relative effect of the intervention (and its 95% CI). | ||||||
| GRADE Working Group grades of evidence | ||||||
| aQuality of evidence was downgraded because it was derived from a single small study at unclear risk of bias with very imprecise results. bQuality of evidence was downgraded because it was derived from one small split‐mouth study at high risk of bias. | ||||||
| Ultrasonic instruments versus bur | ||||||
| Patient or population: people requiring retreatment of periapical lesions | ||||||
| Outcomes | Anticipated absolute effects* (95% CI) | Relative effect | Number of participants | Quality of the evidence | Comments | |
| Risk with bur | Risk with ultrasonic | |||||
| Healing ‐ 1 year | 709 per 1000 | 809 per 1000 | RR 1.14 | 290 | ⊕⊕⊝⊝ | There was inconclusive evidence that use of ultrasonic devices could produce a better success rate after 1‐year follow‐up. |
| Pain assessed with visual analogue scale (VAS) from 0 to 100 ‐ 1 day | Not assessed | |||||
| Prevalence of pain ‐ 1 day | Not assessed | |||||
| Occurrence of postoperative infection ‐ 4 weeks | Not assessed | |||||
| Height loss of interdental papilla | Not assessed | |||||
| Maximum pain assessed with verbal rating scale (VRS) | Not assessed | |||||
| *The risk in the intervention group (and its 95% confidence interval) is based on the assumed risk in the comparison group and the relative effect of the intervention (and its 95% CI). | ||||||
| GRADE Working Group grades of evidence | ||||||
| aQuality of evidence downgraded because it was derived from one study at high risk of bias (attrition bias). | ||||||
| Different types of root end fillings | ||||||
| Patient or population: people requiring retreatment of periapical lesions Settings: university hospital | ||||||
| Outcomes | Illustrative comparative risks* (95% CI) | Relative effect | Number of Participants | Quality of the evidence | Comments | |
| Assumed risk | Corresponding risk | |||||
| Intermediate restorative material (IRM) | Mineral trioxide aggregate (MTA) | |||||
| Healing ‐ 1 year | 806 per 1000 | 878 per 1000 | RR 1.09 (0.97 to 1.21) | 222 | ⊕⊕⊝⊝ | RR after 2 years as computed on 108 participants (1 study) was 1.05 (95% CI 0.92 to 1.20). |
| Pain assessed with visual analogue scale (VAS) from 0 to 100 ‐ 1 day | Not assessed | |||||
| Prevalence of pain ‐ 1 day | 815 per 1000 | 823 per 1000 | RR 1.01 (0.84 to 1.22) | 100 | ⊕⊕⊝⊝ | RR after 2 days as computed on 100 participants (1 study) was 0.94 (95% CI 0.73 to 1.20). |
| Occurrence of postoperative infection ‐ 4 weeks | Not assessed | |||||
| Height loss of interdental papilla | Not assessed | |||||
| Maximum pain assessed with verbal rating scale (VRS) | Not assessed | |||||
| MTA | SuperEBA | |||||
| Healing ‐ 1 year | 956 per 1000 | 927 per 1000 | RR 0.97 (0.91 to 1.04) | 192 | ⊕⊕⊝⊝ | There was no evidence of a difference in success rate after 1‐year follow‐up when MTA or SuperEBA was used as root‐end filler. |
| Pain assessed with visual analogue scale (VAS) from 0 to 100 ‐ 1 day | Not assessed | |||||
| Prevalence of pain ‐ 1 day | Not assessed | |||||
| Occurrence of postoperative infection ‐ 4 weeks | Not assessed | |||||
| Height loss of interdental papilla | Not assessed | |||||
| Maximum pain assessed with verbal rating scale (VRS) | Not assessed | |||||
| Gutta‐percha | MTA | |||||
| Healing ‐ 1 year | 619 per 1000 | 990 per 1000 | RR 1.60 (1.14 to 2.24) | 46 (1 RCT) | ⊕⊕⊝⊝ | There was evidence of better healing rate after 1‐year follow‐up when MTA as compared with gutta‐percha was used. |
| Pain assessed with visual analogue scale (VAS) from 0 to 100 ‐ 1 day | Mean pain in the control group was 21. | Mean pain in the intervention groups was 4 units lower | 42 (1 RCT) | ⊕⊕⊝⊝ | After 2 days, mean difference in pain was 2.00 (‐6.22 to 10.22); after 3 days, mean difference in pain was 5.00 (‐4.37 to 14.37). | |
| Prevalence of pain ‐ 1 day | Not assessed | |||||
| Occurrence of postoperative infection ‐ 4 weeks | Not assessed | |||||
| Height loss of interdental papilla | Not assessed | |||||
| Maximum pain assessed with verbal rating scale (VRS) | Not assessed | |||||
| Amalgam | Glass ionomer cement | |||||
| Healing ‐ 1 year | 904 per 1000 | 886 per 1000 | RR 0.98 (0.86 to 1.12) | 105 (1 RCT) | ⊕⊝⊝⊝ | RR after 5 years as computed on 82 participants (1 study) was 1.00 (95% CI 0.84 to 1.20). |
| Pain assessed with visual analogue scale (VAS) from 0 to 100 ‐ 1 day | Not assessed | |||||
| Prevalence of pain ‐ 1 day | Not assessed | |||||
| Occurrence of postoperative infection ‐ 4 weeks | Not assessed | |||||
| Height loss of interdental papilla | Not assessed | |||||
| Maximum pain assessed with verbal rating scale (VRS) | Not assessed | |||||
| Gutta‐percha | IRM | |||||
| Healing ‐ 1 year (or longer) | 885 per 1000 | 814 per 1000 (708 to 929) | RR 0.92 (0.80 to 1.05) | 147 (1 RCT) | ⊕⊝⊝⊝ | There is no evidence of a difference in success rate after 1‐year follow‐up when gutta‐percha or IRM was used as root‐end filler. |
| Pain assessed with visual analogue scale (VAS) from 0 to 100 ‐ 1 day | Not assessed | |||||
| Prevalence of pain ‐ 1 day | Not assessed | |||||
| Occurrence of postoperative infection ‐ 4 weeks | Not assessed | |||||
| Height loss of interdental papilla | Not assessed | |||||
| Maximum pain assessed with verbal rating scale (VRS) | Not assessed | |||||
| IRM | SuperEBA | |||||
| Healing ‐ 1 year (or longer) | 816 per 1000 | 906 per 1000 (808 per 1000) | RR 1.11 (0.99 to 1.24) | 194 (1 RCT) | ⊕⊝⊝⊝ | There was no evidence of a difference in success rate after 1‐year follow‐up when SuperEBA or IRM was used as root‐end filler. |
| Pain assessed with visual analogue scale (VAS) from 0 to 100 ‐ 1 day | Not assessed | |||||
| Prevalence of pain ‐ 1 day | Not assessed | |||||
| Occurrence of postoperative infection ‐ 4 weeks | Not assessed | |||||
| Height loss of interdental papilla | Not assessed | |||||
| Maximum pain assessed with verbal rating scale (VRS) | Not assessed | |||||
| *The basis for the assumed risk (e.g. median control group risk across studies) is provided in footnotes. The corresponding risk (and its 95% confidence interval) is based on the assumed risk in the comparison group and the relative effect of the intervention (and its 95% CI). | ||||||
| GRADE Working Group grades of evidence | ||||||
| aQuality of evidence was downgraded owing to imprecision (CI includes RR of 1.0). bQuality of evidence was downgraded because one study had high risk of bias (attrition bias). cQuality of evidence was downgraded because it was based on a single study and because of imprecision. dQuality of evidence was downgraded because it was based on a single study that had high risk of bias. | ||||||
| Grafting versus no grafting | ||||||
| Patient or population: people requiring retreatment of periapical lesions Settings: university Intervention: grafting Control: no grafting | ||||||
| Outcomes | Illustrative comparative risks* (95% CI) | Relative effect | Number of participants | Quality of the evidence | Comments | |
| Assumed risk | Corresponding risk | |||||
| No grafting | Grafting | |||||
| Healing ‐ 1 year | Calcium sulphate | |||||
| 889 per 1000 | 996 per 1000 (738 per 1000) | RR 1.12 (0.83 to 1.50) | 18 (1 RCT) | ⊕⊕⊝⊝ | There was no evidence that grafting the periapical lesion with calcium sulphate may improve healing of the lesion after 1‐year follow‐up. | |
| GTR + Bovine bone | ||||||
| 743 per 1000 | 832 per 1000 (639 per 1000) | RR 1.12 (0.86 to 1.46) | 59 (1 RCT) | ⊕⊕⊝⊝ | There was no evidence that guided tissue regeneration improves healing of the lesion after 1‐year follow‐up. | |
| PRGF gel | ||||||
| Pain assessed with visual analogue scale (VAS) from 0 to 100 ‐ 1 day | Mean pain was 73.3. | Mean pain in the intervention group was 51.6 lower (63.43 lower to 39.77 lower). | ‐ | 36 (1 RCT) | ⊕⊕⊝⊝ | There was evidence that using plasma rich in growth factors may decrease postoperative pain in the early days after surgery. After 2 days, mean pain in the intervention group was 41.7 lower than in the control group (‐52.09 to ‐31.31); after 3 days, mean pain in the intervention group was 45 lower than in the control group (‐59.71 to ‐30.29). |
| Prevalence of pain ‐ 1 day | Not assessed | |||||
| Occurrence of postoperative infection ‐ 4 weeks | Not assessed | |||||
| Height loss of interdental papilla | Not assessed | |||||
| Maximum pain assessed with verbal rating scale (VRS) | Not assessed | |||||
| *The basis for the assumed risk (e.g. median control group risk across studies) is provided in footnotes. The corresponding risk (and its 95% confidence interval) is based on the assumed risk in the comparison group and the relative effect of the intervention (and its 95% CI). | ||||||
| GRADE Working Group grades of evidence | ||||||
| aQuality of evidence was downgraded two levels because it was based on a single study and because of imprecision. | ||||||
| Low energy level laser therapy compared with placebo for surgical retreatment of periapical lesions | ||||||
| Patient or population: people requiring retreatment of periapical lesions Control: placebo | ||||||
| Outcomes | Illustrative comparative risks* (95% CI) | Relative effect | Number of participants | Quality of the evidence | Comments | |
| Assumed risk | Corresponding risk | |||||
| Placebo | LLLT | |||||
| Healing ‐ 1 year | Not assessed | |||||
| Pain assessed with visual analogue scale (VAS) from 0 to 100 ‐ 1 day | Not assessed | |||||
| Prevalence of pain ‐ 1 day | Not assessed | |||||
| Occurrence of postoperative infection ‐ 4 weeks | Not assessed | |||||
| Height loss of interdental papilla ‐ 1 year | Not assessed | |||||
| Placebo | LLLT | |||||
| Maximum pain assessed with verbal rating scale (VRS) | 0 per 1000 | 0 per 1000 | Not estimable | 52 | ⊕⊝⊝⊝ | |
| Control | LLLT | |||||
| Maximum pain assessed with verbal rating scale (VRS) | 300 per 1000 | 0 per 1000 | Not estimable | 44 | ⊕⊝⊝⊝ | |
| *The basis for the assumed risk (e.g. median control group risk across studies) is provided in footnotes. The corresponding risk (and its 95% confidence interval) is based on the assumed risk in the comparison group and the relative effect of the intervention (and its 95% CI). | ||||||
| GRADE Working Group grades of evidence | ||||||
| aQuality of evidence was downgraded three levels because it is based on a single study at high risk of bias. | ||||||
Background
Description of the condition
Root canal treatment for the infected pulp of a tooth aims to eradicate pathological microbiota and prevent future infection within the root canals. Root canal treatment should obtain proper root canal shape, so an efficient cleaning can be performed before three‐dimensional filling (Wesselink 2010). In recent years, the number of people seeking root canal treatment has dramatically increased because a conservative approach is preferred over tooth extraction (Azarpazhooh 2013a; Azarpazhooh 2013b).
Even when an adequate standard of treatment is performed, failures may occur, owing to the anatomical characteristics of the root canal system and to the presence of peculiar noxious factors within the inflamed tissue (Nair 2004; Nair 2006). The persistence of micro‐organisms in the root canal system may induce an inflammatory and immune response in the periradicular (periapical) tissues, resulting in local bone destruction. Furthermore, contamination of the periradicular tissues and of the filling material by micro‐organisms may initiate a foreign body reaction, thereby impairing tissue healing.
Large cross‐sectional studies from different countries have reported that the prevalence of apical periodontitis and other post‐treatment periradicular disease can exceed 30% of all root‐filled teeth (Boucher 2002; Friedman 2002; Peters 2011; Tavares 2009), suggesting a considerable need for treatment of this condition.
Although two‐dimensional imaging techniques have been used in the past, it has been proposed that three‐dimensional imaging delineates greater detail, especially in the periradicular tissues. This may impact the diagnosis of periapical lesions requiring treatment, although robust evidence is lacking (Horner 2013; Petersson 2012).
Furthermore, the presence of cysts, extraradicular infections or other conditions not properly related to a dental pathosis, such as foreign body reactions, could be an indication for root‐end resection.
Description of the intervention
Although success rates up to 97% have been reported for the initial root canal treatment (Friedman 2002), failure may occur after treatment, mainly owing to incomplete removal of the pathogenic microbiota. In cases of persistent apical periodontitis or another post‐treatment periapical disease in a previously treated tooth, as a consequence of the failure of primary root canal treatment to permanently eradicate the infection, two possible treatment alternatives exist to preserve the tooth: root canal retreatment and root‐end resection.
Root canal retreatment has the same aim as primary treatment of infected root canals: complete elimination of micro‐organisms and hermetic sealing with biocompatible materials. This is accomplished by removal of root canal filling material, disinfection of the root canal system and sealing of root canals (Machtou 2010).
However, when root canal retreatment is not feasible, when it fails, when it is unlikely that it can improve on the previous result or when biopsy of the periapical lesion is necessary, a surgical intervention consisting of root‐end resection with or without root‐end filling might be indicated and represents the last chance for avoiding tooth extraction.
Root‐end resection (also named endodontic surgery, periradicular surgery, periapical/apical surgery or apicoectomy) consists of surgical removal of a periapical lesion, resection of the apical portion of the root, disinfection and sealing of the apical portion of the remaining root canal (Gutmann 1991).
Standard root‐end resection is performed through an osteotomy to make the site of the lesion accessible. Then, the technique includes surgical debridement of the pathological periradicular tissue, bevel resection of the apex with a bur, root‐end preparation and placement of root‐end filling material to seal the root canal. In the past, amalgam was generally used as the root filling material (Gutmann 1991).
A modern approach to root‐end resection involves the use of magnification to allow a smaller osteotomy. In addition, the apex is resected with minimal or no bevel and the root‐end is treated with ultrasonic tips, then is sealed with modern root‐end filling materials other than amalgam (Kim 2006; Tsesis 2006). This approach combines modern ultrasonic preparation and filling materials with use of microsurgical instruments, high‐power magnification and illumination to overcome the limitations associated with standard root‐end resection, achieving a higher probability of success (Setzer 2010). The microscopic approach to root‐end resection ensures easier root apex identification; also, the resected root apices can disclose, under magnification and illumination, complicated anatomical characteristics, intricate details of the apical ramifications, and isthmuses, microfractures and additional canals, allowing proper disinfection and filling of all root canals. Furthermore, the ultrasonic instruments used together with the microscope ensure that root‐end preparation may be performed in a conservative, deep and coaxial way, and that the root‐end filling may be precisely accomplished (Kim 2006; Setzer 2010). Various protocols have been proposed to optimise the results of root‐end resection and to reduce patient discomfort. For example, guided tissue regeneration with the use of membranes has been applied, different root‐end fillers have been used and different bone substitutes for enhancing bone regeneration have been adopted (Gutmann 2014).
Soft tissue management during root‐end resection was improved by the introduction of microsurgical instruments. Adequate soft tissue preservation has a beneficial impact on patient‐related outcomes during the early postoperative period, on postsurgical aesthetic outcomes and on healing (Kim 2006; Taschieri 2014; Taschieri 2016; Velvart 2005).
In a small segment of failed root canal cases, root canal retreatment or root‐end resection is not feasible or impractical. One alternative is intentional replantation, which is a procedure in which the tooth is gently extracted, curettage of the apical lesion (when present) is performed, the apicoectomy and root‐end filling procedure are performed extraorally and the tooth is replanted in its alveolar socket. Minimal extraction trauma and very short extraoral time (less than 10 minutes) are the most critical factors contributing to the success of this procedure, which has strict selection criteria for applicability. Its success rate, however, has been reported to be far lower than that of root canal retreatment or root‐end resection (Bender 1993; Rouhani 2011).
Another alternative to performing any kind of immediate operative treatment is to just observe and recall for further assessment. The possibility always exists that a periapical lesion that emerges or persists following root canal treatment may heal spontaneously. This option requires the patient agrees with the plan to not intervene and accepts undergoing an observation period of unpredictable duration to follow the natural history of the lesion. Of course, in case of painful exacerbation of the disease (flare‐ups), a decision to treat can be made, although it has been reported that the risk of flare‐ups among persistent lesions is very rare, and that they have minimal impact on daily activities (Yu 2012).
How the intervention might work
Root canal retreatment has the main aim of removing resident bacteria from the root canal systems and avoiding recurrence of intracanal infection.
After the root canal is accessed through an opening in the crown, and crowns, bridges or posts are removed, the root filling material has to be removed. Root canals then are reshaped, irrigated with antimicrobial solution to ensure complete eradication of micro‐organisms and closed with proper root canal filling material. Finally, the access hole is sealed (Machtou 2010; Ruddle 2004).
Root‐end resection with or without root‐end filling aims to regenerate damaged periapical tissues, confine intracanal bacteria and excise the lesion itself (Nair 2006; Von Arx 2001).
Complete surgical removal of the periapical lesion, adequate resection of the apex, root‐end preparation and three‐dimensional retrograde filling and sealing of the so‐created root‐end cavity are necessary to allow periapical tissue healing, which consists of neo‐osteogenesis in the cavity created by the lesion (Gutmann 1991).
Why it is important to do this review
Cochrane Oral Health undertook an extensive prioritisation exercise in 2014 to identify a core portfolio of clinically important titles to be maintained in The Cochrane Library (Worthington 2015). The operative and prosthodontic dentistry expert panel identified this review as a priority title (Cochrane OHG priority review portfolio).
Evidence of whether to use root canal retreatment or root‐end resection, in the case of a primary root canal treatment failure, is scarce and is now out of date (Del Fabbro 2007; Torabinejad 2009). Therefore, assessment of clinical and radiographic outcomes of these two treatment options is necessary to compare their success rates and to determine whether differences between them can be identified, with the final aim of providing clinicians with up‐to‐date information about current RCT evidence.
Furthermore, owing to variability in proposed techniques and heterogeneity in study design evident in the available literature, we seek to understand how root‐end resection protocols work, and which variables may affect clinical outcomes (Setzer 2010; Setzer 2012). We will systematically evaluate the efficacy of modern techniques to justify their use as a reliable alternative to standard surgical protocols.
Objectives
To assess effects of surgical and non‐surgical therapy for retreatment of teeth with apical periodontitis.
To assess effects of surgical root‐end resection under various conditions, for example, when different materials, devices or techniques are used.
Methods
Criteria for considering studies for this review
Types of studies
Randomised controlled trials dealing with root canal retreatment of teeth presenting periapical pathosis.
Types of participants
People who have had endodontic treatment of root canals of one or more teeth and who were diagnosed with a periapical condition requiring retreatment.
Types of interventions
Interventions for retreatment of teeth with periapical pathosis, consisting of one of the following.
-
Root canal retreatment.
-
Root‐end resection following a standard protocol (i.e. without magnification devices and with a bur for apex resection and root‐end preparation, a long bevel and amalgam as filling material).
-
Root‐end resection following a modern protocol (i.e. use of magnification devices with root‐end preparation through ultrasonic tips, a short bevel and modern sealing materials).
Types of outcome measures
We were interested in the healing of the periapical lesion (assessed clinically and radiologically), the occurrence of adverse effects and the impact of the intervention on postoperative quality of life.
Primary outcomes
-
One‐year healing of periapical pathosis evaluated by assessment of clinical signs and symptoms (absence of pain, suppuration, swelling) and through two‐dimensional or three‐dimensional radiological examination
-
Absence or presence of adverse effects or unexpected sequelae after endodontic surgery (tooth loss, mobility, soft tissue recession, abscess, infection, neurological damage, loss of root sealing material evaluated through radiographs)
-
Patient‐reported outcomes such as postoperative pain and discomfort or completion of an appropriate quality of life measurement during the first week after surgery
Secondary outcomes
-
Longer than one‐year healing of the periapical pathosis evaluated by assessment of clinical signs and symptoms (absence of pain, suppuration, swelling) and through radiological examination.
Search methods for identification of studies
To identify studies for this review, we developed detailed search strategies for each database searched. These were based on the search strategy developed for MEDLINE (Ovid) and were revised appropriately for each database. The search strategy used a combination of controlled vocabulary and free‐text terms and was linked with the Cochrane Highly Sensitive Search Strategy (CHSSS) for identifying RCTs in MEDLINE: sensitivity‐maximising version (2008 revision), as referenced in Chapter 6.4.11.1 and detailed in Box 6.4.c of the Cochrane Handbook for Systematic Reviews of Interventions Version 5.1.0 (updated March 2011) (Lefebvre 2011). We provide details of the MEDLINE search in Appendix 1. The search of Embase was linked to the Cochrane Oral Health filter for identifying RCTs.
Electronic searches
We searched the following electronic databases.
-
Cochrane Oral Health Trials Register (searched 10 February 2016) (see Appendix 2).
-
Cochrane Central Register of Controlled Trials (CENTRAL; 2016, Issue 1), in The Cochrane Library (searched 10 February 2016) (see Appendix 3).
-
MEDLINE Ovid (1946 to 10 February 2016) (see Appendix 1).
-
Embase Ovid (1980 to 10 February 2016) (see Appendix 4).
We applied no restrictions on language or date of publication in our searches of electronic databases.
Searching other resources
We searched the following trial registries for ongoing studies.
-
US National Institutes of Health Ongoing Trials Register ClinicalTrials.gov (http://clinicaltrials.gov/; searched 10 February 2016).
-
World Health Organization International Clinical Trials Registry Platform (apps.who.int/trialsearch; searched 10 February 2016).
We searched the reference lists of included studies and of relevant systematic reviews for additional studies.
Moreover, we performed a handsearch of all issues (from 1960 to February 2016) of the following journals.
-
British Journal of Oral and Maxillofacial Surgery.
-
International Endodontic Journal.
-
Journal of Endodontics.
-
Dental Traumatology (formerly Dental Traumatology and Endodontics).
-
Oral Surgery, Oral Medicine, Oral Pathology, Oral Radiology and Endodontics.
-
International Journal of Oral and Maxillofacial Surgery.
-
Journal of Oral and Maxillofacial Surgery.
-
Australian Endodontic Journal.
-
British Dental Journal.
-
Australian Dental Journal.
-
Journal of Dentistry.
To identify additional unpublished and ongoing RCTs, we contacted manufacturers of instruments for root canal treatment and for endodontic surgery, along with the authors of selected RCTs.
Data collection and analysis
Selection of studies
Two review authors (SC, MDF) independently screened titles and abstracts of the retrieved studies and discarded non‐relevant articles. We obtained the full text of all studies that we considered relevant, or for which we did not have sufficient information, and two review authors (SC, MDF) independently evaluated these to check whether they met the inclusion criteria. The two review authors resolved disagreements by discussion and consultation with a third review author. We collated multiple publications of the same study. For all studies rejected at this stage, we recorded reasons for exclusion in the Characteristics of excluded studies tables.
Data extraction and management
Two review authors (SC, IT) independently extracted data and resolved disagreements through discussion and consultation with a third review author. In cases of missing information, we contacted authors of the included studies through email. In cases of missing or incomplete data and absence of further clarification by study authors, we excluded these reports from the analysis.
We recorded the following data for each included study.
-
Demographic characteristics of the study population.
-
Setting, country, year, study design.
-
Funding source.
-
Number of surgeons involved.
-
Characteristics of the intervention.
-
Outcome characteristics (how outcomes were assessed, time intervals, results).
Assessment of risk of bias in included studies
Two review authors (IT, PSB) independently assessed the risk of bias of included studies. If papers to be assessed listed one or more review authors on the byline, review authors not involved in the trial independently evaluated these studies. We resolved disagreements by discussion.
We conducted the risk of bias assessment according to instructions provided in the Cochrane Handbook for Systematic Reviews of Interventions (Higgins 2011). We considered five items for each study: selection bias, performance bias, detection bias, attrition bias and reporting bias. For each domain, we judged the risk as low, unclear or high. If a study had low risk for each item, we judged that study to have low risk of bias. If a study had unclear risk for at least one domain but no items scored at high risk, we judged that study to have unclear risk of bias. If a study had high risk of bias for at least one domain, we judged that study to be at high risk of bias.
Measures of treatment effect
For dichotomous outcomes, we calculated estimates of effects of interventions as risk ratios (RRs) with 95% confidence intervals (CIs). For continuous variables, we calculated estimates of effects of interventions as mean differences (MDs) with 95% CIs.
Unit of analysis issues
In parallel‐group studies, the statistical unit of analysis was usually the participant ‐ not the lesion or the tooth. We undertook a tooth‐based meta‐analysis if only tooth‐based data ‐ instead of participant‐based data ‐ were available for all studies addressing a given comparison. In split‐mouth studies, the tooth was considered as the unit of analysis.
Dealing with missing data
When necessary, we contacted corresponding authors of study articles through email to request missing data regarding specific items considered in the risk of bias assessment. If these authors did not respond, we sent the same email again, copying in coauthors, a maximum of three times. If no answer was obtained, and no sufficient outcome data were available for the analysis, we did not include the data in the analysis and considered the relative item at high risk of bias.
Assessment of heterogeneity
We assessed heterogeneity among studies using the Chi2 test, considering significance at P < 0.1. We quantified heterogeneity by calculating I2 statistics. If I2 was over 50%, we considered it significant (Higgins 2011).
Assessment of reporting biases
We assessed publication bias by testing for funnel plot asymmetry, as described in the Cochrane Handbook for Systematic Reviews of Interventions (Higgins 2011). If asymmetry was evident, we investigated this and described possible causes.
Data synthesis
We performed meta‐analysis for studies with comparable outcomes, calculating RRs for dichotomous data ('success' or 'non‐success' of retreatment) and MDs for continuous data (self‐reported pain on a visual analogue scale). As in the previous version of this review, we dichotomised data regarding healing of the periapical lesion that are usually expressed as four scores (complete, incomplete, uncertain, unsatisfactory healing) into success (complete plus incomplete healing data) and non‐success (uncertain plus unsatisfactory healing data). Similarly, for other outcomes expressed as scores composed of four or five items, we grouped those that were similar in order to express data in a dichotomous form and allow meta‐analysis. We used the fixed‐effect model, as each meta‐analysis included fewer than four studies. For data from split‐mouth studies, we used the generic inverse variance method. We had planned to calculate numbers needed to treat for the primary outcome. When meta‐analysis was not appropriate, we described individual study data in the text.
We used the software Review Manager for meta‐analysis computations (RevMan 5.3).
Subgroup analysis and investigation of heterogeneity
We had planned to perform subgroup analysis when we identified a sufficient number of included studies. We had planned subgroups based on:
-
whether root‐end resection was performed with a standard or a modern technique;
-
whether or not guided bone regeneration (GBR) techniques were applied;
-
use of different magnification devices (surgical microscope, loupes, endoscope); and
-
use of different root‐end fillers (such as mineral trioxide aggregate (MTA), ethoxy benzoic acid (EBA) cement and intermediate restorative material (IRM)).
Sensitivity analysis
We had planned to perform sensitivity analysis by excluding studies at high risk of bias to evaluate the effect of study risk of bias on overall effects.
Assessment of quality of the evidence
We assessed the quality of the body of evidence using GRADE criteria, with reference to the overall risk of bias of included studies, directness of the evidence, consistency of the results, precision of the estimates and risk of publication bias. We graded the quality of the body of evidence for each primary outcome as high, moderate, low or very low.
Presentation of main results
We developed a 'Summary of findings' table for each comparison and for the primary outcomes of this review using GRADEPro software. We reported the following outcomes.
-
Healing at one year.
-
Pain (visual analogue scale 0 to 100) on day 1.
-
Prevalence of pain.
-
Occurrence of postoperative infection.
-
Loss of interdental papilla height.
Results
Description of studies
See Characteristics of included studies and Characteristics of excluded studies.
Results of the search
We present the flow of the article screening process in Figure 1. The electronic search yielded a total of 1716 records. After deduplication, 1018 records remained. After screening of titles and abstracts, we considered 26 articles potentially eligible for inclusion. We selected 10 additional articles by journal handsearching or by searching through the references of the selected articles. After full‐text evaluation, we excluded nine studies (Bader 1998; Dhiman 2015; Garrett 2002; Goyal 2011; Huumonen 2003; Kim 2008; Marin‐Botero 2006; Shearer 2009; Von Arx 2010a) and included 20 studies (27 publications) (Angerame 2015; Chong 2003; Christiansen 2009; Danin 1996; De Lange 2007; Del Fabbro 2009; Del Fabbro 2012; Kurt 2014; Kvist 1999; Lindeboom 2005a; Lindeboom 2005b; Payer 2005; Pecora 2001; Song 2012; Taschieri 2007; Taschieri 2008; Velvart 2004; Walivaara 2009; Walivaara 2011; Zetterqvist 1991). Seven of the included studies (Chong 2003; Christiansen 2009; Kvist 1999; Taschieri 2007; Taschieri 2008; Velvart 2004; Zetterqvist 1991) were reported in multiple articles.

Study flow diagram
Included studies
Of the 20 included studies, five were performed in Sweden (Danin 1996; Kvist 1999; Walivaara 2009; Walivaara 2011; Zetterqvist 1991), six in Italy (Angerame 2015; Del Fabbro 2009; Del Fabbro 2012; Pecora 2001; Taschieri 2007; Taschieri 2008), three in The Netherlands (De Lange 2007; Lindeboom 2005a; Lindeboom 2005b) and one each in Austria (Payer 2005), Denmark (Christiansen 2009), Korea (Song 2012), Switzerland (Velvart 2004), Turkey (Kurt 2014) and United Kingdom (Chong 2003).
Characteristics of study design, trial setting and investigators
All studies except Velvart 2004 used a parallel‐group study design. Velvart 2004, the only split‐mouth study, evaluated the height of interdental papilla after root‐end resection, comparing two different approaches for incision: papilla base incision (PBI) versus complete papilla mobilisation, involving the two papillae adjacent to the tooth undergoing endodontic surgery.
One trial declared that support was received from industry directly involved in the product being tested, along with free material (De Lange 2007). For four studies, funding was provided by the author's institution (Chong 2003; Christiansen 2009; Danin 1996; Lindeboom 2005a). Six studies declared that no specific funding was received for performing the study (Del Fabbro 2009; Del Fabbro 2012; Kvist 1999; Lindeboom 2005b; Taschieri 2007; Taschieri 2008). For the remaining nine studies (Angerame 2015; Kurt 2014; Payer 2005; Pecora 2001; Song 2012; Velvart 2004; Walivaara 2009; Walivaara 2011; Zetterqvist 1991), study authors did not state the source of funding (if any) and provided no information.
Seven studies included only one surgeon (Angerame 2015; Christiansen 2009; Del Fabbro 2009; Del Fabbro 2012; Kurt 2014; Kvist 1999; Song 2012); 10 studies included two surgeons (Chong 2003; Danin 1996; Lindeboom 2005a; Pecora 2001; Taschieri 2007; Taschieri 2008; Velvart 2004; Walivaara 2009; Walivaara 2011; Zetterqvist 1991); one study had three surgeons (Lindeboom 2005b); one study had four surgeons Payer 2005; and one study had seven surgeons (five oral and maxillofacial surgeons and two endodontic surgeons) (De Lange 2007).
Eight studies reported an a priori sample size calculation (Chong 2003; De Lange 2007; Del Fabbro 2009; Del Fabbro 2012; Kvist 1999; Lindeboom 2005b; Song 2012; Taschieri 2008).
Nine studies did not specify the lesion size (Angerame 2015; Chong 2003; Christiansen 2009; De Lange 2007; Kurt 2014; Song 2012; Velvart 2004; Walivaara 2009; Zetterqvist 1991), although two of these (Christiansen 2009; Kurt 2014) reported that they estimated the lesion condition by using the periapical index (PAI). The other studies reported lesion sizes smaller than 5 mm (Payer 2005); smaller than 5 mm and 5 mm or larger (Danin 1996; Kvist 1999); smaller than 5 mm, 5 to 9 mm and larger than 9 mm (Walivaara 2011); 3 to 19 mm (Taschieri 2008); 8 to 12 mm (Del Fabbro 2012); smaller than 10 mm (Del Fabbro 2009; Lindeboom 2005a; Lindeboom 2005b); and larger than 10 mm (Pecora 2001; Taschieri 2007).
Characteristics of the interventions
The included studies evaluated the following comparisons of different aspects of endodontic surgery.
-
Root‐end resection with root‐end filling versus root canal retreatment of periapical lesions (Danin 1996; Kvist 1999).
-
Type of preoperative evaluation: cone beam computed tomography (CBCT) versus conventional periapical radiography (Kurt 2014).
-
Prophylactic antibiotic versus placebo (Lindeboom 2005a).
-
Incision type: papilla base incision (PBI) versus complete papilla mobilisation (Velvart 2004); PBI versus sulcular incision (Del Fabbro 2009).
-
Magnification type: surgical microscope versus endoscope versus surgical loupes (Taschieri 2008).
-
Ultrasonic device versus conventional bur for root‐end preparation (De Lange 2007).
-
Root‐end filling material: glass ionomer cement versus amalgam (Zetterqvist 1991); MTA versus IRM (Chong 2003; Lindeboom 2005b); MTA versus gutta‐percha smoothing (Christiansen 2009); MTA versus SuperEBA (Song 2012); IRM versus gutta‐percha (Walivaara 2009); and IRM versus SuperEBA (Walivaara 2011).
-
Grafting versus no grafting: calcium sulphate versus no grafting (Pecora 2001); guided tissue regeneration (GTR) using bovine bone mineral and resorbable collagen membrane versus no GTR (Taschieri 2007); plasma rich in growth factors versus no grafting (Del Fabbro 2012); and platelet‐rich fibrin versus no grafting (Angerame 2015).
-
Low energy level laser therapy (LLLT) versus placebo versus control (Payer 2005).
Characteristics of outcome measures
The included studies used the following outcomes to assess treatments.
-
Periapical healing by clinical and radiographic evaluation, adopting the criteria of Molven 1987 (Angerame 2015; Chong 2003; Song 2012), of Molven 1987 and Rud 1972 (Christiansen 2009; Lindeboom 2005b; Walivaara 2009; Walivaara 2011), of Molven 1987 and Gutmann 1991 (Taschieri 2007; Taschieri 2008), of Zetterqvist 1991 (Kurt 2014; Zetterqvist 1991) and of Reit 1983 (Kvist 1999).
-
Periapical healing by radiographic evaluation alone, adopting the criteria of Rud 1972 (Danin 1996; De Lange 2007; Pecora 2001).
-
Postoperative pain by visual analogue scale (VAS) (Chong 2003; Christiansen 2009; Del Fabbro 2009; Del Fabbro 2012; Kurt 2014; Kvist 1999; Payer 2005) or by other scales (Angerame 2015).
-
Other postoperative symptoms related to patient discomfort, such as swelling, inflammation, bleeding, tenderness on palpation or percussion through a questionnaire that used a Likert scale or other scales (Angerame 2015; Christiansen 2009; Del Fabbro 2009; Del Fabbro 2012; Kurt 2014; Kvist 1999; Payer 2005).
-
Assessment of wound healing for signs of infection (Lindeboom 2005a).
-
Height of interdental papilla (Velvart 2004).
Duration of follow‐up
Follow‐ups up to one week were adopted only in studies that aimed to assess postsurgical pain and discomfort and were as follows.
-
Two days (Chong 2003).
-
Three days (Christiansen 2009).
-
Seven days (Angerame 2015; Del Fabbro 2009; Del Fabbro 2012; Kvist 1999; Payer 2005).
Studies assessing healing of periapical lesions reported outcome measures at the following time points.
-
One year (Angerame 2015; Christiansen 2009; Danin 1996; De Lange 2007; Kurt 2014; Kvist 1999; Lindeboom 2005b; Pecora 2001; Song 2012; Taschieri 2007; Zetterqvist 1991).
-
Two years (Chong 2003; Taschieri 2008).
-
Four years (Kvist 1999).
-
Five years (Zetterqvist 1991).
-
10 years (Kvist 1999; unpublished data).
Two studies that evaluated healing of periapical lesions reported results in follow‐up ranges with a minimum follow‐up of 12 months and mean values of 15.6 months (Walivaara 2009) and 13.1 months (Walivaara 2011).
One study evaluated the efficacy of prophylactic antibiotic administration by recording the occurrence of postoperative infection and had a follow‐up of four weeks (Lindeboom 2005a).
One study evaluated the height of the interproximal papilla after one‐year follow‐up (Velvart 2004).
Excluded studies
We excluded two studies because they were not actually randomised to treatment (Bader 1998; Von Arx 2010a). We excluded one study because healing was evaluated after too short a follow‐up period (Shearer 2009). We excluded four studies because they treated apicomarginal defects (Dhiman 2015; Goyal 2011; Kim 2008; Marin‐Botero 2006); one of which specifically compared the outcome of endodontic microsurgery for apical versus apicomarginal defects (Kim 2008). In the present review, we considered only lesions confined to the periapical region, not endoperiodontal lesions. We excluded one studybecause it dealt only with orthograde endodontic retreatment ‐ not apical surger (Huumonen 2003), and another study because recruitment was defective and the dropout rate was extremely high (Garrett 2002). In that study, recruitment of 60 participants was planned, but only 25 were actually treated and only 13 could be evaluated at the scheduled follow‐up.
Risk of bias in included studies
Overall, we judged only one study to be at low risk of bias (Lindeboom 2005b), and four studies to be at unclear risk of bias (Del Fabbro 2009; Lindeboom 2005a; Pecora 2001; Taschieri 2008). We considered all other studies to be at high risk of bias (Angerame 2015; Chong 2003; Christiansen 2009; Danin 1996; Del Fabbro 2012; De Lange 2007; Kurt 2014; Kvist 1999; Payer 2005; Song 2012; Taschieri 2007; Velvart 2004; Walivaara 2009; Walivaara 2011; Zetterqvist 1991). See Figure 2 and Figure 3.

Risk of bias graph: review authors' judgements about each risk of bias item presented as percentages across all included studies

Risk of bias summary: review authors' judgements about each risk of bias item for each included study
Allocation
Random sequence generation
We deemed the randomisation method to be appropriate in 17 studies, and we assessed these studies to be at low risk of bias. Payer 2005 and Velvart 2004 reported no details on the randomisation procedure, and study authors provided no information; we therefore assessed these studies as being at unclear risk of bias. In the study by Walivaara 2009, participants were allocated into two groups according to their date of birth, which meant that we judged this study to be at high risk of bias.
Allocation concealment
When assessing information reported in the trials, we considered allocation concealment as adequate for eight studies (Chong 2003; Del Fabbro 2009; Del Fabbro 2012; Kvist 1999; Lindeboom 2005a; Lindeboom 2005b; Pecora 2001; Taschieri 2008). We considered five trials to have unclear concealment of allocation, even after receiving study authors' replies (Christiansen 2009; De Lange 2007; Kurt 2014; Payer 2005; Song 2012). In seven studies (Angerame 2015; Danin 1996; Taschieri 2007; Velvart 2004; Walivaara 2009; Walivaara 2011; Zetterqvist 1991), allocation concealment, as stated in the article or confirmed by some of the authors, was not attempted and so we assessed these studies as having high risk of bias.
Blinding
Blinding of participants and personnel (performance bias)
In some cases (Danin 1996; Kvist 1999), blinding of treatment to operators or to participants was not feasible, as surgical and non‐surgical procedures were compared. In these cases, we classified risk of bias as high. On the basis of information present in the articles and the replies of study authors, we considered the risk of performance bias to be low in five studies (De Lange 2007; Lindeboom 2005a; Lindeboom 2005b; Payer 2005; Pecora 2001), unclear in two studies (Chong 2003; Del Fabbro 2009) and high in 13 studies (Angerame 2015; Christiansen 2009; Danin 1996; Del Fabbro 2012; Kurt 2014; Kvist 1999; Song 2012; Taschieri 2007; Taschieri 2008; Velvart 2004; Walivaara 2009; Walivaara 2011; Zetterqvist 1991).
Blinding of outcome assessment (detection bias)
On the basis of information present in the articles and the replies of trial authors, we judged the risk of detection bias to be low in 13 studies (Angerame 2015; Chong 2003; Christiansen 2009; De Lange 2007; Del Fabbro 2009; Del Fabbro 2012; Lindeboom 2005a; Lindeboom 2005b; Payer 2005; Pecora 2001; Song 2012; Taschieri 2007; Taschieri 2008), unclear in one study (Kurt 2014) and high in six studies (Danin 1996; Kvist 1999; Velvart 2004; Walivaara 2009; Walivaara 2011; Zetterqvist 1991).
Incomplete outcome data
In the study articles, investigators clearly presented adequate information on all participants treated (including reasons for dropout) in nine trials (Angerame 2015; Christiansen 2009; Del Fabbro 2009; Del Fabbro 2012; Kvist 1999; Lindeboom 2005a; Lindeboom 2005b; Pecora 2001; Velvart 2004). This information was only partially reported and remained unclear after the trial author's reply for seven studies (Danin 1996; Kurt 2014; Taschieri 2007; Taschieri 2008; Walivaara 2009; Walivaara 2011; Zetterqvist 1991). For three studies, there was no information at all on dropouts and missing data, which put them at high risk of bias for this item (Chong 2003; Payer 2005; Song 2012). In two studies (De Lange 2007; Zetterqvist 1991), the dropout rate was rather high (> 20%), although investigators provided an explanation for dropouts.
Selective reporting
Thirteen studies reported full information on outcome measures, and we considered these trials to be at low risk of bias (Angerame 2015; Chong 2003; Christiansen 2009; Danin 1996; De Lange 2007; Del Fabbro 2009; Del Fabbro 2012; Kvist 1999; Lindeboom 2005a; Lindeboom 2005b; Pecora 2001; Song 2012; Velvart 2004). Seven studies reported partial or doubtful information on data of outcome measures that were assessed, though they reported the primary outcome healing of the periapical lesion in a satisfactory manner, hence we assessed these studies as being at unclear risk of bias (Kurt 2014; Payer 2005; Taschieri 2007; Taschieri 2008; Walivaara 2009; Walivaara 2011; Zetterqvist 1991). Another reason for the 'unclear' assessment for Payer 2005 was that only diagrams were provided for several variables, making obtaining actual numbers impossible and hence preventing meta‐analysis.
Other potential sources of bias
We considered eight studies to be at low risk of any other potential source of bias (Christiansen 2009; Del Fabbro 2009; Del Fabbro 2012; Kvist 1999; Lindeboom 2005b; Payer 2005; Taschieri 2007; Taschieri 2008). Twelve studies did not perform an a priori sample size calculation (Angerame 2015; Christiansen 2009; Danin 1996; Kurt 2014; Lindeboom 2005a; Payer 2005; Pecora 2001; Taschieri 2007; Velvart 2004; Walivaara 2009; Walivaara 2011; Zetterqvist 1991), although this was not per se considered a possible source of bias; we assigned a judgement of 'unclear risk' only when missing sample size calculation was associated with other possible sources of bias. Lindeboom 2005b performed sample size calculation, although investigators did not clearly report the details. In one study (De Lange 2007), comparing two different devices for root‐end preparation (ultrasonic device versus round dental bur), seven operators performed surgical procedures; the experience and comparability of the seven operators was not specified, and it was not clear each of them performed interventions in both groups equally; therefore, we judged this study to be at high risk of bias. Other studies failed to give a complete description of the characteristics of the study setting and of participant population (Angerame 2015; Chong 2003; Danin 1996; De Lange 2007; Kurt 2014; Lindeboom 2005a; Payer 2005; Pecora 2001; Song 2012; Velvart 2004; Walivaara 2009; Walivaara 2011; Zetterqvist 1991). We did not consider missing information about study characteristics, such as the recruitment period, sources of funding or participant characteristics including proportion of smokers, age and gender per se as a source of bias, but only as imprecision in reporting. On the other hand, missing information about lesion size and the type of teeth treated (as in Angerame 2015; Chong 2003; De Lange 2007; Pecora 2001; Song 2012; Velvart 2004; Walivaara 2009; and Zetterqvist 1991) may be more relevant as these parameters might affect the treatment outcome and it is important they are equally distributed among groups. In Zetterqvist 1991, which reported one‐year and five‐year follow‐up evaluations, periapical healing was assessed using personal criteria instead of the conventional criteria adopted by most studies. Investigators in the two studies by Walivaara (Walivaara 2009; Walivaara 2011) did not assess participants at a given follow‐up time but reviewed them clinically and radiographically after a minimum of one year (12 to 38 months in Walivaara 2009, and 12 to 21 months in Walivaara 2011). Therefore periapical lesion healing was evaluated at a follow‐up duration not equal for all teeth. For the quantitative analysis, it was as if all participants were assessed at one year, which was likely to lead to underestimation of the results because some lesions may take longer than one year to heal. We considered the two studies at high risk of bias for this item.
Effects of interventions
See: Summary of findings for the main comparison Root‐end resection versus root canal retreatment; Summary of findings 2 Cone beam computed tomography (CBCT) versus periapical radiography; Summary of findings 3 Preoperative antibiotic prophylaxis versus placebo; Summary of findings 4 Magnification devices; Summary of findings 5 Papilla base incision (PBI) incision versus complete mobilisation; Summary of findings 6 Ultrasonic instruments versus bur; Summary of findings 7 Root end fillings; Summary of findings 8 Grafting versus no grafting; Summary of findings 9 Low energy level laser therapy versus placebo versus control
See summary of findings Table for the main comparison; summary of findings Table 2; summary of findings Table 3; summary of findings Table 4; summary of findings Table 5; summary of findings Table 6; summary of findings Table 7; and summary of findings Table 8.
1. Root‐end resection with or without root‐end filling versus root canal retreatment for secondary treatment of periapical lesions (two trials, 126 participants)
Two studies at high risk of bias addressed this comparison (Danin 1996; Kvist 1999). Kvist 1999 compared surgical and non‐surgical treatments at six‐month and one‐, two‐ and four‐year follow‐up periods. The results in the article were summarised only by a diagram but the main author provided us with numerical data that we considered for the present analysis. Danin 1996 provided results for healing at one‐year follow‐up only. Data from these two studies were dichotomised as described in the Data synthesis section of this review.
We found no clear evidence that surgical intervention had a higher healing rate than non‐surgical intervention after one‐year follow‐up (risk ratio (RR) 1.15, 95% confidence interval (CI) 0.97 to 1.35; Analysis 1.1; Figure 4). We noted heterogeneity between study results (P = 0.02). Similarly, Kvist 1999 found no evidence of a difference in healing rates between root‐end resection and root canal retreatment after four years (RR 1.03, 95% CI 0.89 to 1.20; Analysis 1.2; Figure 5). The study author reported that four surgically retreated cases that had been classified as healed at one‐year follow‐up did show a relapse of the apical radiolucency or presented with clinical symptoms at a later follow‐up. The author of the latter study provided us with data recorded at a longer follow‐up (10 years, personal communication), which confirmed there was no evidence of a difference between groups (RR 1.11, 95% CI 0.88 to 1.41; Analysis 1.3; Figure 6).

Forest plot of comparison: 1 Root‐end resection versus root canal retreatment, outcome: 1.1 Healing ‐ one year

Forest plot of comparison: 6 Ultrasonic versus Bur, outcome: 6.1 Healing ‐ one year
Evaluation of self‐reported pain and swelling in the first seven days after secondary treatment showed a significantly higher number of participants reporting pain and swelling in the root‐end resection group as compared with the root canal retreatment group (Analysis 1.4; Analysis 1.5).
2. Type of preoperative evaluation: cone beam computed tomography (CBCT) versus conventional periapical radiography (one trial, 39 participants)
One study at high risk of bias addressed this question (Kurt 2014). There was no evidence that use of CBCT in the preoperative evaluation was advantageous, in terms of one‐year clinical and radiographic healing, as shown in Analysis 2.1 (RR 1.02, 95% CI 0.70 to 1.47).
3. Antibiotic prophylaxis versus placebo (one trial, 250 participants)
One study at unclear risk of bias addressed this question (Lindeboom 2005a). There was no evidence that use of preoperative antibiotics reduced the incidence of postoperative infection after four weeks compared with placebo, as shown in Analysis 3.1 (RR 0.49, 95% CI 0.09 to 2.64).
4. Magnification devices: surgical microscope versus endoscope versus surgical loupes (one trial, 98 participants/150 teeth)
One study at high risk of bias addressed whether use of magnification devices could bring advantages in clinical and radiographic healing up to two years of follow‐up (Taschieri 2008). Results of this three‐arm trial were presented in two articles ‐ one reporting the comparison between surgical loupes and endoscope, after one‐year of follow‐up, and the other reporting the comparison between surgical microscope and endoscope, at two years of follow‐up. Both analyses were tooth‐based and showed no evidence of a difference in healing with one or the other magnification device, as shown in Analysis 4.1 (loupes versus endoscope on 71 teeth followed up to one year (RR 1.05, 95% CI 0.92 to 1.20)) and Analysis 4.2 (microscope versus endoscope on 100 teeth followed up to two years (RR 1.01, 95% CI 0.89 to 1.15)).
5. Incision type (two trials, 52 participants)
Two studies addressed the question of whether the type of incision could lead to better results in terms of aesthetics or postoperative quality of life.
One split‐mouth study at high risk of bias evaluated the height of interdental papilla after papilla base incision (PBI) versus complete papilla mobilisation techniques (Velvart 2004) at follow‐up of one year (12 participants). Results show weak evidence of a lower papilla height reduction with the PBI technique as compared with complete papilla mobilisation after one year (Analysis 5.1; mean difference (MD) ‐1.04, 95% CI ‐2.10 to 0.02).
The other study (Del Fabbro 2009), which was at unclear risk of bias, had a parallel design and evaluated pain and postoperative symptoms in participants undergoing PBI versus sulcular incision (complete papilla mobilisation) with follow‐up of one week (38 participants). Results showed no evidence of a difference in reported pain on a VAS scale at day one (Analysis 5.2; MD ‐2.25, 95% CI ‐7.17 to 2.67; P = 0.37) or day two (MD ‐1.50, 95% CI ‐6.34 to 3.34; P = 0.54). On the other hand, there was evidence of less pain in the PBI group than in the sulcular incision group at day 3 (MD ‐22.00, 95% CI ‐26.81 to ‐17.19; P < 0.00001).
6. Ultrasonic device versus conventional bur for root‐end preparation (one trial, 290 participants)
One study at high risk of bias addressed this question, evaluating treatment success at one‐year follow‐up (De Lange 2007). Use of ultrasonic devices for root‐end preparation provided weak evidence of an advantage when compared with the traditional bur, as shown by Analysis 6.1 (RR 1.14, 95% CI 1.00 to 1.30). This study adopted the radiographic evaluation criteria of Rud 1972. See Figure 5.
7. Root‐end filling material (seven trials, 846 participants)
Seven studies each compared two different materials for root‐end filling.
MTA (mineral trioxide aggregate) versus IRM (intermediate restorative material) was evaluated by two studies that involved 222 participants (Chong 2003; Lindeboom 2005b). After one‐year follow‐up, there was no evidence of a difference between groups in clinical and radiographic success, as shown in Analysis 7.1 (RR 1.09, 95% CI 0.97 to 1.21). There was no heterogeneity between the two studies' results (P value = 0.72). Only one study provided healing outcomes at two‐year follow‐up (Chong 2003), showing no evidence of a difference between groups, as shown in Analysis 7.2 (RR 1.05, 95% CI 0.92 to 1.20; P = 0.45).
Only one study evaluated postoperative pain (Chong 2003). The comparison up to two days post surgery was based on the proportion of participants experiencing postoperative pain and found no evidence of a difference at one day (RR 0.99, 95% CI 0.82 to 1.19; P = 0.88) or at two days (RR 1.06, 95% CI 0.83 to 1.36; P = 0.62) (Analysis 7.3).
MTA versus SuperEBA was evaluated by one study that involved 192 participants (Song 2012). After one‐year follow‐up, there was no evidence of a difference in clinical and radiographic success, as shown in Analysis 7.4 (RR 0.97, 95% CI 0.91 to 1.04).
MTA versus gutta‐percha smoothing was evaluated by one study at high risk of bias that involved 44 participants (Christiansen 2009). . There was evidence of better healing when the root‐end was filled with MTA as compared with treatment of the root‐end by smoothing of the orthograde GP root filling, after one‐year follow‐up, as shown in Analysis 7.5 (RR 1.60, 95% CI 1.14 to 2.24).
The study assessed postoperative pain using a VAS scale and showed no evidence of a difference in pain evaluated at one day (MD ‐4.00, 95% CI ‐16.69 to 8.69; P = 0.54), 2 days (MD 2.00, 95% CI ‐6.22 to 10.22; P = 0.63) and three days post surgery (MD 5.00, 95% CI ‐4.37 to 14.37; P = 0.30), as shown in Analysis 7.6.
Glass ionomer cement versus amalgam was evaluated in one study a high risk of bias that involved 85 participants/105 teeth (Zetterqvist 1991); the analysis was tooth‐based. After one‐year follow‐up, there was no evidence of a difference in clinical and radiographic success (P = 0.78), as shown in Analysis 7.7 (RR 0.98, 95% CI 0.86 to 1.12). After five years of follow‐up, some participants dropped out and the population was reduced to 64 participants/67 teeth. Results showed no evidence of a difference in clinical and radiographic success at the five‐year follow‐up (P = 1.00), as shown in Analysis 7.8 (RR 1.00, 95% CI 0.84 to 1.20).
IRM versus gutta‐percha was evaluated by one study at high risk of bias that involved 139 participants/160 teeth (Walivaara 2009); 147 teeth in 131 participants were evaluated at the one‐year follow‐up. Fractured teeth at one‐year follow‐up (three in the IRM group and one in the gutta‐percha group) were considered as failures instead of being excluded as in the Walivaara 2011 study. After one‐year follow‐up, results showed no evidence of a difference in clinical and radiographic success (P = 0.22) between the two groups, as shown in Analysis 7.9 (RR 0.92, 95% CI 0.80 to 1.05).
IRM versus SuperEBA was evaluated by one study at high risk of bias that involved 164 participants/206 teeth (Walivaara 2011); 194 teeth in 153 participants were assessed at the one‐year follow‐up. After one‐year follow‐up, in spite of a tendency in favour of IRM group, there was no clear evidence of a difference in clinical and radiographic success, as shown in Analysis 7.10 (RR 1.11, 95% CI 0.99 to 1.24; P = 0.07).
8. Grafting versus no grafting (four trials, 106 participants)
One study at unclear risk of bias that involved 18 participants/18 teeth evaluated calcium sulphate versus no grafting (Pecora 2001). After one‐year follow‐up, there was no evidence of better healing when calcium sulphate was used (P = 0.46), as shown in Analysis 8.1 (RR 1.12, 95% CI 0.83 to 1.50).
One study at high risk of bias (Taschieri 2007), which involved 41 participants/59 teeth, assessed guided tissue regeneration (GTR) using bovine bone mineral and resorbable collagen membrane versus no GTR. The analysis was tooth‐based. After one‐year follow‐up, results showed no evidence of better healing when GTR was used (P = 0.39), as shown in Analysis 8.2 (RR 1.12, 95% CI 0.86 to 1.46).
Plasma rich in growth factors (PRGF) versus no grafting was evaluated in one study at high risk of bias (Del Fabbro 2012), which assessed postoperative pain and symptoms up to one week in 36 participants. There was evidence of less pain among participants treated with the adjunct of PRGF, as shown in Analysis 8.3 (one day: MD ‐51.60, 95% CI ‐63.43 to ‐39.77; P < 0.001; two days: MD ‐41.70, 95% CI ‐52.09 to ‐31.31; P < 0.001; three days: MD ‐45.00, 95% CI ‐59.7 to ‐30.29; P < 0.001).
Platelet‐rich fibrin versus no grafting was evaluated in one study at high risk of bias (Angerame 2015), which assessed radiographic healing up to one year after surgery, pain and swelling up to seven days postoperatively, and the occurrence of complications such as sinus tract apicomarginal communication and infection with tenderness to palpation or percussion. This study claimed to be preliminary and had a small sample size (only seven participants in the test group and four in the control group), which prevented a robust analysis. Study authors reported that after one‐year follow‐up, they found no significant difference in healing of the lesion between test and control groups, and they were able to observe a significant difference only at two‐month and three‐month follow‐up. The article included no report of complications, and the study authors replied that none occurred throughout the observation period. Pain was not assessed by means of a VAS scale, so we could not compare these findings with those of other studies. Pain was reported to be significantly less among participants treated with PRF adjunct at two time points only, two and six hours after surgery. Swelling was reported to be significantly less in the PRF group up to five days postoperatively.
9. Low energy level laser therapy (LLLT) versus placebo versus control (one study, 72 participants)
One study at high risk of bias evaluated the effects of LLLT irradiation performed intraoperatively at one, three and seven days after surgery (Payer 2005). There was no evidence of a difference between participants treated with LLLT and those in the placebo group (irradiation without laser activation) or control group (no use of the laser device) in terms of swelling, wound healing and pain, as evaluated at one, three and seven days post surgery. Pain evaluated by VAS (0 to 100 scale) and a numerical rating scale (NRS; 1 to 10 scale) was reported only in graphic form, and study authors were not able to provide actual means and standard deviations to allow a quantitative evaluation. Pain evaluated by a verbal rating scale (VRS; scored as no pain or slight, moderate, strong and very strong pain) represented the maximum pain levels experienced by participants in the first postoperative week. In all cases, maximum pain occurred on the first day after surgery (Payer 2005). For this analysis, we aggregated data from "moderate" + "minor" scores (low pain) and from "strong" and "very strong" scores (high pain) and considered the latter as events in Analysis 9.1 (LLLT versus control: RR 0.04, 95% CI 0.00 to 0.71; placebo versus control: RR 0.04, 95% CI 0.00 to 0.61).
Discussion
Summary of main results
We performed this review to update a previous Cochrane review, published in 2007 (Del Fabbro 2007), which addressed the comparison between surgical and root canal retreatment for periapical lesions. The present version expanded the initial aim to include an evaluation of different aspects of surgical root canal treatment.
We identified two studies that compared a surgical and a non‐surgical approach, both of which were included in the previous version of this review. Thomas Kvist, the author of the study with four‐year follow‐up (Kvist 1999), kindly provided us with results of treatment after 10 years of follow‐up. These results indicate the absence of a difference between the two groups.
We identified 18 studies comparing different surgical approaches.
One study evaluated the importance of modern radiographic diagnostic tools in the preoperative phase, finding no significant advantage of using preoperative CBCT instead of periapical radiographs in terms of healing of the lesion after one‐year follow‐up (Kurt 2014).
One study evaluated the value of antibiotic prophylaxis for reducing postoperative infection in a cohort of 256 participants up to four weeks post surgery, but found no evidence of a difference between groups for the incidence of infective episodes (Lindeboom 2005a).
Two studies addressed the hypothesis that a minimally invasive incision like the papilla base incision (PBI) could have beneficial results in root‐end resection as compared with a traditional flap (complete papilla mobilisation). One parallel‐design study found that the PBI led to reduced postoperative pain and discomfort (Del Fabbro 2009). The other study, which used a split‐mouth design (Velvart 2004), found inconclusive evidence that PBI produced a better aesthetic outcome in terms of interdental papilla height after one year of healing. Both of these trials had a limited sample size, and their suggested benefits need to be confirmed by further evidence.
The benefit of magnification devices was explored in a three‐arm trial that, unfortunately, did not include a control group without magnification (Taschieri 2008). Therefore, the true efficacy of a given magnification device could not be evaluated. The only conclusion of this tooth‐based study was that there is no evidence of a difference in healing of the lesion after one year or after two years, using microscope, endoscope or loupes during the surgical procedure. Technical and practical advantages of magnification devices in enhancing the view of the surgical field and consequently improving precision and surgeon comfort during the operation have been claimed often but never quantified.
One trial evaluated use of an ultrasonic device versus a conventional handpiece bur for root‐end preparation (De Lange 2007). The analysis showed inconclusive evidence of an advantage of the ultrasonic device, supporting the benefits claimed for this technology for bone surgery and many surgical applications in the oral field.
Seven of the included trials compared different retro‐filling materials, evaluating healing after one year (Christiansen 2009; Lindeboom 2005b; Song 2012; Walivaara 2009; Walivaara 2011) or longer (Chong 2003; Zetterqvist 1991). Two of these studies also assessed postoperative pain and symptoms (Chong 2003; Christiansen 2009). Only one comparison showed evidence of a difference between groups in terms of periapical healing at one year, with the group having root‐end filled with mineral trioxide aggregate (MTA) displaying better results than the group treated with gutta‐percha (Christiansen 2009). The other six studies showed no evidence of differences in outcomes between materials tested, suggesting that the effect of root‐end filling material per se might be considered of minor importance to the success of retreatment. It should be noted that the type of material used in filling the retrograde cavity did not represent the only difference in the protocols adopted for root‐end resection in these seven studies. For example, in Zetterqvist 1991, investigators used a traditional technique, without magnification devices and with an inverted cone bur in preparing the retrograde cavity. The other studies adopted a modern technique, with microsurgical ultrasonic instruments for retrograde cavity preparation; investigators used a surgical microscope (Chong 2003; Christiansen 2009; Song 2012) or loupes (Lindeboom 2005b; Walivaara 2009; Walivaara 2011) to enhance root‐end visualisation.
Another question in endodontic surgery is whether filling the periapical lesion with a graft material improves healing of the lesion. Four studies addressed this question, but their protocols were too different to allow meta‐analysis. Pecora 2001 found no evidence of benefit derived from grafting the lesion with calcium sulphate when evaluating healing of the lesion after one‐year follow‐up. Taschieri 2007 failed to demonstrate evidence of an advantage of guided tissue regeneration (GTR) for the treatment of large periapical lesions of strict endodontic origin. Del Fabbro 2012 found evidence of a benefit of plasma rich in growth factors in reducing postoperative pain during the first three days after surgery. Unfortunately, no data are currently available regarding healing of the lesion at one‐year follow‐up, thereby preventing any comparison with other studies evaluating the effects of grafting the lesion. Angerame 2015 reported a significant benefit of platelet‐rich fibrin in reducing both postoperative pain and swelling. The study reported significantly better healing of the lesion two and three months after surgery but not at 12‐month follow‐up. This preliminary study had a very small sample size, so results should be interpreted cautiously.
One study addressed the efficacy of low energy level laser therapy (LLLT) for reducing postoperative pain and swelling in root‐end resection, showing no evidence of differences in outcomes between LLLT and placebo (irradiation without laser activation), although both caused less pain as compared with the control (without use of the laser device) (Payer 2005). This suggests that LLLT is ineffective in preventing postoperative pain and confirms the importance of the placebo group for outcomes based on subjective evaluation.
Overall completeness and applicability of evidence
Most studies were performed in university clinics or in non‐academic specialised clinical centres, by experienced operators. Therefore, generalisation of results from the present review to different clinical settings, such as general daily practice, should be made with caution. Studies comparing the same interventions were insufficient to enable robust conclusions to be drawn via meta‐analysis. We found several indications of possible advantages of some procedures or materials over others, but no definitive evidence for almost any of the topics addressed.
In most cases, outcomes were restricted to the one‐year follow‐up period. Although this does allow comparison of results from different studies after the same observation period, it does not consider the fact that in surgical procedures, risk of emerging post‐treatment disease might increase over time. This fact was underlined only by Kvist 1999, which reported relapses in four surgically treated participants at between one and four years of follow‐up, but no recurrence for participants who underwent root canal retreatment. Thus, outcomes at one year may not actually reflect the longer‐term outcomes of which both clinicians and patients need to be aware.
Quality of the evidence
Most of the studies included in this review provided data on assessment of the primary outcome of this review, that is, they investigated the efficacy of different endodontic surgical protocols by performing clinical and radiographic evaluations of healing of periapical pathosis after at least one year of follow‐up. Other outcomes addressed were the effects of different surgical protocols on postoperative pain and symptoms. The quality of the available evidence quality is low to very low. The risk of bias in most of the included studies was unclear, with most possible sources of bias due to lack of allocation concealment and blinding of operators, participants and evaluators, especially in Walivaara 2009, Walivaara 2011 and Zetterqvist 1991, which also omitted most information regarding the source of funding, the characteristics of participants, the teeth and the lesions. Zetterqvist 1991 had a dropout rate higher than 20% at five‐year follow‐up, thereby reducing the statistical power of the analysis and the robustness of the outcomes provided. Furthermore, in these three studies, some participants had more than one tooth treated and data were provided with only the tooth ‐ not the participant ‐ considered as the analysis unit. Finally, in the two studies by Walivaara (Walivaara 2009; Walivaara 2011), investigators reported no specific follow‐up time, but they followed teeth for at least 12 months, in a range between 12 and 38 months (Walivaara 2009) and 12 to 21 months (Walivaara 2011). This raises some concerns about the way these trials were conducted and the reliability of results reported by these investigators.
The size of the lesion, which is an important parameter often correlated with the likelihood of healing, was not the same across all included studies, ranging from smaller than 5 mm (small lesions) to larger than 10 mm (large lesions), and nine out of 20 included studies did not even report the lesion size (Angerame 2015; Chong 2003; Christiansen 2009; De Lange 2007; Kurt 2014; Song 2012; Velvart 2004; Walivaara 2009; Zetterqvist 1991). This could be a concern when the trials are compared.
Sample size was variable among studies, ranging from 11 participants (Angerame 2015) to 260 participants (Song 2012). Only eight out of 19 studies reported a sample size calculation, and in most cases, the sample size appeared underpowered to detect a significant difference.
Potential biases in the review process
This review did not consider studies performed with the traditional root‐end resection technique (e.g. Kvist 1999; Zetterqvist 1991) separately from studies performed using a modern root‐end resection technique, which represent the majority of included trials. This means that potentially important differences in the protocols might not be fully accounted for. Indeed, several studies sought to compare specific aspects of the traditional technique versus the modern one, but in general, standardisation among these studies was poor, which might hinder any comparison and limit the precision of the success estimate.
Some authors of the present review (MDF, ST) are also among the authors of some of the included studies (Del Fabbro 2009; Del Fabbro 2012; Taschieri 2007; Taschieri 2008). We addressed this bias by excluding these authors from any evaluation concerning the studies in which they were involved.
Furthermore, some of the parameters accounted for are patient‐based outcomes, such as pain, aesthetics and satisfaction, which are subjective. The individual judgement of patients may depend on factors such as their expectations and their previous experience. However, as we found no clear evidence suggesting that apical periodontitis is a life‐threatening disease, such patient‐based outcomes may represent a sensible contribution to assessment of treatment success.
Agreements and disagreements with other studies or reviews
Other systematic reviews and meta‐analyses have addressed some aspects of root‐end resection, such as outcomes of modern techniques (Tsesis 2009; Tsesis 2013), comparison of traditional root‐end surgery and root‐end microsurgery (Setzer 2010), effects of using guided tissue regeneration (Tsesis 2011), use of regenerative techniques (Von Arx 2011), comparison of root‐end microsurgery with and without the use of higher magnification (Setzer 2012) and factors affecting prognosis (Von Arx 2010b). However, because the findings of these reviews were not based on the most reliable clinical studies owing to less restrictive inclusion criteria with respect to the present review, direct comparison with the present findings could be inappropriate and difficult to interpret.
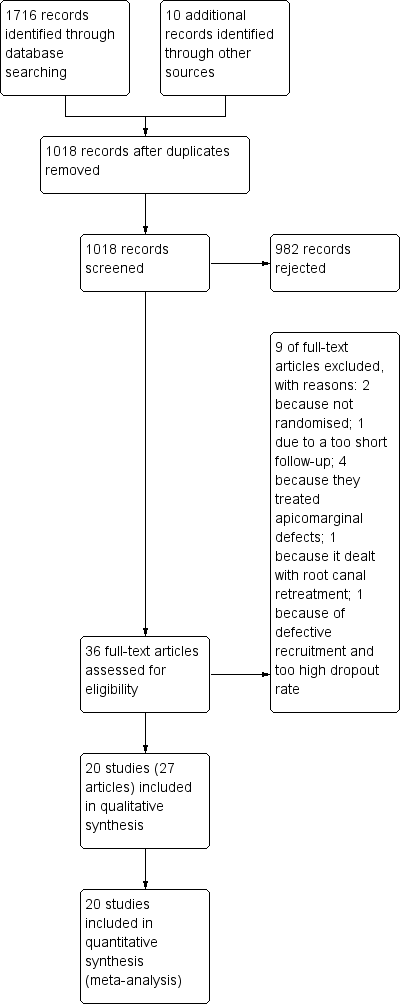
Study flow diagram
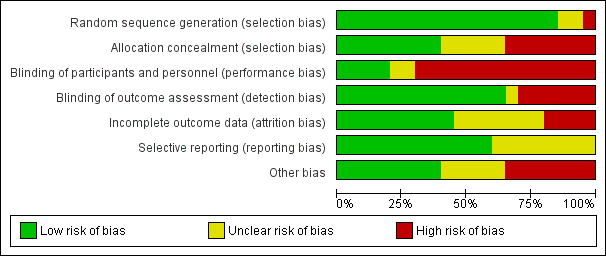
Risk of bias graph: review authors' judgements about each risk of bias item presented as percentages across all included studies

Risk of bias summary: review authors' judgements about each risk of bias item for each included study
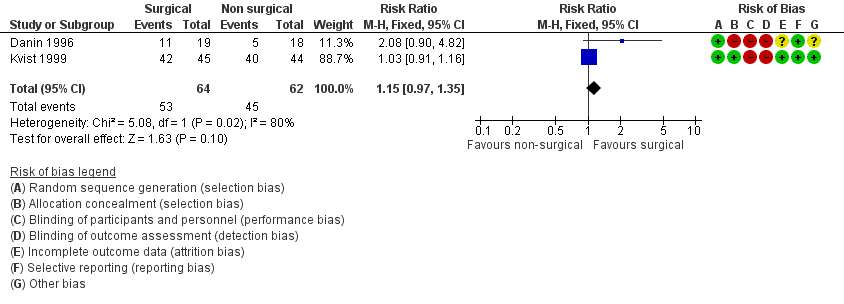
Forest plot of comparison: 1 Root‐end resection versus root canal retreatment, outcome: 1.1 Healing ‐ one year
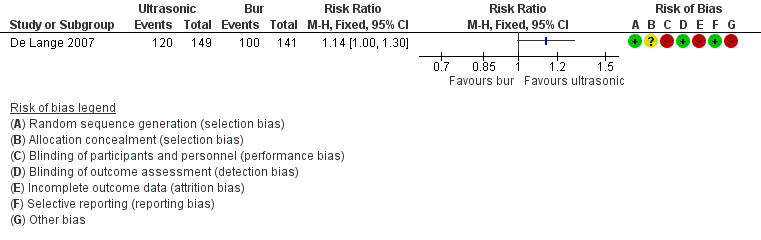
Forest plot of comparison: 6 Ultrasonic versus Bur, outcome: 6.1 Healing ‐ one year

Comparison 1 Root‐end resection versus root canal retreatment, Outcome 1 Healing ‐ 1 year.
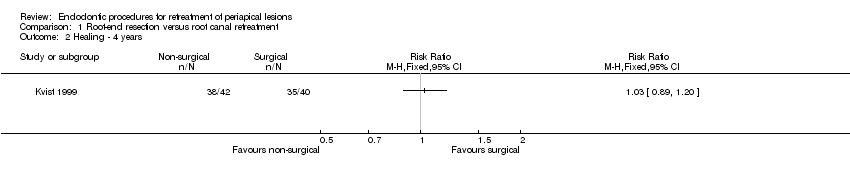
Comparison 1 Root‐end resection versus root canal retreatment, Outcome 2 Healing ‐ 4 years.

Comparison 1 Root‐end resection versus root canal retreatment, Outcome 3 Healing ‐ 10 years.

Comparison 1 Root‐end resection versus root canal retreatment, Outcome 4 Participants reporting pain.
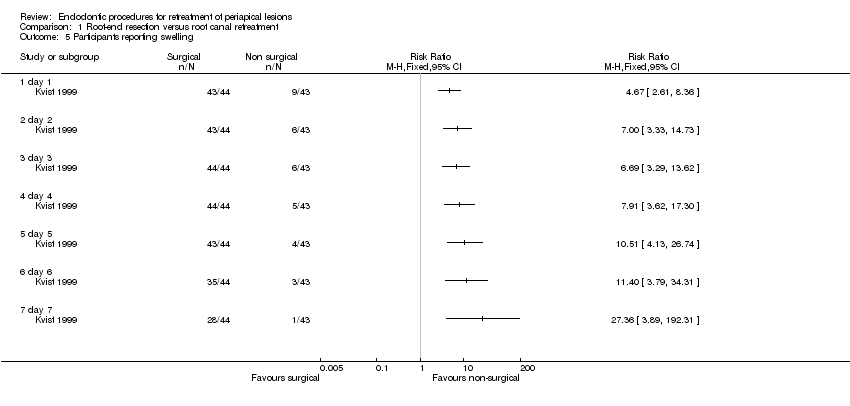
Comparison 1 Root‐end resection versus root canal retreatment, Outcome 5 Participants reporting swelling.
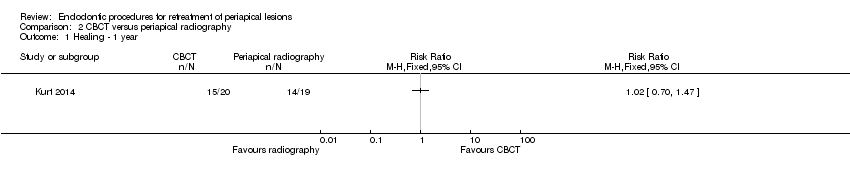
Comparison 2 CBCT versus periapical radiography, Outcome 1 Healing ‐ 1 year.
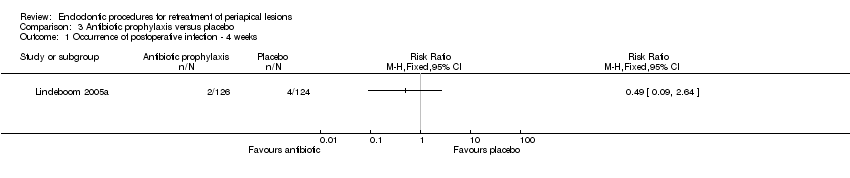
Comparison 3 Antibiotic prophylaxis versus placebo, Outcome 1 Occurrence of postoperative infection ‐ 4 weeks.

Comparison 4 Magnification devices, Outcome 1 Loupes versus endoscope ‐ healing at 1 year.

Comparison 4 Magnification devices, Outcome 2 Microscope versus endoscope ‐ healing at 2 years.

Comparison 5 Type of incision, Outcome 1 PBI versus complete mobilisation ‐ papilla height.
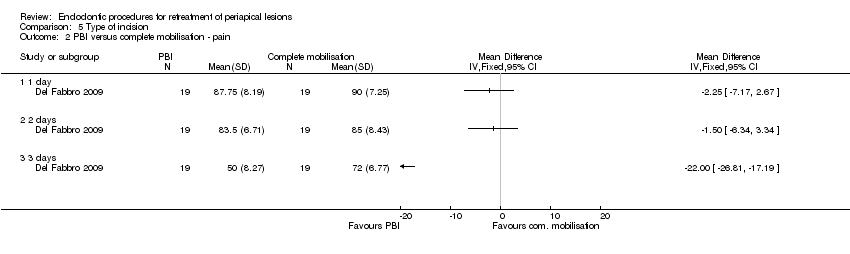
Comparison 5 Type of incision, Outcome 2 PBI versus complete mobilisation ‐ pain.

Comparison 6 Ultrasonic versus bur, Outcome 1 Healing ‐ 1 year.

Comparison 7 Root‐end filling material, Outcome 1 MTA versus IRM ‐ healing at 1 year.

Comparison 7 Root‐end filling material, Outcome 2 MTA versus IRM ‐ healing at 2 years.

Comparison 7 Root‐end filling material, Outcome 3 MTA versus IRM ‐ pain.
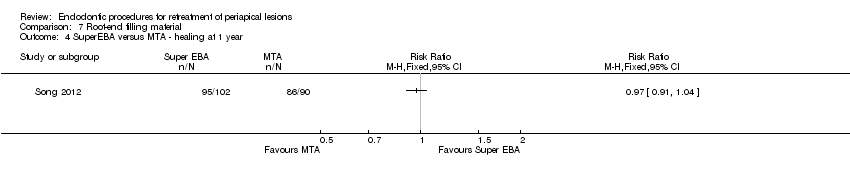
Comparison 7 Root‐end filling material, Outcome 4 SuperEBA versus MTA ‐ healing at 1 year.

Comparison 7 Root‐end filling material, Outcome 5 MTA versus gutta‐percha ‐ healing at 1 year.
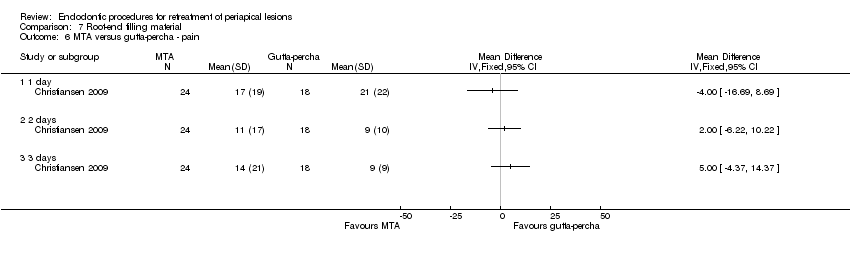
Comparison 7 Root‐end filling material, Outcome 6 MTA versus gutta‐percha ‐ pain.

Comparison 7 Root‐end filling material, Outcome 7 Glass ionomer cement (GIC) vs amalgam ‐ healing at 1 year.

Comparison 7 Root‐end filling material, Outcome 8 Glass ionomer cement (GIC) vs amalgam ‐ healing at 5 years.

Comparison 7 Root‐end filling material, Outcome 9 IRM vs Gutta‐percha ‐ healing > 1 year.
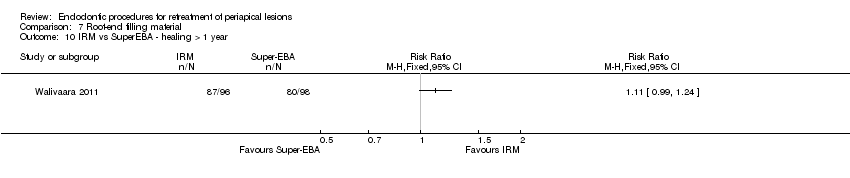
Comparison 7 Root‐end filling material, Outcome 10 IRM vs SuperEBA ‐ healing > 1 year.

Comparison 8 Grafting versus no grafting, Outcome 1 Calcium sulphate (CaS) versus no grafting ‐ healing at 1 year.

Comparison 8 Grafting versus no grafting, Outcome 2 GTR with bovine bone vs no grafting ‐ healing at 1 year ‐ TB.

Comparison 8 Grafting versus no grafting, Outcome 3 PRGF versus no grafting ‐ pain (VAS).
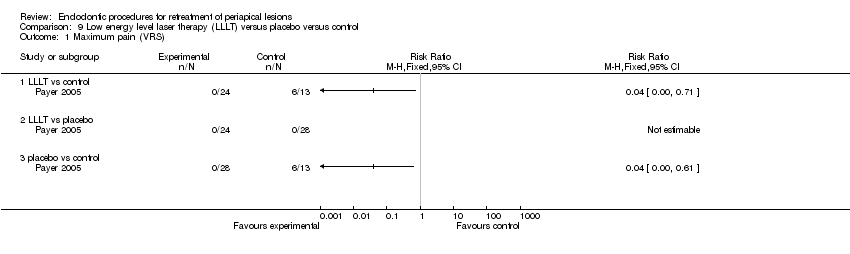
Comparison 9 Low energy level laser therapy (LLLT) versus placebo versus control, Outcome 1 Maximum pain (VRS).
| Root‐end resection versus root canal retreatment | ||||||
| Patient or population: people requiring retreatment of periapical lesions Comparison: root canal retreatment | ||||||
| Outcomes | Anticipated absolute effects* (95% CI) | Relative effect | Number of participants | Quality of the evidence | Comments | |
| Risk with root canal retreatment | Risk with root‐end resection and filling | |||||
| Healing ‐ 1 year | 726 per 1000 | 835 per 1000 | RR 1.15 | 126 | ⊕⊝⊝⊝ | RR after 4 years was 1.03 (0.89 to 1.20) (1 study, 82 participants) RR after 10 years was 1.11 (0.88 to 1.41) (1 study, 95 participants) |
| Pain assessed with visual analogue scale (VAS) from 0 to 100 ‐ 1 day | Not assessed | |||||
| Prevalence of pain ‐ 1 day | 279 out of 1000 | 932 out of 1000 (572 to 1515) | RR 3.34 (2.05 to 5.43) | 87 (1 study) | ⊕⊕⊝⊝ | Number of participants reporting pain each day in the first postoperative week was significantly higher in the surgical group than in the non‐surgical group. |
| Occurrence of postoperative infection ‐ 4 weeks | Not assessed | |||||
| Height loss of interdental papilla | Not assessed | |||||
| Maximum pain assessed with verbal rating scale (VRS) | Not assessed | |||||
| *The risk in the intervention group (and its 95% confidence interval) is based on the assumed risk in the comparison group and the relative effect of the intervention (and its 95% CI). | ||||||
| GRADE Working Group grades of evidence | ||||||
| aQuality of evidence was downgraded owing to heterogeneity (inconsistency). bQuality of evidence was downgraded owing to imprecision (CI includes RR of 1.0). cQuality of evidence was downgraded because both studies had high risk of bias. dQuality of evidence was downgraded because it was based on a single small study at high risk of bias. | ||||||
| CBCT versus periapical radiography | ||||||
| Patient or population: people requiring retreatment of periapical lesions | ||||||
| Outcomes | Anticipated absolute effects* (95% CI) | Relative effect | Number of participants | Quality of the evidence | Comments | |
| Risk with periapical radiography | Risk with CBCT | |||||
| Healing ‐ 1 year | 737 per 1000 | 752 per 1000 | RR 1.02 | 39 | ⊕⊝⊝⊝ | |
| Pain assessed with visual analogue scale (VAS) from 0 to 100 ‐ 1 day | Not assessed | |||||
| Prevalence of pain ‐ 1 day | Not assessed | |||||
| Occurrence of postoperative infection ‐ 4 weeks | Not assessed | |||||
| Height loss of interdental papilla | Not assessed | |||||
| Maximum pain assessed with verbal rating scale (VRS) | Not assessed | |||||
| *The risk in the intervention group (and its 95% confidence interval) is based on the assumed risk in the comparison group and the relative effect of the intervention (and its 95% CI). | ||||||
| GRADE Working Group grades of evidence | ||||||
| aQuality of evidence was downgraded because it was derived from a single study at high risk of bias with imprecise results. | ||||||
| Preoperative antibiotic prophylaxis versus placebo | ||||||
| Patient or population: people requiring retreatment of periapical lesions | ||||||
| Outcomes | Anticipated absolute effects* (95% CI) | Relative effect | Number of participants | Quality of the evidence | Comments | |
| Risk with placebo | Risk with antibiotic prophylaxis | |||||
| Healing ‐ 1 year | Not assessed | |||||
| Pain assessed with visual analogue scale (VAS) from 0 to 100 ‐ 1 day | Not assessed | |||||
| Prevalence of pain ‐ 1 day | Not assessed | |||||
| Occurrence of postoperative infection ‐ 4 weeks | 32 per 1000 | 16 per 1000 | RR 0.49 | 250 | ⊕⊝⊝⊝ | |
| Height loss of interdental papilla | Not assessed | |||||
| Maximum pain assessed with verbal rating scale (VRS) | Not assessed | |||||
| *The risk in the intervention group (and its 95% confidence interval) is based on the assumed risk in the comparison group and the relative effect of the intervention (and its 95% CI). | ||||||
| GRADE Working Group grades of evidence | ||||||
| aQuality of evidence was downgraded because it was derived from a single study at unclear risk of bias with very imprecise results. | ||||||
| Different types of magnification devices | ||||||
| Patient or population: people requiring retreatment of periapical lesions | ||||||
| Outcomes | Anticipated absolute effects* (95% CI) | Relative effect | Number of participants | Quality of the evidence | Comments | |
| Risk with loupes or microscope | Risk with endoscope | |||||
| Loupes vs endoscope ‐ healing at 1 year | 906 per 1000 | 952 per 1000 | RR 1.05 | 62 (71 teeth) | ⊕⊕⊝⊝ | |
| Microscope vs endoscope ‐ healing at 2 years | 902 per 1000 | 911 per 1000 | RR 1.01 | 70 (100 teeth) | ⊕⊕⊝⊝ | |
| Pain assessed with visual analogue scale (VAS) from 0 to 100 ‐ 1 day | Not assessed | |||||
| Prevalence of pain ‐ 1 day | Not assessed | |||||
| Occurrence of postoperative infection ‐ 4 weeks | Not assessed | |||||
| Height loss of interdental papilla | Not assessed | |||||
| Maximum pain assessed with verbal rating scale (VRS) | Not assessed | |||||
| *The risk in the intervention group (and its 95% confidence interval) is based on the assumed risk in the comparison group and the relative effect of the intervention (and its 95% CI). | ||||||
| GRADE Working Group grades of evidence | ||||||
| aQuality of evidence was downgraded because it was derived from a single study at high risk of bias. | ||||||
| Papilla base incision (PBI) versus complete mobilisation | ||||||
| Patient or population: people requiring retreatment of periapical lesions | ||||||
| Outcomes | Anticipated absolute effects* (95% CI) | Relative effect | Number of participants | Quality of the evidence | Comments | |
| Risk with complete mobilisation | Risk with PBI | |||||
| Healing ‐ 1 year | Not assessed | |||||
| Pain assessed with visual analogue scale (VAS) from 0 to 100 ‐ 1 day | Mean pain was 90 mm | Mean pain in the intervention group was 2.25 lower (7.17 lower to 2.67 higher). | ‐ | 38 | ⊕⊝⊝⊝ | |
| Prevalence of pain ‐ 1 day | Not assessed | |||||
| Occurrence of postoperative infection ‐ 4 weeks | Not assessed | |||||
| Height loss of interdental papilla ‐ 1 year | Mean height loss of interdental papilla was 0.98 mm. | Mean height loss of interdental papilla in the intervention group was 1.04 mm lower (1.48 lower to 0.60 lower). | ‐ | 12 | ⊕⊝⊝⊝ | |
| Maximum pain assessed with verbal rating scale (VRS) | Not assessed | |||||
| *The risk in the intervention group (and its 95% confidence interval) is based on the assumed risk in the comparison group and the relative effect of the intervention (and its 95% CI). | ||||||
| GRADE Working Group grades of evidence | ||||||
| aQuality of evidence was downgraded because it was derived from a single small study at unclear risk of bias with very imprecise results. bQuality of evidence was downgraded because it was derived from one small split‐mouth study at high risk of bias. | ||||||
| Ultrasonic instruments versus bur | ||||||
| Patient or population: people requiring retreatment of periapical lesions | ||||||
| Outcomes | Anticipated absolute effects* (95% CI) | Relative effect | Number of participants | Quality of the evidence | Comments | |
| Risk with bur | Risk with ultrasonic | |||||
| Healing ‐ 1 year | 709 per 1000 | 809 per 1000 | RR 1.14 | 290 | ⊕⊕⊝⊝ | There was inconclusive evidence that use of ultrasonic devices could produce a better success rate after 1‐year follow‐up. |
| Pain assessed with visual analogue scale (VAS) from 0 to 100 ‐ 1 day | Not assessed | |||||
| Prevalence of pain ‐ 1 day | Not assessed | |||||
| Occurrence of postoperative infection ‐ 4 weeks | Not assessed | |||||
| Height loss of interdental papilla | Not assessed | |||||
| Maximum pain assessed with verbal rating scale (VRS) | Not assessed | |||||
| *The risk in the intervention group (and its 95% confidence interval) is based on the assumed risk in the comparison group and the relative effect of the intervention (and its 95% CI). | ||||||
| GRADE Working Group grades of evidence | ||||||
| aQuality of evidence downgraded because it was derived from one study at high risk of bias (attrition bias). | ||||||
| Different types of root end fillings | ||||||
| Patient or population: people requiring retreatment of periapical lesions Settings: university hospital | ||||||
| Outcomes | Illustrative comparative risks* (95% CI) | Relative effect | Number of Participants | Quality of the evidence | Comments | |
| Assumed risk | Corresponding risk | |||||
| Intermediate restorative material (IRM) | Mineral trioxide aggregate (MTA) | |||||
| Healing ‐ 1 year | 806 per 1000 | 878 per 1000 | RR 1.09 (0.97 to 1.21) | 222 | ⊕⊕⊝⊝ | RR after 2 years as computed on 108 participants (1 study) was 1.05 (95% CI 0.92 to 1.20). |
| Pain assessed with visual analogue scale (VAS) from 0 to 100 ‐ 1 day | Not assessed | |||||
| Prevalence of pain ‐ 1 day | 815 per 1000 | 823 per 1000 | RR 1.01 (0.84 to 1.22) | 100 | ⊕⊕⊝⊝ | RR after 2 days as computed on 100 participants (1 study) was 0.94 (95% CI 0.73 to 1.20). |
| Occurrence of postoperative infection ‐ 4 weeks | Not assessed | |||||
| Height loss of interdental papilla | Not assessed | |||||
| Maximum pain assessed with verbal rating scale (VRS) | Not assessed | |||||
| MTA | SuperEBA | |||||
| Healing ‐ 1 year | 956 per 1000 | 927 per 1000 | RR 0.97 (0.91 to 1.04) | 192 | ⊕⊕⊝⊝ | There was no evidence of a difference in success rate after 1‐year follow‐up when MTA or SuperEBA was used as root‐end filler. |
| Pain assessed with visual analogue scale (VAS) from 0 to 100 ‐ 1 day | Not assessed | |||||
| Prevalence of pain ‐ 1 day | Not assessed | |||||
| Occurrence of postoperative infection ‐ 4 weeks | Not assessed | |||||
| Height loss of interdental papilla | Not assessed | |||||
| Maximum pain assessed with verbal rating scale (VRS) | Not assessed | |||||
| Gutta‐percha | MTA | |||||
| Healing ‐ 1 year | 619 per 1000 | 990 per 1000 | RR 1.60 (1.14 to 2.24) | 46 (1 RCT) | ⊕⊕⊝⊝ | There was evidence of better healing rate after 1‐year follow‐up when MTA as compared with gutta‐percha was used. |
| Pain assessed with visual analogue scale (VAS) from 0 to 100 ‐ 1 day | Mean pain in the control group was 21. | Mean pain in the intervention groups was 4 units lower | 42 (1 RCT) | ⊕⊕⊝⊝ | After 2 days, mean difference in pain was 2.00 (‐6.22 to 10.22); after 3 days, mean difference in pain was 5.00 (‐4.37 to 14.37). | |
| Prevalence of pain ‐ 1 day | Not assessed | |||||
| Occurrence of postoperative infection ‐ 4 weeks | Not assessed | |||||
| Height loss of interdental papilla | Not assessed | |||||
| Maximum pain assessed with verbal rating scale (VRS) | Not assessed | |||||
| Amalgam | Glass ionomer cement | |||||
| Healing ‐ 1 year | 904 per 1000 | 886 per 1000 | RR 0.98 (0.86 to 1.12) | 105 (1 RCT) | ⊕⊝⊝⊝ | RR after 5 years as computed on 82 participants (1 study) was 1.00 (95% CI 0.84 to 1.20). |
| Pain assessed with visual analogue scale (VAS) from 0 to 100 ‐ 1 day | Not assessed | |||||
| Prevalence of pain ‐ 1 day | Not assessed | |||||
| Occurrence of postoperative infection ‐ 4 weeks | Not assessed | |||||
| Height loss of interdental papilla | Not assessed | |||||
| Maximum pain assessed with verbal rating scale (VRS) | Not assessed | |||||
| Gutta‐percha | IRM | |||||
| Healing ‐ 1 year (or longer) | 885 per 1000 | 814 per 1000 (708 to 929) | RR 0.92 (0.80 to 1.05) | 147 (1 RCT) | ⊕⊝⊝⊝ | There is no evidence of a difference in success rate after 1‐year follow‐up when gutta‐percha or IRM was used as root‐end filler. |
| Pain assessed with visual analogue scale (VAS) from 0 to 100 ‐ 1 day | Not assessed | |||||
| Prevalence of pain ‐ 1 day | Not assessed | |||||
| Occurrence of postoperative infection ‐ 4 weeks | Not assessed | |||||
| Height loss of interdental papilla | Not assessed | |||||
| Maximum pain assessed with verbal rating scale (VRS) | Not assessed | |||||
| IRM | SuperEBA | |||||
| Healing ‐ 1 year (or longer) | 816 per 1000 | 906 per 1000 (808 per 1000) | RR 1.11 (0.99 to 1.24) | 194 (1 RCT) | ⊕⊝⊝⊝ | There was no evidence of a difference in success rate after 1‐year follow‐up when SuperEBA or IRM was used as root‐end filler. |
| Pain assessed with visual analogue scale (VAS) from 0 to 100 ‐ 1 day | Not assessed | |||||
| Prevalence of pain ‐ 1 day | Not assessed | |||||
| Occurrence of postoperative infection ‐ 4 weeks | Not assessed | |||||
| Height loss of interdental papilla | Not assessed | |||||
| Maximum pain assessed with verbal rating scale (VRS) | Not assessed | |||||
| *The basis for the assumed risk (e.g. median control group risk across studies) is provided in footnotes. The corresponding risk (and its 95% confidence interval) is based on the assumed risk in the comparison group and the relative effect of the intervention (and its 95% CI). | ||||||
| GRADE Working Group grades of evidence | ||||||
| aQuality of evidence was downgraded owing to imprecision (CI includes RR of 1.0). bQuality of evidence was downgraded because one study had high risk of bias (attrition bias). cQuality of evidence was downgraded because it was based on a single study and because of imprecision. dQuality of evidence was downgraded because it was based on a single study that had high risk of bias. | ||||||
| Grafting versus no grafting | ||||||
| Patient or population: people requiring retreatment of periapical lesions Settings: university Intervention: grafting Control: no grafting | ||||||
| Outcomes | Illustrative comparative risks* (95% CI) | Relative effect | Number of participants | Quality of the evidence | Comments | |
| Assumed risk | Corresponding risk | |||||
| No grafting | Grafting | |||||
| Healing ‐ 1 year | Calcium sulphate | |||||
| 889 per 1000 | 996 per 1000 (738 per 1000) | RR 1.12 (0.83 to 1.50) | 18 (1 RCT) | ⊕⊕⊝⊝ | There was no evidence that grafting the periapical lesion with calcium sulphate may improve healing of the lesion after 1‐year follow‐up. | |
| GTR + Bovine bone | ||||||
| 743 per 1000 | 832 per 1000 (639 per 1000) | RR 1.12 (0.86 to 1.46) | 59 (1 RCT) | ⊕⊕⊝⊝ | There was no evidence that guided tissue regeneration improves healing of the lesion after 1‐year follow‐up. | |
| PRGF gel | ||||||
| Pain assessed with visual analogue scale (VAS) from 0 to 100 ‐ 1 day | Mean pain was 73.3. | Mean pain in the intervention group was 51.6 lower (63.43 lower to 39.77 lower). | ‐ | 36 (1 RCT) | ⊕⊕⊝⊝ | There was evidence that using plasma rich in growth factors may decrease postoperative pain in the early days after surgery. After 2 days, mean pain in the intervention group was 41.7 lower than in the control group (‐52.09 to ‐31.31); after 3 days, mean pain in the intervention group was 45 lower than in the control group (‐59.71 to ‐30.29). |
| Prevalence of pain ‐ 1 day | Not assessed | |||||
| Occurrence of postoperative infection ‐ 4 weeks | Not assessed | |||||
| Height loss of interdental papilla | Not assessed | |||||
| Maximum pain assessed with verbal rating scale (VRS) | Not assessed | |||||
| *The basis for the assumed risk (e.g. median control group risk across studies) is provided in footnotes. The corresponding risk (and its 95% confidence interval) is based on the assumed risk in the comparison group and the relative effect of the intervention (and its 95% CI). | ||||||
| GRADE Working Group grades of evidence | ||||||
| aQuality of evidence was downgraded two levels because it was based on a single study and because of imprecision. | ||||||
| Low energy level laser therapy compared with placebo for surgical retreatment of periapical lesions | ||||||
| Patient or population: people requiring retreatment of periapical lesions Control: placebo | ||||||
| Outcomes | Illustrative comparative risks* (95% CI) | Relative effect | Number of participants | Quality of the evidence | Comments | |
| Assumed risk | Corresponding risk | |||||
| Placebo | LLLT | |||||
| Healing ‐ 1 year | Not assessed | |||||
| Pain assessed with visual analogue scale (VAS) from 0 to 100 ‐ 1 day | Not assessed | |||||
| Prevalence of pain ‐ 1 day | Not assessed | |||||
| Occurrence of postoperative infection ‐ 4 weeks | Not assessed | |||||
| Height loss of interdental papilla ‐ 1 year | Not assessed | |||||
| Placebo | LLLT | |||||
| Maximum pain assessed with verbal rating scale (VRS) | 0 per 1000 | 0 per 1000 | Not estimable | 52 | ⊕⊝⊝⊝ | |
| Control | LLLT | |||||
| Maximum pain assessed with verbal rating scale (VRS) | 300 per 1000 | 0 per 1000 | Not estimable | 44 | ⊕⊝⊝⊝ | |
| *The basis for the assumed risk (e.g. median control group risk across studies) is provided in footnotes. The corresponding risk (and its 95% confidence interval) is based on the assumed risk in the comparison group and the relative effect of the intervention (and its 95% CI). | ||||||
| GRADE Working Group grades of evidence | ||||||
| aQuality of evidence was downgraded three levels because it is based on a single study at high risk of bias. | ||||||
| Outcome or subgroup title | No. of studies | No. of participants | Statistical method | Effect size |
| 1 Healing ‐ 1 year Show forest plot | 2 | 126 | Risk Ratio (M‐H, Fixed, 95% CI) | 1.15 [0.97, 1.35] |
| 2 Healing ‐ 4 years Show forest plot | 1 | Risk Ratio (M‐H, Fixed, 95% CI) | Totals not selected | |
| 3 Healing ‐ 10 years Show forest plot | 1 | Risk Ratio (M‐H, Fixed, 95% CI) | Totals not selected | |
| 4 Participants reporting pain Show forest plot | 1 | Risk Ratio (M‐H, Fixed, 95% CI) | Totals not selected | |
| 4.1 day 1 | 1 | Risk Ratio (M‐H, Fixed, 95% CI) | 0.0 [0.0, 0.0] | |
| 4.2 day 2 | 1 | Risk Ratio (M‐H, Fixed, 95% CI) | 0.0 [0.0, 0.0] | |
| 4.3 day 3 | 1 | Risk Ratio (M‐H, Fixed, 95% CI) | 0.0 [0.0, 0.0] | |
| 4.4 day 4 | 1 | Risk Ratio (M‐H, Fixed, 95% CI) | 0.0 [0.0, 0.0] | |
| 4.5 day 5 | 1 | Risk Ratio (M‐H, Fixed, 95% CI) | 0.0 [0.0, 0.0] | |
| 4.6 day 6 | 1 | Risk Ratio (M‐H, Fixed, 95% CI) | 0.0 [0.0, 0.0] | |
| 4.7 day 7 | 1 | Risk Ratio (M‐H, Fixed, 95% CI) | 0.0 [0.0, 0.0] | |
| 5 Participants reporting swelling Show forest plot | 1 | Risk Ratio (M‐H, Fixed, 95% CI) | Totals not selected | |
| 5.1 day 1 | 1 | Risk Ratio (M‐H, Fixed, 95% CI) | 0.0 [0.0, 0.0] | |
| 5.2 day 2 | 1 | Risk Ratio (M‐H, Fixed, 95% CI) | 0.0 [0.0, 0.0] | |
| 5.3 day 3 | 1 | Risk Ratio (M‐H, Fixed, 95% CI) | 0.0 [0.0, 0.0] | |
| 5.4 day 4 | 1 | Risk Ratio (M‐H, Fixed, 95% CI) | 0.0 [0.0, 0.0] | |
| 5.5 day 5 | 1 | Risk Ratio (M‐H, Fixed, 95% CI) | 0.0 [0.0, 0.0] | |
| 5.6 day 6 | 1 | Risk Ratio (M‐H, Fixed, 95% CI) | 0.0 [0.0, 0.0] | |
| 5.7 day 7 | 1 | Risk Ratio (M‐H, Fixed, 95% CI) | 0.0 [0.0, 0.0] | |
| Outcome or subgroup title | No. of studies | No. of participants | Statistical method | Effect size |
| 1 Healing ‐ 1 year Show forest plot | 1 | Risk Ratio (M‐H, Fixed, 95% CI) | Totals not selected | |
| Outcome or subgroup title | No. of studies | No. of participants | Statistical method | Effect size |
| 1 Occurrence of postoperative infection ‐ 4 weeks Show forest plot | 1 | Risk Ratio (M‐H, Fixed, 95% CI) | Totals not selected | |
| Outcome or subgroup title | No. of studies | No. of participants | Statistical method | Effect size |
| 1 Loupes versus endoscope ‐ healing at 1 year Show forest plot | 1 | Risk Ratio (M‐H, Fixed, 95% CI) | Totals not selected | |
| 2 Microscope versus endoscope ‐ healing at 2 years Show forest plot | 1 | Risk Ratio (M‐H, Fixed, 95% CI) | Totals not selected | |
| Outcome or subgroup title | No. of studies | No. of participants | Statistical method | Effect size |
| 1 PBI versus complete mobilisation ‐ papilla height Show forest plot | 1 | Mean Difference (Fixed, 95% CI) | Totals not selected | |
| 2 PBI versus complete mobilisation ‐ pain Show forest plot | 1 | Mean Difference (IV, Fixed, 95% CI) | Totals not selected | |
| 2.1 1 day | 1 | Mean Difference (IV, Fixed, 95% CI) | 0.0 [0.0, 0.0] | |
| 2.2 2 days | 1 | Mean Difference (IV, Fixed, 95% CI) | 0.0 [0.0, 0.0] | |
| 2.3 3 days | 1 | Mean Difference (IV, Fixed, 95% CI) | 0.0 [0.0, 0.0] | |
| Outcome or subgroup title | No. of studies | No. of participants | Statistical method | Effect size |
| 1 Healing ‐ 1 year Show forest plot | 1 | Risk Ratio (M‐H, Fixed, 95% CI) | Totals not selected | |
| Outcome or subgroup title | No. of studies | No. of participants | Statistical method | Effect size |
| 1 MTA versus IRM ‐ healing at 1 year Show forest plot | 2 | 222 | Risk Ratio (M‐H, Fixed, 95% CI) | 1.09 [0.97, 1.22] |
| 2 MTA versus IRM ‐ healing at 2 years Show forest plot | 1 | Risk Ratio (M‐H, Fixed, 95% CI) | Totals not selected | |
| 3 MTA versus IRM ‐ pain Show forest plot | 1 | Risk Ratio (M‐H, Fixed, 95% CI) | Totals not selected | |
| 3.1 1 day | 1 | Risk Ratio (M‐H, Fixed, 95% CI) | 0.0 [0.0, 0.0] | |
| 3.2 2 days | 1 | Risk Ratio (M‐H, Fixed, 95% CI) | 0.0 [0.0, 0.0] | |
| 4 SuperEBA versus MTA ‐ healing at 1 year Show forest plot | 1 | Risk Ratio (M‐H, Fixed, 95% CI) | Totals not selected | |
| 5 MTA versus gutta‐percha ‐ healing at 1 year Show forest plot | 1 | Risk Ratio (M‐H, Fixed, 95% CI) | Totals not selected | |
| 6 MTA versus gutta‐percha ‐ pain Show forest plot | 1 | Mean Difference (IV, Fixed, 95% CI) | Totals not selected | |
| 6.1 1 day | 1 | Mean Difference (IV, Fixed, 95% CI) | 0.0 [0.0, 0.0] | |
| 6.2 2 days | 1 | Mean Difference (IV, Fixed, 95% CI) | 0.0 [0.0, 0.0] | |
| 6.3 3 days | 1 | Mean Difference (IV, Fixed, 95% CI) | 0.0 [0.0, 0.0] | |
| 7 Glass ionomer cement (GIC) vs amalgam ‐ healing at 1 year Show forest plot | 1 | Risk Ratio (M‐H, Fixed, 95% CI) | Totals not selected | |
| 8 Glass ionomer cement (GIC) vs amalgam ‐ healing at 5 years Show forest plot | 1 | Risk Ratio (M‐H, Fixed, 95% CI) | Totals not selected | |
| 9 IRM vs Gutta‐percha ‐ healing > 1 year Show forest plot | 1 | Risk Ratio (M‐H, Fixed, 95% CI) | Totals not selected | |
| 10 IRM vs SuperEBA ‐ healing > 1 year Show forest plot | 1 | Risk Ratio (M‐H, Fixed, 95% CI) | Totals not selected | |
| Outcome or subgroup title | No. of studies | No. of participants | Statistical method | Effect size |
| 1 Calcium sulphate (CaS) versus no grafting ‐ healing at 1 year Show forest plot | 1 | Risk Ratio (M‐H, Fixed, 95% CI) | Totals not selected | |
| 2 GTR with bovine bone vs no grafting ‐ healing at 1 year ‐ TB Show forest plot | 1 | Risk Ratio (M‐H, Fixed, 95% CI) | Totals not selected | |
| 3 PRGF versus no grafting ‐ pain (VAS) Show forest plot | 1 | Mean Difference (IV, Fixed, 95% CI) | Totals not selected | |
| 3.1 1 day | 1 | Mean Difference (IV, Fixed, 95% CI) | 0.0 [0.0, 0.0] | |
| 3.2 2 days | 1 | Mean Difference (IV, Fixed, 95% CI) | 0.0 [0.0, 0.0] | |
| 3.3 3 days | 1 | Mean Difference (IV, Fixed, 95% CI) | 0.0 [0.0, 0.0] | |
| Outcome or subgroup title | No. of studies | No. of participants | Statistical method | Effect size |
| 1 Maximum pain (VRS) Show forest plot | 1 | Risk Ratio (M‐H, Fixed, 95% CI) | Totals not selected | |
| 1.1 LLLT vs control | 1 | Risk Ratio (M‐H, Fixed, 95% CI) | 0.0 [0.0, 0.0] | |
| 1.2 LLLT vs placebo | 1 | Risk Ratio (M‐H, Fixed, 95% CI) | 0.0 [0.0, 0.0] | |
| 1.3 placebo vs control | 1 | Risk Ratio (M‐H, Fixed, 95% CI) | 0.0 [0.0, 0.0] | |