| Different types of root end fillings |
| Patient or population: people requiring retreatment of periapical lesions Settings: university hospital |
| Intermediate restorative material (IRM) | Mineral trioxide aggregate (MTA) | | | | |
| Healing ‐ 1 year | 806 per 1000 | 878 per 1000
(781 to 975) | RR 1.09 (0.97 to 1.21) | 222
(2 RCTs) | ⊕⊕⊝⊝
lowa,b | RR after 2 years as computed on 108 participants (1 study) was 1.05 (95% CI 0.92 to 1.20). |
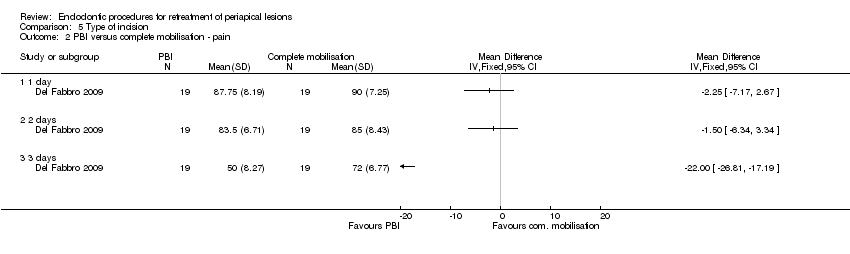
| Pain assessed with visual analogue scale (VAS) from 0 to 100 ‐ 1 day | Not assessed |
| Prevalence of pain ‐ 1 day | 815 per 1000 | 823 per 1000
(684 to 994) | RR 1.01 (0.84 to 1.22) | 100
(1 RCT) | ⊕⊕⊝⊝
lowa,b | RR after 2 days as computed on 100 participants (1 study) was 0.94 (95% CI 0.73 to 1.20). |
| Occurrence of postoperative infection ‐ 4 weeks | Not assessed |
| Height loss of interdental papilla | Not assessed |
| Maximum pain assessed with verbal rating scale (VRS) | Not assessed |
| MTA | SuperEBA | | | | |
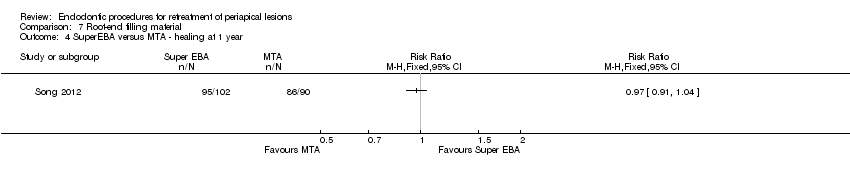
| Healing ‐ 1 year | 956 per 1000 | 927 per 1000
(870 to 994) | RR 0.97 (0.91 to 1.04) | 192
(1 RCT) | ⊕⊕⊝⊝
lowc | There was no evidence of a difference in success rate after 1‐year follow‐up when MTA or SuperEBA was used as root‐end filler. |
| Pain assessed with visual analogue scale (VAS) from 0 to 100 ‐ 1 day | Not assessed |
| Prevalence of pain ‐ 1 day | Not assessed |
| Occurrence of postoperative infection ‐ 4 weeks | Not assessed |
| Height loss of interdental papilla | Not assessed |
| Maximum pain assessed with verbal rating scale (VRS) | Not assessed |
| Gutta‐percha | MTA | | | | |
| Healing ‐ 1 year | 619 per 1000 | 990 per 1000
(706 to 1000) | RR 1.60 (1.14 to 2.24) | 46 (1 RCT) | ⊕⊕⊝⊝
lowc | There was evidence of better healing rate after 1‐year follow‐up when MTA as compared with gutta‐percha was used. |
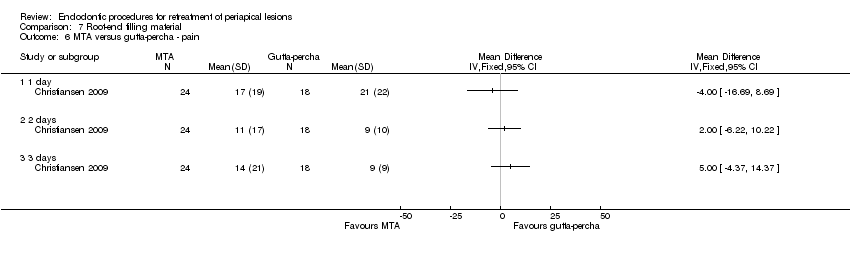
| Pain assessed with visual analogue scale (VAS) from 0 to 100 ‐ 1 day | Mean pain in the control group was 21. | Mean pain in the intervention groups was 4 units lower
(‐16.69 to 8.69). | | 42 (1 RCT) | ⊕⊕⊝⊝
lowc | After 2 days, mean difference in pain was 2.00 (‐6.22 to 10.22); after 3 days, mean difference in pain was 5.00 (‐4.37 to 14.37). |
| Prevalence of pain ‐ 1 day | Not assessed |
| Occurrence of postoperative infection ‐ 4 weeks | Not assessed |
| Height loss of interdental papilla | Not assessed |
| Maximum pain assessed with verbal rating scale (VRS) | Not assessed |
| Amalgam | Glass ionomer cement | | | | |
| Healing ‐ 1 year | 904 per 1000 | 886 per 1000
(777 to 1000) | RR 0.98 (0.86 to 1.12) | 105 (1 RCT) | ⊕⊝⊝⊝
very lowa,d | RR after 5 years as computed on 82 participants (1 study) was 1.00 (95% CI 0.84 to 1.20). |
| Pain assessed with visual analogue scale (VAS) from 0 to 100 ‐ 1 day | Not assessed |
| Prevalence of pain ‐ 1 day | Not assessed |
| Occurrence of postoperative infection ‐ 4 weeks | Not assessed |
| Height loss of interdental papilla | Not assessed |
| Maximum pain assessed with verbal rating scale (VRS) | Not assessed |
| Gutta‐percha | IRM | | | | |
| Healing ‐ 1 year (or longer) | 885 per 1000 | 814 per 1000 (708 to 929) | RR 0.92 (0.80 to 1.05) | 147 (1 RCT) | ⊕⊝⊝⊝
very lowa,d | There is no evidence of a difference in success rate after 1‐year follow‐up when gutta‐percha or IRM was used as root‐end filler. |
| Pain assessed with visual analogue scale (VAS) from 0 to 100 ‐ 1 day | Not assessed |
| Prevalence of pain ‐ 1 day | Not assessed |
| Occurrence of postoperative infection ‐ 4 weeks | Not assessed |
| Height loss of interdental papilla | Not assessed |
| Maximum pain assessed with verbal rating scale (VRS) | Not assessed |
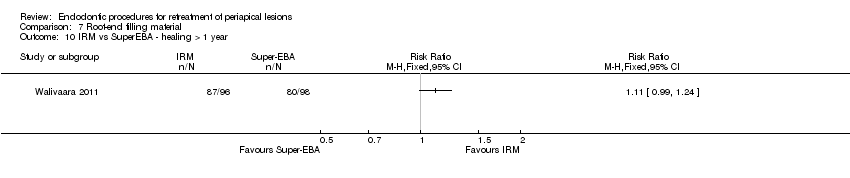
| IRM | SuperEBA | | | | |
| Healing ‐ 1 year (or longer) | 816 per 1000 | 906 per 1000 (808 per 1000) | RR 1.11 (0.99 to 1.24) | 194 (1 RCT) | ⊕⊝⊝⊝
very lowa,d | There was no evidence of a difference in success rate after 1‐year follow‐up when SuperEBA or IRM was used as root‐end filler. |
| Pain assessed with visual analogue scale (VAS) from 0 to 100 ‐ 1 day | Not assessed |
| Prevalence of pain ‐ 1 day | Not assessed |
| Occurrence of postoperative infection ‐ 4 weeks | Not assessed |
| Height loss of interdental papilla | Not assessed |
| Maximum pain assessed with verbal rating scale (VRS) | Not assessed |
| *The basis for the assumed risk (e.g. median control group risk across studies) is provided in footnotes. The corresponding risk (and its 95% confidence interval) is based on the assumed risk in the comparison group and the relative effect of the intervention (and its 95% CI).
CI: confidence interval; RR: risk ratio. |
| GRADE Working Group grades of evidence
High quality: we are very confident that the true effect lies close to that of the estimate of the effect
Moderate quality: we are moderately confident in the effect estimate: the true effect is likely to be close to the estimate of the effect, but there is a possibility that it is substantially different
Low quality: our confidence in the effect estimate is limited: the true effect may be substantially different from the estimate of the effect
Very low quality: we have very little confidence in the effect estimate: the true effect is likely to be substantially different from the estimate of effect |