Endodontic procedures for retreatment of periapical lesions
Information
- DOI:
- https://doi.org/10.1002/14651858.CD005511.pub3Copy DOI

- Database:
-
- Cochrane Database of Systematic Reviews
- Version published:
-
- 19 October 2016see what's new
- Type:
-
- Intervention
- Stage:
-
- Review
- Cochrane Editorial Group:
-
Cochrane Oral Health Group
- Copyright:
-
- Copyright © 2016 The Cochrane Collaboration. Published by John Wiley & Sons, Ltd.
Article metrics
Altmetric:
Cited by:
Authors
Contributions of authors
Conceiving of the review: Silvio Taschieri (ST), Massimo Del Fabbro (MDF).
Designing and co‐ordinating the review: MDF.
Developing search strategies and undertaking searches: Stefano Corbella (SC), Eyal Rosen (ER).
Screening search results and retrieved papers against inclusion criteria: SC, MDF.
Writing to study authors for additional information: MDF, SC.
Appraising the quality of papers: Igor Tsesis (IT), Alessandra Lolato (AL), Patrick Sequeira‐Byron (PSB).
Extracting data from papers: SC, AL, IT.
Screening data on unpublished studies: SC, IT.
Analysing data: SC, PSB, MDF.
Interpreting data: MDF, ST, ER.
Writing the review: MDF, SC.
Providing general advice on the review: ST, ER, IT.
Addressing referee comments: MDF, SC, PSB, AL.
Sources of support
Internal sources
-
No sources of support supplied
External sources
-
National Institute for Health Research (NIHR), UK.
This project was supported by the NIHR, via Cochrane Infrastructure funding to Cochrane Oral Health. The views and opinions expressed therein are those of the authors and do not necessarily reflect those of the Systematic Reviews Programme, NIHR, NHS or the Department of Health
-
Cochrane Oral Health Global Alliance, Other.
The production of Cochrane Oral Health reviews has been supported financially by our Global Alliance since 2011 (ohg.cochrane.org/partnerships‐alliances). Contributors over the past year have been the British Association for the Study of Community Dentistry, UK; the British Society of Paediatric Dentistry, UK; the Canadian Dental Hygienists Association, Canada, the Centre for Dental Education and Research at All India Institute of Medical Sciences, India; the National Center for Dental Hygiene Research & Practice, USA; New York University College of Dentistry, USA; NHS Education for Scotland, UK
-
School of Dentistry, The University of Manchester, UK.
Declarations of interest
The review authors declare that they are free from any commercial conflict of interest. Massimo Del Fabbro and Silvio Taschieri are investigators on studies included in the review; therefore, they were not involved in any assessment regarding those studies (quality appraisal, data extraction, analysis, interpretation).
Acknowledgements
The review authors are indebted to Anne Littlewood for invaluable help in reviewing and finalising the search strategy for the present review. We also acknowledge the help of Helen Wakeford, Helen Worthington and Laura MacDonald.
Version history
| Published | Title | Stage | Authors | Version |
| 2016 Oct 19 | Endodontic procedures for retreatment of periapical lesions | Review | Massimo Del Fabbro, Stefano Corbella, Patrick Sequeira‐Byron, Igor Tsesis, Eyal Rosen, Alessandra Lolato, Silvio Taschieri | |
| 2007 Jul 18 | Surgical versus non‐surgical endodontic re‐treatment for periradicular lesions | Review | Massimo Del Fabbro, Silvio Taschieri, Tiziano Testori, Luca Francetti, Roberto L Weinstein | |
| 2005 Oct 19 | Surgical versus non‐surgical endodontic re‐treatment for periradicular lesions | Protocol | Massimo Del Fabbro, Silvio Taschieri, Tiziano Testori, Luca Francetti, Roberto L Weinstein | |
Differences between protocol and review
We changed the title to reflect the change in scope.
We added a few sentences in the Background section, at the beginning of 'Description of the condition' and 'Description of the intervention', to better explain the aim of root canal therapy and the main differences between orthograde and surgical endodontic retreatment.
We included patient‐reported outcomes such as postoperative pain and discomfort, as well as the follow‐up time for such outcomes (first week after surgery).
We added the method of analysing studies with paired data (trials with split‐mouth design) (generic inverse variance) in the 'Data synthesis' section.
Some review authors (MDF, ST) were among the authors of some of the included studies; therefore, only those review authors not involved in the trials (IT, PSB) performed the risk of bias assessment for these studies.
We included some parallel‐group studies presenting data only on a tooth basis because the review authors agreed that these results were worth reporting, and we undertook meta‐analysis if only tooth‐based data, instead of patient‐based data, were available for all studies addressing a given comparison. In split‐mouth studies, the tooth was considered as the unit of analysis.
We dichotomised data regarding healing of the periapical lesion, which usually are expressed in four scores (complete, incomplete, uncertain, unsatisfactory healing), into 'healing' (complete plus incomplete healing data) and 'failure' (uncertain plus unsatisfactory healing data). In our previous version, we had included 'uncertain' results under 'healing'. For outcomes reported as continuous variables (e.g. pain, as expressed with VAS), we calculated the estimates of effects of interventions as mean differences (MDs).
Keywords
MeSH
Medical Subject Headings (MeSH) Keywords
Medical Subject Headings Check Words
Humans;
PICOs

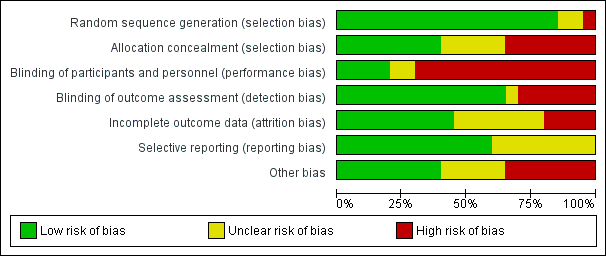
Risk of bias graph: review authors' judgements about each risk of bias item presented as percentages across all included studies

Risk of bias summary: review authors' judgements about each risk of bias item for each included study

Forest plot of comparison: 1 Root‐end resection versus root canal retreatment, outcome: 1.1 Healing ‐ one year
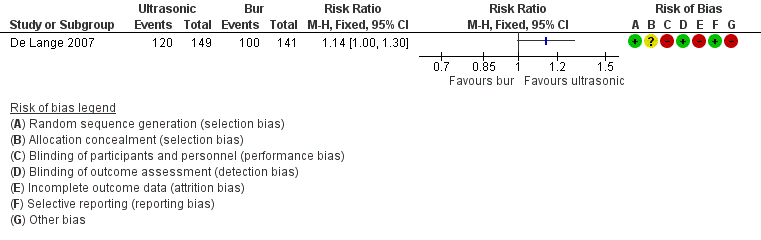
Forest plot of comparison: 6 Ultrasonic versus Bur, outcome: 6.1 Healing ‐ one year

Comparison 1 Root‐end resection versus root canal retreatment, Outcome 1 Healing ‐ 1 year.

Comparison 1 Root‐end resection versus root canal retreatment, Outcome 2 Healing ‐ 4 years.

Comparison 1 Root‐end resection versus root canal retreatment, Outcome 3 Healing ‐ 10 years.

Comparison 1 Root‐end resection versus root canal retreatment, Outcome 4 Participants reporting pain.

Comparison 1 Root‐end resection versus root canal retreatment, Outcome 5 Participants reporting swelling.

Comparison 2 CBCT versus periapical radiography, Outcome 1 Healing ‐ 1 year.

Comparison 3 Antibiotic prophylaxis versus placebo, Outcome 1 Occurrence of postoperative infection ‐ 4 weeks.

Comparison 4 Magnification devices, Outcome 1 Loupes versus endoscope ‐ healing at 1 year.

Comparison 4 Magnification devices, Outcome 2 Microscope versus endoscope ‐ healing at 2 years.

Comparison 5 Type of incision, Outcome 1 PBI versus complete mobilisation ‐ papilla height.

Comparison 5 Type of incision, Outcome 2 PBI versus complete mobilisation ‐ pain.

Comparison 6 Ultrasonic versus bur, Outcome 1 Healing ‐ 1 year.

Comparison 7 Root‐end filling material, Outcome 1 MTA versus IRM ‐ healing at 1 year.

Comparison 7 Root‐end filling material, Outcome 2 MTA versus IRM ‐ healing at 2 years.

Comparison 7 Root‐end filling material, Outcome 3 MTA versus IRM ‐ pain.

Comparison 7 Root‐end filling material, Outcome 4 SuperEBA versus MTA ‐ healing at 1 year.

Comparison 7 Root‐end filling material, Outcome 5 MTA versus gutta‐percha ‐ healing at 1 year.

Comparison 7 Root‐end filling material, Outcome 6 MTA versus gutta‐percha ‐ pain.

Comparison 7 Root‐end filling material, Outcome 7 Glass ionomer cement (GIC) vs amalgam ‐ healing at 1 year.

Comparison 7 Root‐end filling material, Outcome 8 Glass ionomer cement (GIC) vs amalgam ‐ healing at 5 years.

Comparison 7 Root‐end filling material, Outcome 9 IRM vs Gutta‐percha ‐ healing > 1 year.

Comparison 7 Root‐end filling material, Outcome 10 IRM vs SuperEBA ‐ healing > 1 year.

Comparison 8 Grafting versus no grafting, Outcome 1 Calcium sulphate (CaS) versus no grafting ‐ healing at 1 year.

Comparison 8 Grafting versus no grafting, Outcome 2 GTR with bovine bone vs no grafting ‐ healing at 1 year ‐ TB.

Comparison 8 Grafting versus no grafting, Outcome 3 PRGF versus no grafting ‐ pain (VAS).

Comparison 9 Low energy level laser therapy (LLLT) versus placebo versus control, Outcome 1 Maximum pain (VRS).
| Root‐end resection versus root canal retreatment | ||||||
| Patient or population: people requiring retreatment of periapical lesions Comparison: root canal retreatment | ||||||
| Outcomes | Anticipated absolute effects* (95% CI) | Relative effect | Number of participants | Quality of the evidence | Comments | |
| Risk with root canal retreatment | Risk with root‐end resection and filling | |||||
| Healing ‐ 1 year | 726 per 1000 | 835 per 1000 | RR 1.15 | 126 | ⊕⊝⊝⊝ | RR after 4 years was 1.03 (0.89 to 1.20) (1 study, 82 participants) RR after 10 years was 1.11 (0.88 to 1.41) (1 study, 95 participants) |
| Pain assessed with visual analogue scale (VAS) from 0 to 100 ‐ 1 day | Not assessed | |||||
| Prevalence of pain ‐ 1 day | 279 out of 1000 | 932 out of 1000 (572 to 1515) | RR 3.34 (2.05 to 5.43) | 87 (1 study) | ⊕⊕⊝⊝ | Number of participants reporting pain each day in the first postoperative week was significantly higher in the surgical group than in the non‐surgical group. |
| Occurrence of postoperative infection ‐ 4 weeks | Not assessed | |||||
| Height loss of interdental papilla | Not assessed | |||||
| Maximum pain assessed with verbal rating scale (VRS) | Not assessed | |||||
| *The risk in the intervention group (and its 95% confidence interval) is based on the assumed risk in the comparison group and the relative effect of the intervention (and its 95% CI). | ||||||
| GRADE Working Group grades of evidence | ||||||
| aQuality of evidence was downgraded owing to heterogeneity (inconsistency). bQuality of evidence was downgraded owing to imprecision (CI includes RR of 1.0). cQuality of evidence was downgraded because both studies had high risk of bias. dQuality of evidence was downgraded because it was based on a single small study at high risk of bias. | ||||||
| CBCT versus periapical radiography | ||||||
| Patient or population: people requiring retreatment of periapical lesions | ||||||
| Outcomes | Anticipated absolute effects* (95% CI) | Relative effect | Number of participants | Quality of the evidence | Comments | |
| Risk with periapical radiography | Risk with CBCT | |||||
| Healing ‐ 1 year | 737 per 1000 | 752 per 1000 | RR 1.02 | 39 | ⊕⊝⊝⊝ | |
| Pain assessed with visual analogue scale (VAS) from 0 to 100 ‐ 1 day | Not assessed | |||||
| Prevalence of pain ‐ 1 day | Not assessed | |||||
| Occurrence of postoperative infection ‐ 4 weeks | Not assessed | |||||
| Height loss of interdental papilla | Not assessed | |||||
| Maximum pain assessed with verbal rating scale (VRS) | Not assessed | |||||
| *The risk in the intervention group (and its 95% confidence interval) is based on the assumed risk in the comparison group and the relative effect of the intervention (and its 95% CI). | ||||||
| GRADE Working Group grades of evidence | ||||||
| aQuality of evidence was downgraded because it was derived from a single study at high risk of bias with imprecise results. | ||||||
| Preoperative antibiotic prophylaxis versus placebo | ||||||
| Patient or population: people requiring retreatment of periapical lesions | ||||||
| Outcomes | Anticipated absolute effects* (95% CI) | Relative effect | Number of participants | Quality of the evidence | Comments | |
| Risk with placebo | Risk with antibiotic prophylaxis | |||||
| Healing ‐ 1 year | Not assessed | |||||
| Pain assessed with visual analogue scale (VAS) from 0 to 100 ‐ 1 day | Not assessed | |||||
| Prevalence of pain ‐ 1 day | Not assessed | |||||
| Occurrence of postoperative infection ‐ 4 weeks | 32 per 1000 | 16 per 1000 | RR 0.49 | 250 | ⊕⊝⊝⊝ | |
| Height loss of interdental papilla | Not assessed | |||||
| Maximum pain assessed with verbal rating scale (VRS) | Not assessed | |||||
| *The risk in the intervention group (and its 95% confidence interval) is based on the assumed risk in the comparison group and the relative effect of the intervention (and its 95% CI). | ||||||
| GRADE Working Group grades of evidence | ||||||
| aQuality of evidence was downgraded because it was derived from a single study at unclear risk of bias with very imprecise results. | ||||||
| Different types of magnification devices | ||||||
| Patient or population: people requiring retreatment of periapical lesions | ||||||
| Outcomes | Anticipated absolute effects* (95% CI) | Relative effect | Number of participants | Quality of the evidence | Comments | |
| Risk with loupes or microscope | Risk with endoscope | |||||
| Loupes vs endoscope ‐ healing at 1 year | 906 per 1000 | 952 per 1000 | RR 1.05 | 62 (71 teeth) | ⊕⊕⊝⊝ | |
| Microscope vs endoscope ‐ healing at 2 years | 902 per 1000 | 911 per 1000 | RR 1.01 | 70 (100 teeth) | ⊕⊕⊝⊝ | |
| Pain assessed with visual analogue scale (VAS) from 0 to 100 ‐ 1 day | Not assessed | |||||
| Prevalence of pain ‐ 1 day | Not assessed | |||||
| Occurrence of postoperative infection ‐ 4 weeks | Not assessed | |||||
| Height loss of interdental papilla | Not assessed | |||||
| Maximum pain assessed with verbal rating scale (VRS) | Not assessed | |||||
| *The risk in the intervention group (and its 95% confidence interval) is based on the assumed risk in the comparison group and the relative effect of the intervention (and its 95% CI). | ||||||
| GRADE Working Group grades of evidence | ||||||
| aQuality of evidence was downgraded because it was derived from a single study at high risk of bias. | ||||||
| Papilla base incision (PBI) versus complete mobilisation | ||||||
| Patient or population: people requiring retreatment of periapical lesions | ||||||
| Outcomes | Anticipated absolute effects* (95% CI) | Relative effect | Number of participants | Quality of the evidence | Comments | |
| Risk with complete mobilisation | Risk with PBI | |||||
| Healing ‐ 1 year | Not assessed | |||||
| Pain assessed with visual analogue scale (VAS) from 0 to 100 ‐ 1 day | Mean pain was 90 mm | Mean pain in the intervention group was 2.25 lower (7.17 lower to 2.67 higher). | ‐ | 38 | ⊕⊝⊝⊝ | |
| Prevalence of pain ‐ 1 day | Not assessed | |||||
| Occurrence of postoperative infection ‐ 4 weeks | Not assessed | |||||
| Height loss of interdental papilla ‐ 1 year | Mean height loss of interdental papilla was 0.98 mm. | Mean height loss of interdental papilla in the intervention group was 1.04 mm lower (1.48 lower to 0.60 lower). | ‐ | 12 | ⊕⊝⊝⊝ | |
| Maximum pain assessed with verbal rating scale (VRS) | Not assessed | |||||
| *The risk in the intervention group (and its 95% confidence interval) is based on the assumed risk in the comparison group and the relative effect of the intervention (and its 95% CI). | ||||||
| GRADE Working Group grades of evidence | ||||||
| aQuality of evidence was downgraded because it was derived from a single small study at unclear risk of bias with very imprecise results. bQuality of evidence was downgraded because it was derived from one small split‐mouth study at high risk of bias. | ||||||
| Ultrasonic instruments versus bur | ||||||
| Patient or population: people requiring retreatment of periapical lesions | ||||||
| Outcomes | Anticipated absolute effects* (95% CI) | Relative effect | Number of participants | Quality of the evidence | Comments | |
| Risk with bur | Risk with ultrasonic | |||||
| Healing ‐ 1 year | 709 per 1000 | 809 per 1000 | RR 1.14 | 290 | ⊕⊕⊝⊝ | There was inconclusive evidence that use of ultrasonic devices could produce a better success rate after 1‐year follow‐up. |
| Pain assessed with visual analogue scale (VAS) from 0 to 100 ‐ 1 day | Not assessed | |||||
| Prevalence of pain ‐ 1 day | Not assessed | |||||
| Occurrence of postoperative infection ‐ 4 weeks | Not assessed | |||||
| Height loss of interdental papilla | Not assessed | |||||
| Maximum pain assessed with verbal rating scale (VRS) | Not assessed | |||||
| *The risk in the intervention group (and its 95% confidence interval) is based on the assumed risk in the comparison group and the relative effect of the intervention (and its 95% CI). | ||||||
| GRADE Working Group grades of evidence | ||||||
| aQuality of evidence downgraded because it was derived from one study at high risk of bias (attrition bias). | ||||||
| Different types of root end fillings | ||||||
| Patient or population: people requiring retreatment of periapical lesions Settings: university hospital | ||||||
| Outcomes | Illustrative comparative risks* (95% CI) | Relative effect | Number of Participants | Quality of the evidence | Comments | |
| Assumed risk | Corresponding risk | |||||
| Intermediate restorative material (IRM) | Mineral trioxide aggregate (MTA) | |||||
| Healing ‐ 1 year | 806 per 1000 | 878 per 1000 | RR 1.09 (0.97 to 1.21) | 222 | ⊕⊕⊝⊝ | RR after 2 years as computed on 108 participants (1 study) was 1.05 (95% CI 0.92 to 1.20). |
| Pain assessed with visual analogue scale (VAS) from 0 to 100 ‐ 1 day | Not assessed | |||||
| Prevalence of pain ‐ 1 day | 815 per 1000 | 823 per 1000 | RR 1.01 (0.84 to 1.22) | 100 | ⊕⊕⊝⊝ | RR after 2 days as computed on 100 participants (1 study) was 0.94 (95% CI 0.73 to 1.20). |
| Occurrence of postoperative infection ‐ 4 weeks | Not assessed | |||||
| Height loss of interdental papilla | Not assessed | |||||
| Maximum pain assessed with verbal rating scale (VRS) | Not assessed | |||||
| MTA | SuperEBA | |||||
| Healing ‐ 1 year | 956 per 1000 | 927 per 1000 | RR 0.97 (0.91 to 1.04) | 192 | ⊕⊕⊝⊝ | There was no evidence of a difference in success rate after 1‐year follow‐up when MTA or SuperEBA was used as root‐end filler. |
| Pain assessed with visual analogue scale (VAS) from 0 to 100 ‐ 1 day | Not assessed | |||||
| Prevalence of pain ‐ 1 day | Not assessed | |||||
| Occurrence of postoperative infection ‐ 4 weeks | Not assessed | |||||
| Height loss of interdental papilla | Not assessed | |||||
| Maximum pain assessed with verbal rating scale (VRS) | Not assessed | |||||
| Gutta‐percha | MTA | |||||
| Healing ‐ 1 year | 619 per 1000 | 990 per 1000 | RR 1.60 (1.14 to 2.24) | 46 (1 RCT) | ⊕⊕⊝⊝ | There was evidence of better healing rate after 1‐year follow‐up when MTA as compared with gutta‐percha was used. |
| Pain assessed with visual analogue scale (VAS) from 0 to 100 ‐ 1 day | Mean pain in the control group was 21. | Mean pain in the intervention groups was 4 units lower | 42 (1 RCT) | ⊕⊕⊝⊝ | After 2 days, mean difference in pain was 2.00 (‐6.22 to 10.22); after 3 days, mean difference in pain was 5.00 (‐4.37 to 14.37). | |
| Prevalence of pain ‐ 1 day | Not assessed | |||||
| Occurrence of postoperative infection ‐ 4 weeks | Not assessed | |||||
| Height loss of interdental papilla | Not assessed | |||||
| Maximum pain assessed with verbal rating scale (VRS) | Not assessed | |||||
| Amalgam | Glass ionomer cement | |||||
| Healing ‐ 1 year | 904 per 1000 | 886 per 1000 | RR 0.98 (0.86 to 1.12) | 105 (1 RCT) | ⊕⊝⊝⊝ | RR after 5 years as computed on 82 participants (1 study) was 1.00 (95% CI 0.84 to 1.20). |
| Pain assessed with visual analogue scale (VAS) from 0 to 100 ‐ 1 day | Not assessed | |||||
| Prevalence of pain ‐ 1 day | Not assessed | |||||
| Occurrence of postoperative infection ‐ 4 weeks | Not assessed | |||||
| Height loss of interdental papilla | Not assessed | |||||
| Maximum pain assessed with verbal rating scale (VRS) | Not assessed | |||||
| Gutta‐percha | IRM | |||||
| Healing ‐ 1 year (or longer) | 885 per 1000 | 814 per 1000 (708 to 929) | RR 0.92 (0.80 to 1.05) | 147 (1 RCT) | ⊕⊝⊝⊝ | There is no evidence of a difference in success rate after 1‐year follow‐up when gutta‐percha or IRM was used as root‐end filler. |
| Pain assessed with visual analogue scale (VAS) from 0 to 100 ‐ 1 day | Not assessed | |||||
| Prevalence of pain ‐ 1 day | Not assessed | |||||
| Occurrence of postoperative infection ‐ 4 weeks | Not assessed | |||||
| Height loss of interdental papilla | Not assessed | |||||
| Maximum pain assessed with verbal rating scale (VRS) | Not assessed | |||||
| IRM | SuperEBA | |||||
| Healing ‐ 1 year (or longer) | 816 per 1000 | 906 per 1000 (808 per 1000) | RR 1.11 (0.99 to 1.24) | 194 (1 RCT) | ⊕⊝⊝⊝ | There was no evidence of a difference in success rate after 1‐year follow‐up when SuperEBA or IRM was used as root‐end filler. |
| Pain assessed with visual analogue scale (VAS) from 0 to 100 ‐ 1 day | Not assessed | |||||
| Prevalence of pain ‐ 1 day | Not assessed | |||||
| Occurrence of postoperative infection ‐ 4 weeks | Not assessed | |||||
| Height loss of interdental papilla | Not assessed | |||||
| Maximum pain assessed with verbal rating scale (VRS) | Not assessed | |||||
| *The basis for the assumed risk (e.g. median control group risk across studies) is provided in footnotes. The corresponding risk (and its 95% confidence interval) is based on the assumed risk in the comparison group and the relative effect of the intervention (and its 95% CI). | ||||||
| GRADE Working Group grades of evidence | ||||||
| aQuality of evidence was downgraded owing to imprecision (CI includes RR of 1.0). bQuality of evidence was downgraded because one study had high risk of bias (attrition bias). cQuality of evidence was downgraded because it was based on a single study and because of imprecision. dQuality of evidence was downgraded because it was based on a single study that had high risk of bias. | ||||||
| Grafting versus no grafting | ||||||
| Patient or population: people requiring retreatment of periapical lesions Settings: university Intervention: grafting Control: no grafting | ||||||
| Outcomes | Illustrative comparative risks* (95% CI) | Relative effect | Number of participants | Quality of the evidence | Comments | |
| Assumed risk | Corresponding risk | |||||
| No grafting | Grafting | |||||
| Healing ‐ 1 year | Calcium sulphate | |||||
| 889 per 1000 | 996 per 1000 (738 per 1000) | RR 1.12 (0.83 to 1.50) | 18 (1 RCT) | ⊕⊕⊝⊝ | There was no evidence that grafting the periapical lesion with calcium sulphate may improve healing of the lesion after 1‐year follow‐up. | |
| GTR + Bovine bone | ||||||
| 743 per 1000 | 832 per 1000 (639 per 1000) | RR 1.12 (0.86 to 1.46) | 59 (1 RCT) | ⊕⊕⊝⊝ | There was no evidence that guided tissue regeneration improves healing of the lesion after 1‐year follow‐up. | |
| PRGF gel | ||||||
| Pain assessed with visual analogue scale (VAS) from 0 to 100 ‐ 1 day | Mean pain was 73.3. | Mean pain in the intervention group was 51.6 lower (63.43 lower to 39.77 lower). | ‐ | 36 (1 RCT) | ⊕⊕⊝⊝ | There was evidence that using plasma rich in growth factors may decrease postoperative pain in the early days after surgery. After 2 days, mean pain in the intervention group was 41.7 lower than in the control group (‐52.09 to ‐31.31); after 3 days, mean pain in the intervention group was 45 lower than in the control group (‐59.71 to ‐30.29). |
| Prevalence of pain ‐ 1 day | Not assessed | |||||
| Occurrence of postoperative infection ‐ 4 weeks | Not assessed | |||||
| Height loss of interdental papilla | Not assessed | |||||
| Maximum pain assessed with verbal rating scale (VRS) | Not assessed | |||||
| *The basis for the assumed risk (e.g. median control group risk across studies) is provided in footnotes. The corresponding risk (and its 95% confidence interval) is based on the assumed risk in the comparison group and the relative effect of the intervention (and its 95% CI). | ||||||
| GRADE Working Group grades of evidence | ||||||
| aQuality of evidence was downgraded two levels because it was based on a single study and because of imprecision. | ||||||
| Low energy level laser therapy compared with placebo for surgical retreatment of periapical lesions | ||||||
| Patient or population: people requiring retreatment of periapical lesions Control: placebo | ||||||
| Outcomes | Illustrative comparative risks* (95% CI) | Relative effect | Number of participants | Quality of the evidence | Comments | |
| Assumed risk | Corresponding risk | |||||
| Placebo | LLLT | |||||
| Healing ‐ 1 year | Not assessed | |||||
| Pain assessed with visual analogue scale (VAS) from 0 to 100 ‐ 1 day | Not assessed | |||||
| Prevalence of pain ‐ 1 day | Not assessed | |||||
| Occurrence of postoperative infection ‐ 4 weeks | Not assessed | |||||
| Height loss of interdental papilla ‐ 1 year | Not assessed | |||||
| Placebo | LLLT | |||||
| Maximum pain assessed with verbal rating scale (VRS) | 0 per 1000 | 0 per 1000 | Not estimable | 52 | ⊕⊝⊝⊝ | |
| Control | LLLT | |||||
| Maximum pain assessed with verbal rating scale (VRS) | 300 per 1000 | 0 per 1000 | Not estimable | 44 | ⊕⊝⊝⊝ | |
| *The basis for the assumed risk (e.g. median control group risk across studies) is provided in footnotes. The corresponding risk (and its 95% confidence interval) is based on the assumed risk in the comparison group and the relative effect of the intervention (and its 95% CI). | ||||||
| GRADE Working Group grades of evidence | ||||||
| aQuality of evidence was downgraded three levels because it is based on a single study at high risk of bias. | ||||||
| Outcome or subgroup title | No. of studies | No. of participants | Statistical method | Effect size |
| 1 Healing ‐ 1 year Show forest plot | 2 | 126 | Risk Ratio (M‐H, Fixed, 95% CI) | 1.15 [0.97, 1.35] |
| 2 Healing ‐ 4 years Show forest plot | 1 | Risk Ratio (M‐H, Fixed, 95% CI) | Totals not selected | |
| 3 Healing ‐ 10 years Show forest plot | 1 | Risk Ratio (M‐H, Fixed, 95% CI) | Totals not selected | |
| 4 Participants reporting pain Show forest plot | 1 | Risk Ratio (M‐H, Fixed, 95% CI) | Totals not selected | |
| 4.1 day 1 | 1 | Risk Ratio (M‐H, Fixed, 95% CI) | 0.0 [0.0, 0.0] | |
| 4.2 day 2 | 1 | Risk Ratio (M‐H, Fixed, 95% CI) | 0.0 [0.0, 0.0] | |
| 4.3 day 3 | 1 | Risk Ratio (M‐H, Fixed, 95% CI) | 0.0 [0.0, 0.0] | |
| 4.4 day 4 | 1 | Risk Ratio (M‐H, Fixed, 95% CI) | 0.0 [0.0, 0.0] | |
| 4.5 day 5 | 1 | Risk Ratio (M‐H, Fixed, 95% CI) | 0.0 [0.0, 0.0] | |
| 4.6 day 6 | 1 | Risk Ratio (M‐H, Fixed, 95% CI) | 0.0 [0.0, 0.0] | |
| 4.7 day 7 | 1 | Risk Ratio (M‐H, Fixed, 95% CI) | 0.0 [0.0, 0.0] | |
| 5 Participants reporting swelling Show forest plot | 1 | Risk Ratio (M‐H, Fixed, 95% CI) | Totals not selected | |
| 5.1 day 1 | 1 | Risk Ratio (M‐H, Fixed, 95% CI) | 0.0 [0.0, 0.0] | |
| 5.2 day 2 | 1 | Risk Ratio (M‐H, Fixed, 95% CI) | 0.0 [0.0, 0.0] | |
| 5.3 day 3 | 1 | Risk Ratio (M‐H, Fixed, 95% CI) | 0.0 [0.0, 0.0] | |
| 5.4 day 4 | 1 | Risk Ratio (M‐H, Fixed, 95% CI) | 0.0 [0.0, 0.0] | |
| 5.5 day 5 | 1 | Risk Ratio (M‐H, Fixed, 95% CI) | 0.0 [0.0, 0.0] | |
| 5.6 day 6 | 1 | Risk Ratio (M‐H, Fixed, 95% CI) | 0.0 [0.0, 0.0] | |
| 5.7 day 7 | 1 | Risk Ratio (M‐H, Fixed, 95% CI) | 0.0 [0.0, 0.0] | |
| Outcome or subgroup title | No. of studies | No. of participants | Statistical method | Effect size |
| 1 Healing ‐ 1 year Show forest plot | 1 | Risk Ratio (M‐H, Fixed, 95% CI) | Totals not selected | |
| Outcome or subgroup title | No. of studies | No. of participants | Statistical method | Effect size |
| 1 Occurrence of postoperative infection ‐ 4 weeks Show forest plot | 1 | Risk Ratio (M‐H, Fixed, 95% CI) | Totals not selected | |
| Outcome or subgroup title | No. of studies | No. of participants | Statistical method | Effect size |
| 1 Loupes versus endoscope ‐ healing at 1 year Show forest plot | 1 | Risk Ratio (M‐H, Fixed, 95% CI) | Totals not selected | |
| 2 Microscope versus endoscope ‐ healing at 2 years Show forest plot | 1 | Risk Ratio (M‐H, Fixed, 95% CI) | Totals not selected | |
| Outcome or subgroup title | No. of studies | No. of participants | Statistical method | Effect size |
| 1 PBI versus complete mobilisation ‐ papilla height Show forest plot | 1 | Mean Difference (Fixed, 95% CI) | Totals not selected | |
| 2 PBI versus complete mobilisation ‐ pain Show forest plot | 1 | Mean Difference (IV, Fixed, 95% CI) | Totals not selected | |
| 2.1 1 day | 1 | Mean Difference (IV, Fixed, 95% CI) | 0.0 [0.0, 0.0] | |
| 2.2 2 days | 1 | Mean Difference (IV, Fixed, 95% CI) | 0.0 [0.0, 0.0] | |
| 2.3 3 days | 1 | Mean Difference (IV, Fixed, 95% CI) | 0.0 [0.0, 0.0] | |
| Outcome or subgroup title | No. of studies | No. of participants | Statistical method | Effect size |
| 1 Healing ‐ 1 year Show forest plot | 1 | Risk Ratio (M‐H, Fixed, 95% CI) | Totals not selected | |
| Outcome or subgroup title | No. of studies | No. of participants | Statistical method | Effect size |
| 1 MTA versus IRM ‐ healing at 1 year Show forest plot | 2 | 222 | Risk Ratio (M‐H, Fixed, 95% CI) | 1.09 [0.97, 1.22] |
| 2 MTA versus IRM ‐ healing at 2 years Show forest plot | 1 | Risk Ratio (M‐H, Fixed, 95% CI) | Totals not selected | |
| 3 MTA versus IRM ‐ pain Show forest plot | 1 | Risk Ratio (M‐H, Fixed, 95% CI) | Totals not selected | |
| 3.1 1 day | 1 | Risk Ratio (M‐H, Fixed, 95% CI) | 0.0 [0.0, 0.0] | |
| 3.2 2 days | 1 | Risk Ratio (M‐H, Fixed, 95% CI) | 0.0 [0.0, 0.0] | |
| 4 SuperEBA versus MTA ‐ healing at 1 year Show forest plot | 1 | Risk Ratio (M‐H, Fixed, 95% CI) | Totals not selected | |
| 5 MTA versus gutta‐percha ‐ healing at 1 year Show forest plot | 1 | Risk Ratio (M‐H, Fixed, 95% CI) | Totals not selected | |
| 6 MTA versus gutta‐percha ‐ pain Show forest plot | 1 | Mean Difference (IV, Fixed, 95% CI) | Totals not selected | |
| 6.1 1 day | 1 | Mean Difference (IV, Fixed, 95% CI) | 0.0 [0.0, 0.0] | |
| 6.2 2 days | 1 | Mean Difference (IV, Fixed, 95% CI) | 0.0 [0.0, 0.0] | |
| 6.3 3 days | 1 | Mean Difference (IV, Fixed, 95% CI) | 0.0 [0.0, 0.0] | |
| 7 Glass ionomer cement (GIC) vs amalgam ‐ healing at 1 year Show forest plot | 1 | Risk Ratio (M‐H, Fixed, 95% CI) | Totals not selected | |
| 8 Glass ionomer cement (GIC) vs amalgam ‐ healing at 5 years Show forest plot | 1 | Risk Ratio (M‐H, Fixed, 95% CI) | Totals not selected | |
| 9 IRM vs Gutta‐percha ‐ healing > 1 year Show forest plot | 1 | Risk Ratio (M‐H, Fixed, 95% CI) | Totals not selected | |
| 10 IRM vs SuperEBA ‐ healing > 1 year Show forest plot | 1 | Risk Ratio (M‐H, Fixed, 95% CI) | Totals not selected | |
| Outcome or subgroup title | No. of studies | No. of participants | Statistical method | Effect size |
| 1 Calcium sulphate (CaS) versus no grafting ‐ healing at 1 year Show forest plot | 1 | Risk Ratio (M‐H, Fixed, 95% CI) | Totals not selected | |
| 2 GTR with bovine bone vs no grafting ‐ healing at 1 year ‐ TB Show forest plot | 1 | Risk Ratio (M‐H, Fixed, 95% CI) | Totals not selected | |
| 3 PRGF versus no grafting ‐ pain (VAS) Show forest plot | 1 | Mean Difference (IV, Fixed, 95% CI) | Totals not selected | |
| 3.1 1 day | 1 | Mean Difference (IV, Fixed, 95% CI) | 0.0 [0.0, 0.0] | |
| 3.2 2 days | 1 | Mean Difference (IV, Fixed, 95% CI) | 0.0 [0.0, 0.0] | |
| 3.3 3 days | 1 | Mean Difference (IV, Fixed, 95% CI) | 0.0 [0.0, 0.0] | |
| Outcome or subgroup title | No. of studies | No. of participants | Statistical method | Effect size |
| 1 Maximum pain (VRS) Show forest plot | 1 | Risk Ratio (M‐H, Fixed, 95% CI) | Totals not selected | |
| 1.1 LLLT vs control | 1 | Risk Ratio (M‐H, Fixed, 95% CI) | 0.0 [0.0, 0.0] | |
| 1.2 LLLT vs placebo | 1 | Risk Ratio (M‐H, Fixed, 95% CI) | 0.0 [0.0, 0.0] | |
| 1.3 placebo vs control | 1 | Risk Ratio (M‐H, Fixed, 95% CI) | 0.0 [0.0, 0.0] | |