Sildenafil para la hipertensión pulmonar en recién nacidos
Información
- DOI:
- https://doi.org/10.1002/14651858.CD005494.pub4Copiar DOI

- Base de datos:
-
- Cochrane Database of Systematic Reviews
- Versión publicada:
-
- 04 agosto 2017see what's new
- Tipo:
-
- Intervention
- Etapa:
-
- Review
- Grupo Editorial Cochrane:
-
Grupo Cochrane de Neonatología
- Copyright:
-
- Copyright © 2020 The Cochrane Collaboration. Published by John Wiley & Sons, Ltd.
Cifras del artículo
Altmetric:
Citado por:
Autores
Contributions of authors
LE Kelly reviewed the literature to identify trials, collected and entered data into RevMan, updated the review text, and revised the final version of this revision. A Ohlsson reviewed and edited the protocol, checked the search strategy and data entry, verified the data entered, and revised the final version of all versions of this review. PS Shah developed and edited the protocol, identified trials, wrote and edited the review, verified data entered into RevMan, and revised the final version of all versions of this review.
Sources of support
Internal sources
-
Department of Paediatrics, Mount Sinai Hospital, Toronto, Canada.
External sources
-
Eunice Kennedy Shriver National Institute of Child Health and Human Development, National Institutes of Health, Department of Health and Human Services, USA.
Editorial support of the Cochrane Neonatal Review Group has been funded with Federal funds from the Eunice Kennedy Shriver National Institute of Child Health and Human Development, National Institutes of Health, Department of Health and Human Services, USA, under Contract No. HHSN275201600005C
Declarations of interest
The review authors have no conflicts of interest to declare.
Acknowledgements
We would like to sincerely thank Drs. Augusta Sola, Jayendra Gohil, and Husam Salama for providing data on their studies. We would like to acknowledge the help of Dr. Cecilia Herbozo for translation of the Herrera 2006 study from Spanish. We acknowledge the valuable contributions made by Jennifer Spano and Collen Ovelman from the CNRG, who performed the literature searches.
Version history
| Published | Title | Stage | Authors | Version |
| 2017 Aug 04 | Sildenafil for pulmonary hypertension in neonates | Review | Lauren E Kelly, Arne Ohlsson, Prakeshkumar S Shah | |
| 2011 Aug 10 | Sildenafil for pulmonary hypertension in neonates | Review | Prakeshkumar S Shah, Arne Ohlsson | |
| 2007 Jul 18 | Sildenafil for pulmonary hypertension in neonates | Review | Prakeshkumar S Shah, Arne Ohlsson | |
| 2005 Oct 19 | Sildenafil for pulmonary hypertension in neonates | Protocol | Prakeshkumar S Shah, Arne Ohlsson | |
Differences between protocol and review
An additional author (LEK) was added to this review team. We added to this update a post hoc comparison of sildenafil versus placebo as adjuvant therapy to inhaled nitric oxide.
Keywords
MeSH
Medical Subject Headings (MeSH) Keywords
Medical Subject Headings Check Words
Humans; Infant, Newborn;
PICO

Study flow diagram: review update.

Risk of bias graph: review authors' judgements about each risk of bias item presented as percentages across all included studies.

Risk of bias summary: review authors' judgements about each risk of bias item for each included study.
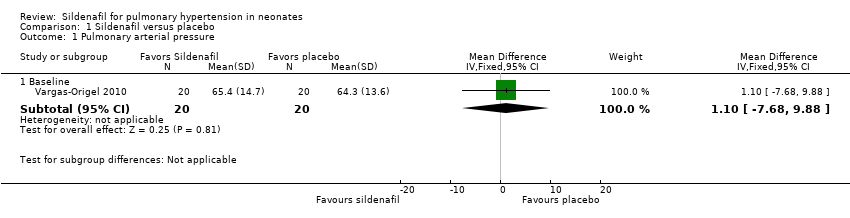
Comparison 1 Sildenafil versus placebo, Outcome 1 Pulmonary arterial pressure.

Comparison 1 Sildenafil versus placebo, Outcome 2 PaO2 in mmHg (absolute values).

Comparison 1 Sildenafil versus placebo, Outcome 3 Mean arterial blood pressure in mmHg.
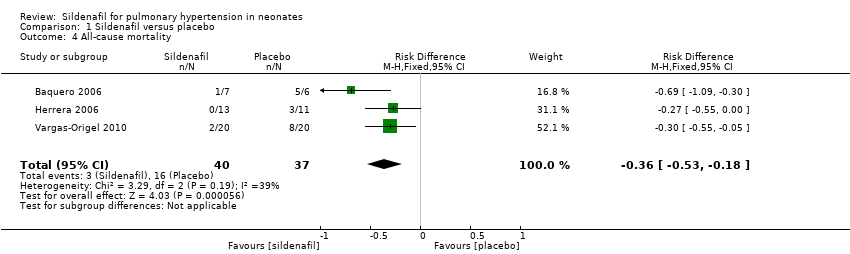
Comparison 1 Sildenafil versus placebo, Outcome 4 All‐cause mortality.

Comparison 1 Sildenafil versus placebo, Outcome 5 Oxygenation index (absolute values).
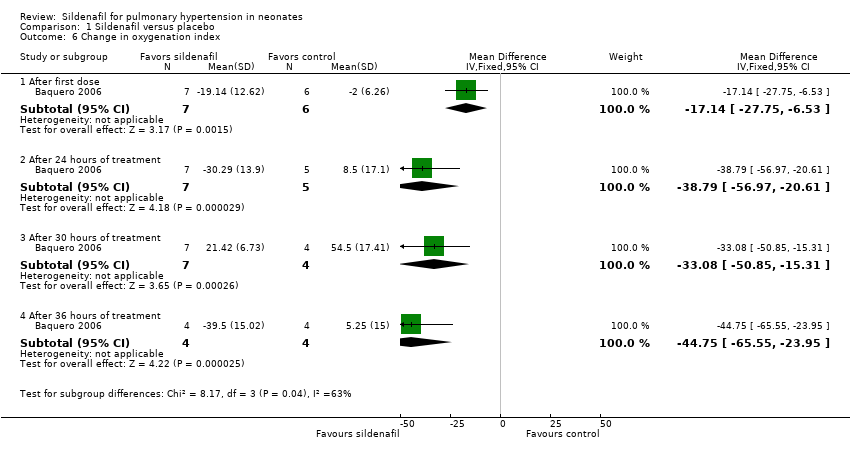
Comparison 1 Sildenafil versus placebo, Outcome 6 Change in oxygenation index.

Comparison 1 Sildenafil versus placebo, Outcome 7 A‐a DO2 difference.

Comparison 1 Sildenafil versus placebo, Outcome 8 Mean airway pressure.
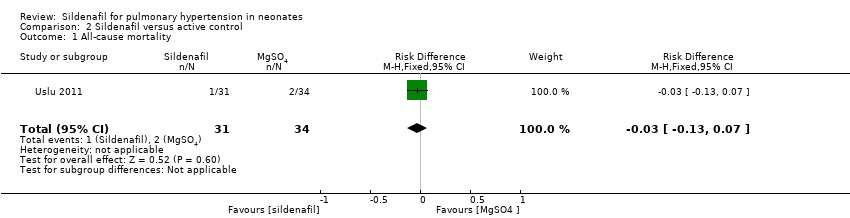
Comparison 2 Sildenafil versus active control, Outcome 1 All‐cause mortality.
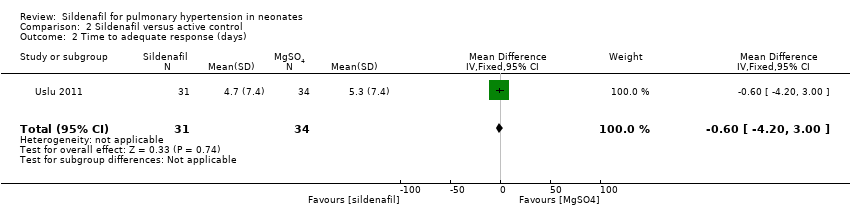
Comparison 2 Sildenafil versus active control, Outcome 2 Time to adequate response (days).
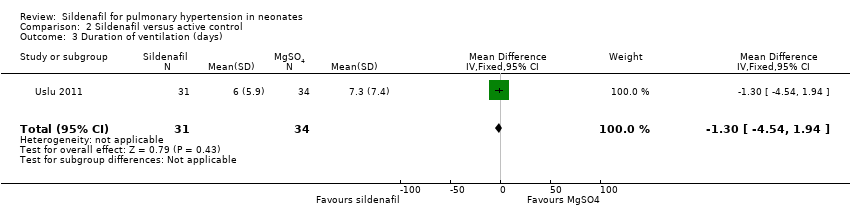
Comparison 2 Sildenafil versus active control, Outcome 3 Duration of ventilation (days).

Comparison 2 Sildenafil versus active control, Outcome 4 Inotropic agent.
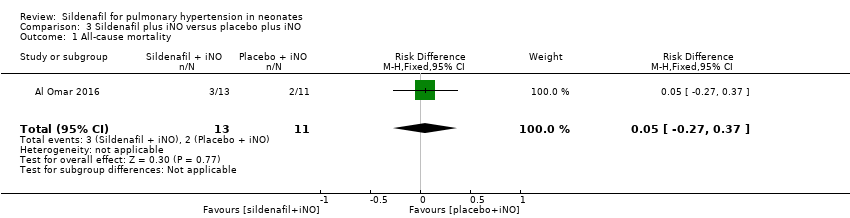
Comparison 3 Sildenafil plus iNO versus placebo plus iNO, Outcome 1 All‐cause mortality.
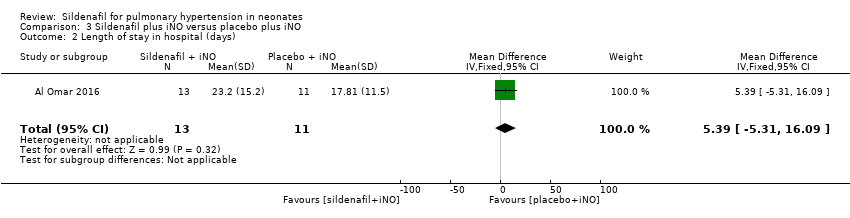
Comparison 3 Sildenafil plus iNO versus placebo plus iNO, Outcome 2 Length of stay in hospital (days).

Comparison 3 Sildenafil plus iNO versus placebo plus iNO, Outcome 3 Inotropic agent.
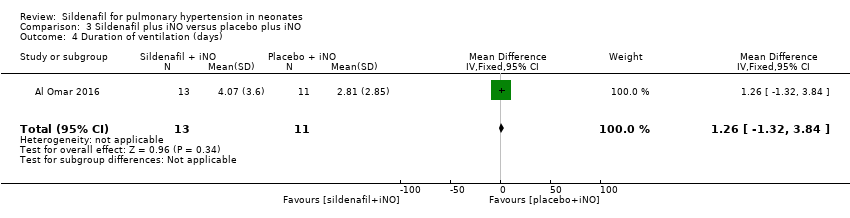
Comparison 3 Sildenafil plus iNO versus placebo plus iNO, Outcome 4 Duration of ventilation (days).

Comparison 3 Sildenafil plus iNO versus placebo plus iNO, Outcome 5 Retinopathy of prematurity.
| Sildenafil compared with placebo for pulmonary hypertension in neonates | ||||||
| Patient or population: pulmonary hypertension in neonates | ||||||
| Outcomes | Anticipated absolute effects* (95% CI) | Relative effect | No. of participants | Quality of the evidence | Comments | |
| Risk with placebo | Risk with sildenafil | |||||
| PaO2 in mmHg (absolute values) After 24‐25 hours | Mean PaO2 in mmHg (absolute values) | MD 15.31 higher | ‐ | 57 | ⊕⊕⊝⊝ | Evidence was downgraded due to unreported methodological features and imprecision (small sample size) |
| Change in oxygenation index | Mean change in oxygenation index | MD 38.79 lower | ‐ | 12 | ⊕⊕⊝⊝ | Evidence was downgraded due to unreported methodological features and imprecision (small sample size) |
| All‐cause mortality | Study population | RR 0.20 | 77 | ⊕⊕⊝⊝ | Evidence was downgraded due to unreported methodological features and imprecision (small sample size) | |
| 432 per 1000 | 77 per 1000 | |||||
| *The risk in the intervention group (and its 95% confidence interval) is based on assumed risk in the comparison group and relative effect of the intervention (and its 95% CI) | ||||||
| GRADE Working Group grades of evidence | ||||||
| aImprecise due to small sample size bRisk of bias due to unclear randomisation allocation and lack of clinical trial registration | ||||||
| Sildenafil compared with active control for pulmonary hypertension in neonates | ||||||
| Patient or population: pulmonary hypertension in neonates | ||||||
| Outcomes | Anticipated absolute effects* (95% CI) | Relative effect | No. of participants | Quality of the evidence | Comments | |
| Risk with magnesium sulphate | Risk with sildenafil | |||||
| All‐cause mortality | Study population | RR 0.55 | 65 | ⊕⊝⊝⊝ | Evidence was downgraded due to very serious imprecision, as results from this single study have not been replicated and risk of bias is evident in study design (missing data) | |
| 59 per 1000 | 32 per 1000 | |||||
| *The risk in the intervention group (and its 95% confidence interval) is based on assumed risk in the comparison group and relative effect of the intervention (and its 95% CI) | ||||||
| GRADE Working Group grades of evidence | ||||||
| aImprecise due to small sample size; only one included study bRisk of bias due to missing data (not analysed as intent to treat) | ||||||
| Sildenafil plus iNO compared with placebo plus iNO for pulmonary hypertension in neonates | ||||||
| Patient or population: pulmonary hypertension in neonates | ||||||
| Outcomes | Anticipated absolute effects* (95% CI) | Relative effect | No. of participants | Quality of the evidence | Comments | |
| Risk with placebo plus iNO | Risk with sildenafil plus iNO | |||||
| All‐cause mortality | Study population | RR 1.27 | 24 | ⊕⊕⊝⊝ | Evidence was downgraded due to imprecision . | |
| 182 per 1000 | 231 per 1000 | |||||
| Length of stay in hospital (days) | Mean length of stay in hospital was 17.81 days. | MD 5.39 higher | ‐ | 24 | ⊕⊕⊝⊝ | Evidence was downgraded due to imprecision . |
| *The risk in the intervention group (and its 95% confidence interval) is based on assumed risk in the comparison group and relative effect of the intervention (and its 95% CI) | ||||||
| GRADE Working Group grades of evidence | ||||||
| aImprecise due to very small sample size; only one included study | ||||||
| Outcome or subgroup title | No. of studies | No. of participants | Statistical method | Effect size |
| 1 Pulmonary arterial pressure Show forest plot | 1 | Mean Difference (IV, Fixed, 95% CI) | Subtotals only | |
| 1.1 Baseline | 1 | 40 | Mean Difference (IV, Fixed, 95% CI) | 1.10 [‐7.68, 9.88] |
| 2 PaO2 in mmHg (absolute values) Show forest plot | 2 | Mean Difference (IV, Fixed, 95% CI) | Subtotals only | |
| 2.1 At baseline | 2 | 64 | Mean Difference (IV, Fixed, 95% CI) | 8.06 [1.58, 14.54] |
| 2.2 After first dose | 2 | 64 | Mean Difference (IV, Fixed, 95% CI) | 11.09 [1.65, 20.52] |
| 2.3 After 6 to 7 hours of treatment | 2 | 64 | Mean Difference (IV, Fixed, 95% CI) | 14.30 [5.25, 23.34] |
| 2.4 After 24 to 25 hours of treatment | 2 | 58 | Mean Difference (IV, Fixed, 95% CI) | 15.31 [6.49, 24.13] |
| 2.5 After 72 hours or at the end of treatment | 1 | 24 | Mean Difference (IV, Fixed, 95% CI) | 20.98 [14.81, 27.15] |
| 3 Mean arterial blood pressure in mmHg Show forest plot | 2 | Mean Difference (IV, Fixed, 95% CI) | Subtotals only | |
| 3.1 Before initiation of therapy | 2 | 53 | Mean Difference (IV, Fixed, 95% CI) | 5.65 [2.69, 8.61] |
| 3.2 At the end of therapy | 2 | 40 | Mean Difference (IV, Fixed, 95% CI) | 22.70 [1.23, 44.17] |
| 4 All‐cause mortality Show forest plot | 3 | 77 | Risk Difference (M‐H, Fixed, 95% CI) | ‐0.36 [‐0.53, ‐0.18] |
| 5 Oxygenation index (absolute values) Show forest plot | 3 | Mean Difference (IV, Fixed, 95% CI) | Subtotals only | |
| 5.1 At baseline | 3 | 77 | Mean Difference (IV, Fixed, 95% CI) | ‐0.74 [‐8.11, 6.64] |
| 5.2 After first dose | 3 | 77 | Mean Difference (IV, Fixed, 95% CI) | ‐12.53 [‐18.60, ‐6.47] |
| 5.3 After 6 to 7 hours of treatment | 2 | 75 | Mean Difference (IV, Fixed, 95% CI) | ‐20.07 [‐26.12, ‐14.02] |
| 5.4 After 24 to 25 hours of treatment | 3 | 69 | Mean Difference (IV, Fixed, 95% CI) | ‐19.15 [‐24.52, ‐13.77] |
| 5.5 After 30 hours of treatment | 1 | 11 | Mean Difference (IV, Fixed, 95% CI) | ‐45.46 [‐61.87, ‐29.05] |
| 5.6 After 36 hours of treatment | 1 | 8 | Mean Difference (IV, Fixed, 95% CI) | ‐31.75 [‐45.74, ‐17.76] |
| 5.7 After 72 hours or at the end of treatment | 1 | 24 | Mean Difference (IV, Fixed, 95% CI) | ‐19.47 [‐23.42, ‐15.52] |
| 6 Change in oxygenation index Show forest plot | 1 | Mean Difference (IV, Fixed, 95% CI) | Subtotals only | |
| 6.1 After first dose | 1 | 13 | Mean Difference (IV, Fixed, 95% CI) | ‐17.14 [‐27.75, ‐6.53] |
| 6.2 After 24 hours of treatment | 1 | 12 | Mean Difference (IV, Fixed, 95% CI) | ‐38.79 [‐56.97, ‐20.61] |
| 6.3 After 30 hours of treatment | 1 | 11 | Mean Difference (IV, Fixed, 95% CI) | ‐33.08 [‐50.85, ‐15.31] |
| 6.4 After 36 hours of treatment | 1 | 8 | Mean Difference (IV, Fixed, 95% CI) | ‐44.75 [‐65.55, ‐23.95] |
| 7 A‐a DO2 difference Show forest plot | 2 | Mean Difference (IV, Fixed, 95% CI) | Subtotals only | |
| 7.1 Baseline | 2 | 64 | Mean Difference (IV, Fixed, 95% CI) | 0.99 [‐11.54, 13.51] |
| 7.2 At 6 to 7 hours of treatment | 1 | 24 | Mean Difference (IV, Fixed, 95% CI) | 0.01 [‐27.72, 27.74] |
| 7.3 At 24 to 25 hours of treament | 2 | 57 | Mean Difference (IV, Fixed, 95% CI) | 1.59 [‐18.98, 22.16] |
| 7.4 At 72 hours or at the end of treatment | 1 | 24 | Mean Difference (IV, Fixed, 95% CI) | ‐18.34 [‐26.59, ‐10.09] |
| 8 Mean airway pressure Show forest plot | 2 | Mean Difference (IV, Fixed, 95% CI) | Subtotals only | |
| 8.1 Baseline | 2 | 64 | Mean Difference (IV, Fixed, 95% CI) | ‐2.09 [‐3.30, ‐0.88] |
| 8.2 At 6 to 7 hours of treatment | 2 | 63 | Mean Difference (IV, Fixed, 95% CI) | ‐5.94 [‐7.36, ‐4.52] |
| 8.3 At 24 to 25 hours of treatment | 2 | 57 | Mean Difference (IV, Fixed, 95% CI) | ‐6.64 [‐8.49, ‐4.80] |
| 8.4 At 72 hours or at the end of treatment | 1 | 24 | Mean Difference (IV, Fixed, 95% CI) | ‐8.58 [‐10.37, ‐6.79] |
| Outcome or subgroup title | No. of studies | No. of participants | Statistical method | Effect size |
| 1 All‐cause mortality Show forest plot | 1 | 65 | Risk Difference (M‐H, Fixed, 95% CI) | ‐0.03 [‐0.13, 0.07] |
| 2 Time to adequate response (days) Show forest plot | 1 | 65 | Mean Difference (IV, Fixed, 95% CI) | ‐0.60 [‐4.20, 3.00] |
| 3 Duration of ventilation (days) Show forest plot | 1 | 65 | Mean Difference (IV, Fixed, 95% CI) | ‐1.30 [‐4.54, 1.94] |
| 4 Inotropic agent Show forest plot | 1 | 65 | Risk Difference (M‐H, Fixed, 95% CI) | ‐0.37 [‐0.59, ‐0.15] |
| Outcome or subgroup title | No. of studies | No. of participants | Statistical method | Effect size |
| 1 All‐cause mortality Show forest plot | 1 | 24 | Risk Difference (M‐H, Fixed, 95% CI) | 0.05 [‐0.27, 0.37] |
| 2 Length of stay in hospital (days) Show forest plot | 1 | 24 | Mean Difference (IV, Fixed, 95% CI) | 5.39 [‐5.31, 16.09] |
| 3 Inotropic agent Show forest plot | 1 | 24 | Risk Ratio (M‐H, Fixed, 95% CI) | 1.06 [0.37, 3.00] |
| 4 Duration of ventilation (days) Show forest plot | 1 | 24 | Mean Difference (IV, Fixed, 95% CI) | 1.26 [‐1.32, 3.84] |
| 5 Retinopathy of prematurity Show forest plot | 1 | 24 | Odds Ratio (M‐H, Fixed, 95% CI) | 0.0 [0.0, 0.0] |