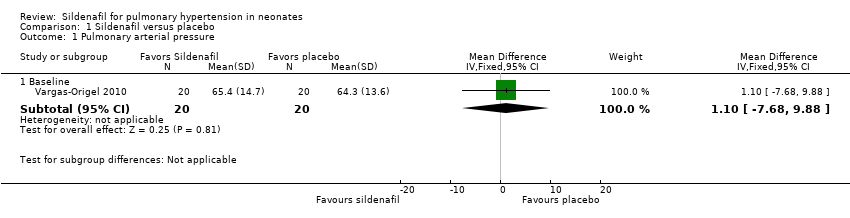
| 1 Pulmonary arterial pressure Show forest plot | 1 | | Mean Difference (IV, Fixed, 95% CI) | Subtotals only |
|
| 1.1 Baseline | 1 | 40 | Mean Difference (IV, Fixed, 95% CI) | 1.10 [‐7.68, 9.88] |
| 2 PaO2 in mmHg (absolute values) Show forest plot | 2 | | Mean Difference (IV, Fixed, 95% CI) | Subtotals only |
|
| 2.1 At baseline | 2 | 64 | Mean Difference (IV, Fixed, 95% CI) | 8.06 [1.58, 14.54] |
| 2.2 After first dose | 2 | 64 | Mean Difference (IV, Fixed, 95% CI) | 11.09 [1.65, 20.52] |
| 2.3 After 6 to 7 hours of treatment | 2 | 64 | Mean Difference (IV, Fixed, 95% CI) | 14.30 [5.25, 23.34] |
| 2.4 After 24 to 25 hours of treatment | 2 | 58 | Mean Difference (IV, Fixed, 95% CI) | 15.31 [6.49, 24.13] |
| 2.5 After 72 hours or at the end of treatment | 1 | 24 | Mean Difference (IV, Fixed, 95% CI) | 20.98 [14.81, 27.15] |
| 3 Mean arterial blood pressure in mmHg Show forest plot | 2 | | Mean Difference (IV, Fixed, 95% CI) | Subtotals only |
|
| 3.1 Before initiation of therapy | 2 | 53 | Mean Difference (IV, Fixed, 95% CI) | 5.65 [2.69, 8.61] |
| 3.2 At the end of therapy | 2 | 40 | Mean Difference (IV, Fixed, 95% CI) | 22.70 [1.23, 44.17] |
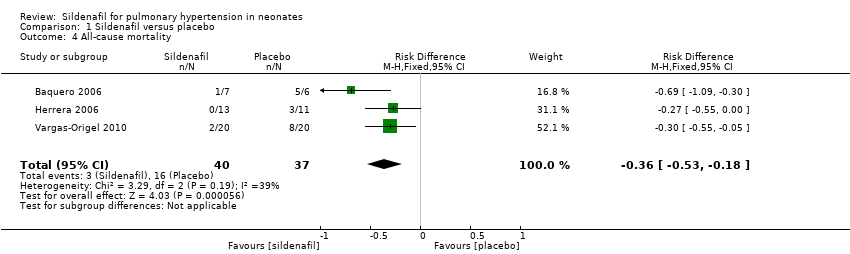
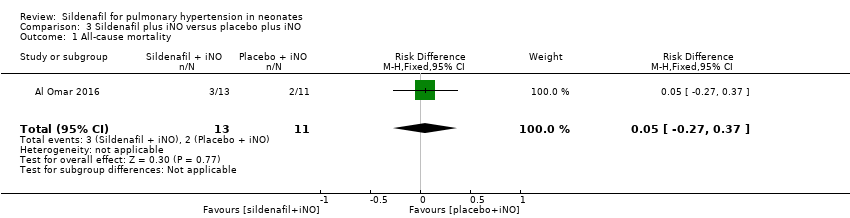
| 4 All‐cause mortality Show forest plot | 3 | 77 | Risk Difference (M‐H, Fixed, 95% CI) | ‐0.36 [‐0.53, ‐0.18] |
|
| 5 Oxygenation index (absolute values) Show forest plot | 3 | | Mean Difference (IV, Fixed, 95% CI) | Subtotals only |
|
| 5.1 At baseline | 3 | 77 | Mean Difference (IV, Fixed, 95% CI) | ‐0.74 [‐8.11, 6.64] |
| 5.2 After first dose | 3 | 77 | Mean Difference (IV, Fixed, 95% CI) | ‐12.53 [‐18.60, ‐6.47] |
| 5.3 After 6 to 7 hours of treatment | 2 | 75 | Mean Difference (IV, Fixed, 95% CI) | ‐20.07 [‐26.12, ‐14.02] |
| 5.4 After 24 to 25 hours of treatment | 3 | 69 | Mean Difference (IV, Fixed, 95% CI) | ‐19.15 [‐24.52, ‐13.77] |
| 5.5 After 30 hours of treatment | 1 | 11 | Mean Difference (IV, Fixed, 95% CI) | ‐45.46 [‐61.87, ‐29.05] |
| 5.6 After 36 hours of treatment | 1 | 8 | Mean Difference (IV, Fixed, 95% CI) | ‐31.75 [‐45.74, ‐17.76] |
| 5.7 After 72 hours or at the end of treatment | 1 | 24 | Mean Difference (IV, Fixed, 95% CI) | ‐19.47 [‐23.42, ‐15.52] |
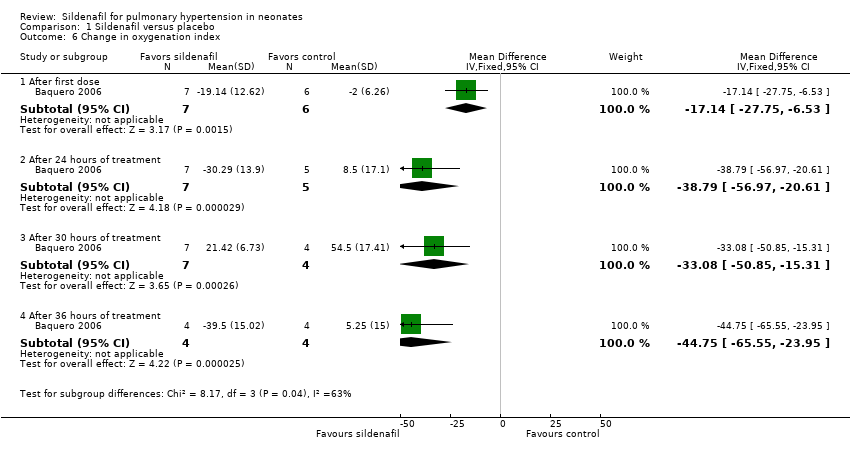
| 6 Change in oxygenation index Show forest plot | 1 | | Mean Difference (IV, Fixed, 95% CI) | Subtotals only |
|
| 6.1 After first dose | 1 | 13 | Mean Difference (IV, Fixed, 95% CI) | ‐17.14 [‐27.75, ‐6.53] |
| 6.2 After 24 hours of treatment | 1 | 12 | Mean Difference (IV, Fixed, 95% CI) | ‐38.79 [‐56.97, ‐20.61] |
| 6.3 After 30 hours of treatment | 1 | 11 | Mean Difference (IV, Fixed, 95% CI) | ‐33.08 [‐50.85, ‐15.31] |
| 6.4 After 36 hours of treatment | 1 | 8 | Mean Difference (IV, Fixed, 95% CI) | ‐44.75 [‐65.55, ‐23.95] |
| 7 A‐a DO2 difference Show forest plot | 2 | | Mean Difference (IV, Fixed, 95% CI) | Subtotals only |
|
| 7.1 Baseline | 2 | 64 | Mean Difference (IV, Fixed, 95% CI) | 0.99 [‐11.54, 13.51] |
| 7.2 At 6 to 7 hours of treatment | 1 | 24 | Mean Difference (IV, Fixed, 95% CI) | 0.01 [‐27.72, 27.74] |
| 7.3 At 24 to 25 hours of treament | 2 | 57 | Mean Difference (IV, Fixed, 95% CI) | 1.59 [‐18.98, 22.16] |
| 7.4 At 72 hours or at the end of treatment | 1 | 24 | Mean Difference (IV, Fixed, 95% CI) | ‐18.34 [‐26.59, ‐10.09] |
| 8 Mean airway pressure Show forest plot | 2 | | Mean Difference (IV, Fixed, 95% CI) | Subtotals only |
|
| 8.1 Baseline | 2 | 64 | Mean Difference (IV, Fixed, 95% CI) | ‐2.09 [‐3.30, ‐0.88] |
| 8.2 At 6 to 7 hours of treatment | 2 | 63 | Mean Difference (IV, Fixed, 95% CI) | ‐5.94 [‐7.36, ‐4.52] |
| 8.3 At 24 to 25 hours of treatment | 2 | 57 | Mean Difference (IV, Fixed, 95% CI) | ‐6.64 [‐8.49, ‐4.80] |
| 8.4 At 72 hours or at the end of treatment | 1 | 24 | Mean Difference (IV, Fixed, 95% CI) | ‐8.58 [‐10.37, ‐6.79] |