Agentes hipolipemiantes para el síndrome nefrótico
Información
- DOI:
- https://doi.org/10.1002/14651858.CD005425.pub2Copiar DOI

- Base de datos:
-
- Cochrane Database of Systematic Reviews
- Versión publicada:
-
- 10 diciembre 2013see what's new
- Tipo:
-
- Intervention
- Etapa:
-
- Review
- Grupo Editorial Cochrane:
-
Grupo Cochrane de Riñón y trasplante
- Copyright:
-
- Copyright © 2013 The Cochrane Collaboration. Published by John Wiley & Sons, Ltd.
Cifras del artículo
Altmetric:
Citado por:
Autores
Contributions of authors
-
Kong Xiangyu: searching for studies, studies selection, quality assessment of studies, data extraction, data analysis.
-
Yuan Hao: searching for studies, studies selection, quality assessment of studies, data extraction, data analysis.
-
Wu Taixiang: protocol development, quality assessment of studies, data extraction, data analysis, critical revision of protocol.
-
Fan Junming: quality assessment of studies, data analysis, critical revision of protocol
-
Li Zi: quality assessment of studies, data analysis, critical revision of protocol
-
Jiang Lanhui: quality assessment of studies, checking English writing.
Sources of support
Internal sources
-
Chinese Cochrane Centre, West China Hospital of Sichuan University, China.
External sources
-
No sources of support supplied
Declarations of interest
None known.
Acknowledgements
We thank the Cochrane Renal Group for their assistance in the development of our search strategies, and the referees for their comments and feedback during the preparation of this review.
Version history
| Published | Title | Stage | Authors | Version |
| 2013 Dec 10 | Lipid‐lowering agents for nephrotic syndrome | Review | Xiangyu Kong, Hao Yuan, Junming Fan, Zi Li, Taixiang Wu, Lanhui Jiang | |
| 2005 Jul 20 | Lipid‐lowering agents for nephrotic syndrome | Protocol | Junming Fan, Zi Li, Taixiang Wu, Haiyan Chen | |
Differences between protocol and review
-
The Cochrane Renal Group’s Specialised Register includes weekly Ovid MEDLINE AutoAlerts and regular searching of Ovid SP EMBASE, we did not search MEDLINE or EMBASE for this review.
-
In compliance with current Cochrane methodology, the quality checklist indicated in the protocol was replaced by risk of bias assessment.
Keywords
MeSH
Medical Subject Headings (MeSH) Keywords
- Fatty Acids, Monounsaturated [therapeutic use];
- Fluvastatin;
- Gemfibrozil [therapeutic use];
- Hydroxymethylglutaryl-CoA Reductase Inhibitors [therapeutic use];
- Hypolipidemic Agents [therapeutic use];
- Indoles [therapeutic use];
- Lovastatin [therapeutic use];
- Nephrotic Syndrome [*drug therapy];
- Randomized Controlled Trials as Topic;
- Simvastatin [therapeutic use];
Medical Subject Headings Check Words
Adult; Child; Humans;
PICO
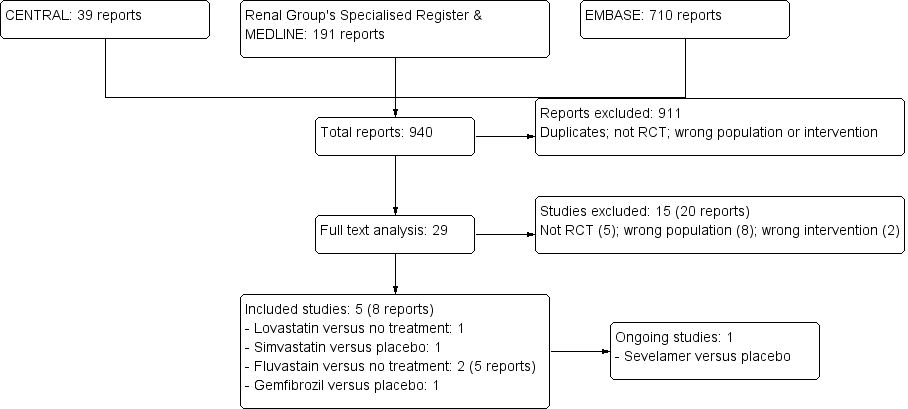
Study selection flow diagram

Risk of bias graph: review authors' judgements about each risk of bias item presented as percentages across all included studies

Risk of bias summary: review authors' judgements about each risk of bias item for each included study
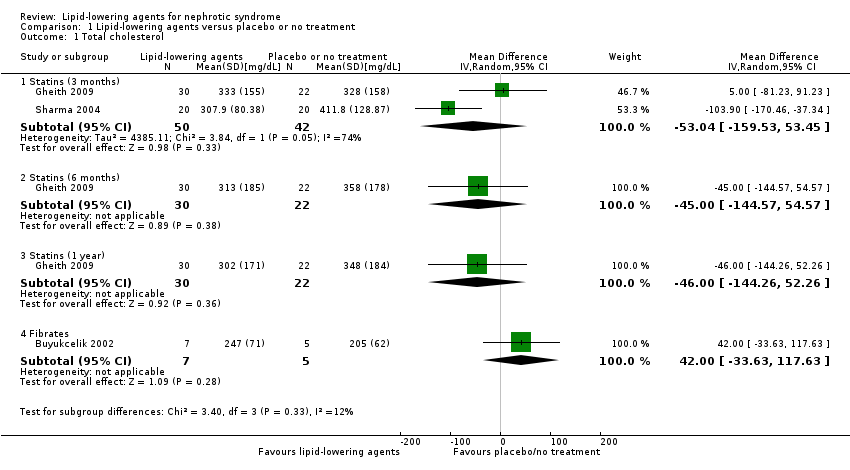
Comparison 1 Lipid‐lowering agents versus placebo or no treatment, Outcome 1 Total cholesterol.

Comparison 1 Lipid‐lowering agents versus placebo or no treatment, Outcome 2 LDL cholesterol.
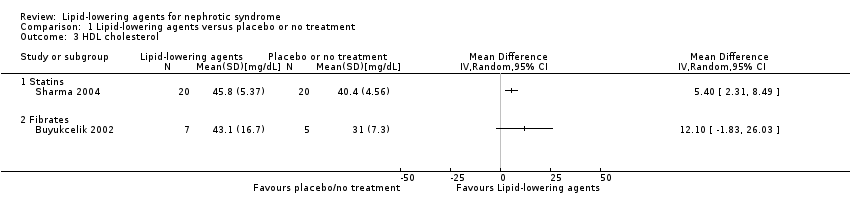
Comparison 1 Lipid‐lowering agents versus placebo or no treatment, Outcome 3 HDL cholesterol.

Comparison 1 Lipid‐lowering agents versus placebo or no treatment, Outcome 4 Triglyceride.

Comparison 1 Lipid‐lowering agents versus placebo or no treatment, Outcome 5 Serum creatinine.
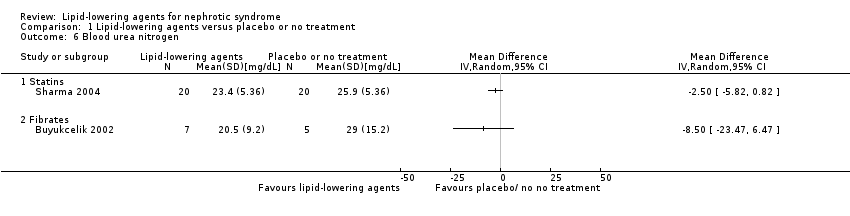
Comparison 1 Lipid‐lowering agents versus placebo or no treatment, Outcome 6 Blood urea nitrogen.

Comparison 1 Lipid‐lowering agents versus placebo or no treatment, Outcome 7 Proteinuria.
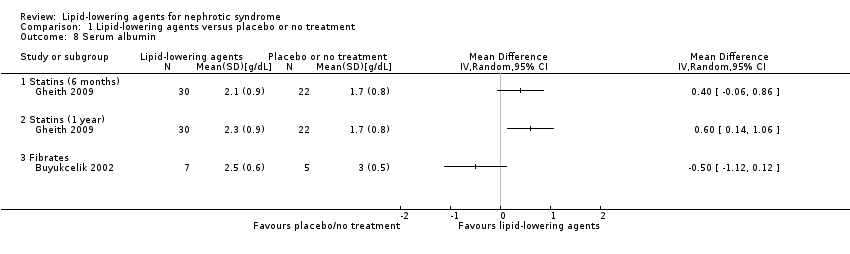
Comparison 1 Lipid‐lowering agents versus placebo or no treatment, Outcome 8 Serum albumin.

Comparison 1 Lipid‐lowering agents versus placebo or no treatment, Outcome 9 Total serum protein.

Comparison 1 Lipid‐lowering agents versus placebo or no treatment, Outcome 10 Apolipoprotein A.

Comparison 1 Lipid‐lowering agents versus placebo or no treatment, Outcome 11 Apolipoprotein B.

Comparison 1 Lipid‐lowering agents versus placebo or no treatment, Outcome 12 Elevated liver enzymes.

Comparison 1 Lipid‐lowering agents versus placebo or no treatment, Outcome 13 Alanine aminotransferase.

Comparison 1 Lipid‐lowering agents versus placebo or no treatment, Outcome 14 Aspartate aminotransferase.

Comparison 1 Lipid‐lowering agents versus placebo or no treatment, Outcome 15 Creatine phosphokinase.
| Outcome or subgroup title | No. of studies | No. of participants | Statistical method | Effect size |
| 1 Total cholesterol Show forest plot | 3 | Mean Difference (IV, Random, 95% CI) | Subtotals only | |
| 1.1 Statins (3 months) | 2 | 92 | Mean Difference (IV, Random, 95% CI) | ‐53.04 [‐159.53, 53.45] |
| 1.2 Statins (6 months) | 1 | 52 | Mean Difference (IV, Random, 95% CI) | ‐45.0 [‐144.57, 54.57] |
| 1.3 Statins (1 year) | 1 | 52 | Mean Difference (IV, Random, 95% CI) | ‐46.0 [‐144.26, 52.26] |
| 1.4 Fibrates | 1 | 12 | Mean Difference (IV, Random, 95% CI) | 42.0 [‐33.63, 117.63] |
| 2 LDL cholesterol Show forest plot | 2 | Mean Difference (IV, Random, 95% CI) | Totals not selected | |
| 2.1 Statins | 1 | Mean Difference (IV, Random, 95% CI) | 0.0 [0.0, 0.0] | |
| 2.2 Fibrates | 1 | Mean Difference (IV, Random, 95% CI) | 0.0 [0.0, 0.0] | |
| 3 HDL cholesterol Show forest plot | 2 | Mean Difference (IV, Random, 95% CI) | Totals not selected | |
| 3.1 Statins | 1 | Mean Difference (IV, Random, 95% CI) | 0.0 [0.0, 0.0] | |
| 3.2 Fibrates | 1 | Mean Difference (IV, Random, 95% CI) | 0.0 [0.0, 0.0] | |
| 4 Triglyceride Show forest plot | 2 | Mean Difference (IV, Random, 95% CI) | Totals not selected | |
| 4.1 Statins | 1 | Mean Difference (IV, Random, 95% CI) | 0.0 [0.0, 0.0] | |
| 4.2 Fibrates | 1 | Mean Difference (IV, Random, 95% CI) | 0.0 [0.0, 0.0] | |
| 5 Serum creatinine Show forest plot | 3 | Mean Difference (IV, Random, 95% CI) | Totals not selected | |
| 5.1 Statins (3 months) | 1 | Mean Difference (IV, Random, 95% CI) | 0.0 [0.0, 0.0] | |
| 5.2 Statins (6 months) | 1 | Mean Difference (IV, Random, 95% CI) | 0.0 [0.0, 0.0] | |
| 5.3 Statins (1 year) | 1 | Mean Difference (IV, Random, 95% CI) | 0.0 [0.0, 0.0] | |
| 5.4 Fibrates | 1 | Mean Difference (IV, Random, 95% CI) | 0.0 [0.0, 0.0] | |
| 6 Blood urea nitrogen Show forest plot | 2 | Mean Difference (IV, Random, 95% CI) | Totals not selected | |
| 6.1 Statins | 1 | Mean Difference (IV, Random, 95% CI) | 0.0 [0.0, 0.0] | |
| 6.2 Fibrates | 1 | Mean Difference (IV, Random, 95% CI) | 0.0 [0.0, 0.0] | |
| 7 Proteinuria Show forest plot | 2 | Std. Mean Difference (IV, Random, 95% CI) | Totals not selected | |
| 7.1 Statins | 1 | Std. Mean Difference (IV, Random, 95% CI) | 0.0 [0.0, 0.0] | |
| 7.2 Fibrates | 1 | Std. Mean Difference (IV, Random, 95% CI) | 0.0 [0.0, 0.0] | |
| 8 Serum albumin Show forest plot | 2 | Mean Difference (IV, Random, 95% CI) | Totals not selected | |
| 8.1 Statins (6 months) | 1 | Mean Difference (IV, Random, 95% CI) | 0.0 [0.0, 0.0] | |
| 8.2 Statins (1 year) | 1 | Mean Difference (IV, Random, 95% CI) | 0.0 [0.0, 0.0] | |
| 8.3 Fibrates | 1 | Mean Difference (IV, Random, 95% CI) | 0.0 [0.0, 0.0] | |
| 9 Total serum protein Show forest plot | 1 | Mean Difference (IV, Random, 95% CI) | Totals not selected | |
| 9.1 Fibrates | 1 | Mean Difference (IV, Random, 95% CI) | 0.0 [0.0, 0.0] | |
| 10 Apolipoprotein A Show forest plot | 1 | Mean Difference (IV, Random, 95% CI) | Totals not selected | |
| 10.1 Fibrates | 1 | Mean Difference (IV, Random, 95% CI) | 0.0 [0.0, 0.0] | |
| 11 Apolipoprotein B Show forest plot | 1 | Mean Difference (IV, Random, 95% CI) | Totals not selected | |
| 11.1 Fibrates | 1 | Mean Difference (IV, Random, 95% CI) | 0.0 [0.0, 0.0] | |
| 12 Elevated liver enzymes Show forest plot | 1 | Risk Ratio (M‐H, Random, 95% CI) | Totals not selected | |
| 12.1 Statins | 1 | Risk Ratio (M‐H, Random, 95% CI) | 0.0 [0.0, 0.0] | |
| 13 Alanine aminotransferase Show forest plot | 1 | Mean Difference (IV, Random, 95% CI) | Totals not selected | |
| 13.1 Fibrates | 1 | Mean Difference (IV, Random, 95% CI) | 0.0 [0.0, 0.0] | |
| 14 Aspartate aminotransferase Show forest plot | 1 | Mean Difference (IV, Random, 95% CI) | Totals not selected | |
| 14.1 Fibrates | 1 | Mean Difference (IV, Random, 95% CI) | 0.0 [0.0, 0.0] | |
| 15 Creatine phosphokinase Show forest plot | 1 | Mean Difference (IV, Random, 95% CI) | Totals not selected | |
| 15.1 Fibrates | 1 | Mean Difference (IV, Random, 95% CI) | 0.0 [0.0, 0.0] | |