Tratamiento con inhibidores de la bomba de protones iniciado antes del diagnóstico endoscópico en la hemorragia digestiva alta
Appendices
Appendix 1. CENTRAL search strategy
EBM Reviews ‐ CDSR (2005 to 11 October 2017) and CCRCT (September 2017)
-
exp Gastrointestinal Hemorrhage/
-
(UGIB or NVUGIB or upper GIB).tw,kw.
-
exp Stomach Ulcer/
-
exp duodenal ulcer/
-
exp gastroduodenal ulcer/
-
(stomach or fundus or fundal or antrum or antral or pyloric or pylorus or gastric or duodenum or duodenal).tw,kw.
-
(gastro* or oesophag* or esophag*).tw,kw.
-
exp Peptic Ulcer/
-
peptic ulcer*.tw,kw.
-
exp upper gastrointestinal tract/
-
(non‐variceal or non variceal or nonvariceal or upper GI or UGI).tw,kw.
-
or/3‐11
-
(bleed* or re‐bleed* or rebleed* or hemorrhag* or haemorrhag*).mp.
-
exp Hemorrhage/
-
(melena or melaena or hematemesis or heamatemesis).tw,kw.
-
or/13‐15
-
12 and 16
-
1 or 2 or 17
-
exp Proton Pump Inhibitors/
-
proton pump inhibitor*.mp.
-
(PPI or PPIs).tw,kw.
-
exp Omeprazole/
-
(omeprazole or h 16868 or losec or prilosec or rapinex or zegerid).mp.
-
exp Lansoprazole/
-
(lansoprazole or lanzoprazole or ag 1749 or agopton or bamalite or lanzor or monolitum or ogast or ogastro or opiren or prevacid or prezal or pro ulco or promeco or takepron or ulpax or zoton).mp.
-
(pantoprazole or by 1023 or protium or protonix or skf‐96022).mp.
-
exp esomeprazole/
-
(esomeprazole or nexium).mp.
-
exp Rabeprazole/
-
(rabeprazole or aciphex or dexrabeprazole or e 3810 or ly‐307640 or pariet).mp.
-
(dexlansoprazole or Kapidex or Dexilant or AGN 20194* or AGN20194* or dexrabeprazole).mp.
-
exp Dexlansoprazole/
-
(tenatoprazole or CAS 113712‐98‐4 or STU‐Na or TAK‐390* or TAK390* or TAK‐438 or TAK438 or AZD0865 or "AZD 0865").mp.
-
or/19‐33
-
18 and 34
-
remove duplicates from 35
Appendix 2. MEDLINE search strategy
Database: OVID Medline Epub Ahead of Print, In‐Process & Other Non‐Indexed Citations, Ovid MEDLINE(R) Daily and Ovid MEDLINE(R) 1946 to Present
-
randomized controlled trial.pt.
-
controlled clinical trial.pt.
-
random*.ab.
-
placebo.ab.
-
drug therapy.fs.
-
trial.ab.
-
groups.ab.
-
or/1‐7
-
exp animals/ not humans/
-
8 not 9
-
exp Gastrointestinal Hemorrhage/
-
(UGIB or NVUGIB or upper GIB or "PUB" or "PUBs").tw,kw.
-
(stomach or fundus or fundal or antrum or antral or pyloric or pylorus or gastric or duodenum or duodenal).tw,kw.
-
(gastro* or oesophag* or esophag*).tw,kw.
-
exp Peptic Ulcer/
-
peptic ulcer*.tw,kw.
-
exp upper gastrointestinal tract/
-
(non‐variceal or non variceal or nonvariceal or upper GI or UGI).tw,kw.
-
or/13‐18
-
(bleed* or re‐bleed* or rebleed* or hemorrhag* or haemorrhag*).mp.
-
exp Hemorrhage/
-
(melena or melaena or hematemesis or heamatemesis).tw,kw.
-
or/20‐22
-
19 and 23
-
11 or 12 or 24
-
exp Proton Pump Inhibitors/
-
proton pump inhibitor*.mp.
-
(PPI or PPIs).tw,kw.
-
(omeprazole or h 16868 or losec or prilosec or rapinex or zegerid).mp.
-
(lansoprazole or lanzoprazole or ag 1749 or agopton or bamalite or lanzor or monolitum or ogast or ogastro or opiren or prevacid or prezal or pro ulco or promeco or takepron or ulpax or zoton).mp.
-
(pantoprazole or by 1023 or protium or protonix or skf‐96022).mp.
-
(esomeprazole or nexium).mp.
-
(rabeprazole or aciphex or dexrabeprazole or e 3810 or ly‐307640 or pariet).mp.
-
(dexlansoprazole or Kapidex or Dexilant or AGN 20194* or AGN20194* or dexrabeprazole).mp.
-
(tenatoprazole or CAS 113712‐98‐4 or STU‐Na or TAK‐390* or TAK390* or TAK‐438 or TAK438 or AZD0865 or "AZD 0865").mp.
-
or/26‐35
-
25 and 36
-
10 and 37
Note: Lines 1‐10. “Cochrane Highly Sensitive Search Strategy for identifying randomized trials in MEDLINE: sensitivity‐maximizing version (2008 revision); Ovid format”. We made the following minor revisions: we used “random*” instead of “randomized.ab” or “randomly.ab.” to capture word variations such as “randomised, randomization, random”.
Appendix 3. Embase search strategy
-
random:.tw.
-
placebo:.mp.
-
double‐blind:.tw.
-
or/1‐3
-
exp animal/ not human/
-
4 not 5
-
exp gastrointestinal hemorrhage/
-
(UGIB or NVUGIB or upper GIB or "PUB" or "PUBs").tw,kw.
-
(stomach or fundus or fundal or antrum or antral or pyloric or pylorus or gastric or duodenum or duodenal).tw,kw.
-
(gastro* or oesophag* or esophag*).tw,kw.
-
exp peptic ulcer/
-
peptic ulcer*.tw,kw.
-
exp upper gastrointestinal tract/
-
(non‐variceal or non variceal or nonvariceal or upper GI or UGI).tw,kw.
-
or/9‐14
-
(bleed* or re‐bleed* or rebleed* or hemorrhag* or haemorrhag*).mp.
-
exp bleeding/
-
(melena or melaena or hematemesis or heamatemesis).tw,kw.
-
or/16‐18
-
15 and 19
-
7 or 8 or 20
-
exp proton pump inhibitor/
-
proton pump inhibitor*.mp.
-
(PPI or PPIs).tw,kw.
-
(omeprazole or h 16868 or losec or prilosec or rapinex or zegerid).mp.
-
(lansoprazole or lanzoprazole or ag 1749 or agopton or bamalite or lanzor or monolitum or ogast or ogastro or opiren or prevacid or prezal or pro ulco or promeco or takepron or ulpax or zoton).mp.
-
(pantoprazole or by 1023 or protium or protonix or skf‐96022).mp.
-
(esomeprazole or nexium).mp.
-
(rabeprazole or aciphex or dexrabeprazole or e 3810 or ly‐307640 or pariet).mp.
-
(dexlansoprazole or Kapidex or Dexilant or AGN 20194* or AGN20194* or dexrabeprazole).mp.
-
(tenatoprazole or CAS 113712‐98‐4 or STU‐Na or TAK‐390* or TAK390* or TAK‐438 or TAK438 or AZD0865 or "AZD 0865").mp.
-
or/22‐31
-
21 and 32
-
6 and 33
Note: Lines 1‐3. Hedge Best balance of sensitivity and specificity filter for identifying therapeutic trials in Embase. https://hiru.mcmaster.ca/hiru/HIRU_Hedges_EMBASE_Strategies.aspx
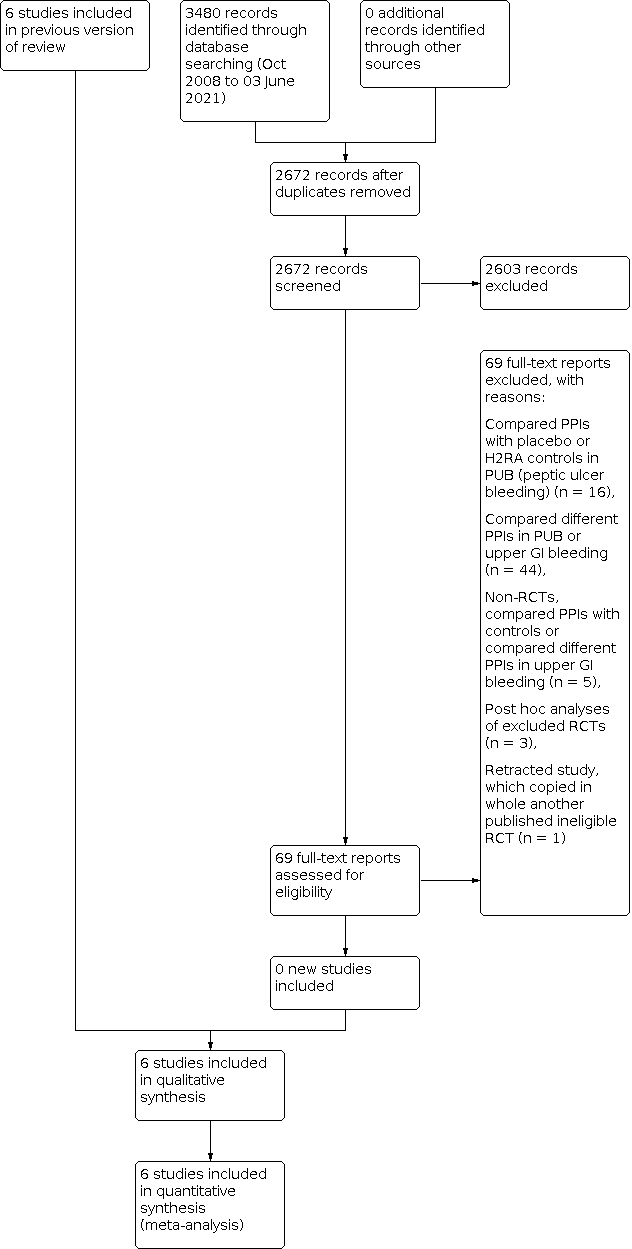
Study flow diagram: review update 03 June 2021

Risk of bias graph: review authors' judgements about each risk of bias item presented as percentages across all included studies

Risk of bias summary: review authors' judgements about each risk of bias item for each included study

Trial sequential analysis (TSA) for outcome mortality

Trial sequential analysis (TSA) for outcome rebleeding

Comparison 1: Main analysis, Outcome 1: Mortality

Comparison 1: Main analysis, Outcome 2: Rebleeding

Comparison 1: Main analysis, Outcome 3: Surgery

Comparison 1: Main analysis, Outcome 4: Participants requiring blood transfusion

Comparison 1: Main analysis, Outcome 5: Proportion of participants with stigmata of recent haemorrhage

Comparison 1: Main analysis, Outcome 6: Proportion of participants with stigmata of recent haemorrhage plus Lau 2007

Comparison 1: Main analysis, Outcome 7: Proportion of participants with blood in stomach

Comparison 1: Main analysis, Outcome 8: Proportion of participants with active bleeding

Comparison 1: Main analysis, Outcome 9: Proportion of participants with active bleeding plus Lau 2007

Comparison 1: Main analysis, Outcome 10: Endoscopic haemostatic treatment at index endoscopy

Comparison 2: Subgroup analysis according to risk of bias, Outcome 1: Mortality

Comparison 2: Subgroup analysis according to risk of bias, Outcome 2: Rebleeding

Comparison 2: Subgroup analysis according to risk of bias, Outcome 3: Surgery

Comparison 2: Subgroup analysis according to risk of bias, Outcome 4: Proportion of participants with stigmata of recent haemorrhage

Comparison 2: Subgroup analysis according to risk of bias, Outcome 5: Endoscopic haemostatic treatment at index endoscopy

Comparison 3: Subgroup analysis according to geographic location, Outcome 1: Mortality

Comparison 3: Subgroup analysis according to geographic location, Outcome 2: Rebleeding

Comparison 3: Subgroup analysis according to geographic location, Outcome 3: Surgery

Comparison 4: Subgroup analysis according to route of PPI administration, Outcome 1: Mortality

Comparison 4: Subgroup analysis according to route of PPI administration, Outcome 2: Rebleeding

Comparison 4: Subgroup analysis according to route of PPI administration, Outcome 3: Surgery

Comparison 5: Subgroup analysis according to PPI dose (high dose versus non‐high dose), Outcome 1: Mortality

Comparison 5: Subgroup analysis according to PPI dose (high dose versus non‐high dose), Outcome 2: Rebleeding

Comparison 5: Subgroup analysis according to PPI dose (high dose versus non‐high dose), Outcome 3: Surgery

Comparison 6: Subgroup analysis according to control treatment, Outcome 1: Mortality

Comparison 6: Subgroup analysis according to control treatment, Outcome 2: Rebleeding

Comparison 6: Subgroup analysis according to control treatment, Outcome 3: Surgery

Comparison 7: Subgroup analysis according to use of endoscopic haemostatic treatment at index endoscopy, Outcome 1: Mortality

Comparison 7: Subgroup analysis according to use of endoscopic haemostatic treatment at index endoscopy, Outcome 2: Rebleeding

Comparison 7: Subgroup analysis according to use of endoscopic haemostatic treatment at index endoscopy, Outcome 3: Surgery

Comparison 8: Sensitivity analysis restricted to peptic ulcer participants, Outcome 1: Mortality

Comparison 8: Sensitivity analysis restricted to peptic ulcer participants, Outcome 2: Rebleeding

Comparison 8: Sensitivity analysis restricted to peptic ulcer participants, Outcome 3: Surgery
| Main analysis: proton pump inhibitor treatment compared to H2RA, placebo or no treatment in people with upper gastrointestinal bleeding prior to endoscopic diagnosis | |||||
| Patient or population: people with upper gastrointestinal bleeding prior to endoscopic diagnosis | |||||
| Outcomes | Anticipated absolute effects* (95% CI) | Relative effect | № of participants | Certainty of the evidence | |
|---|---|---|---|---|---|
| With control treatment | With PPI treatment | ||||
| Mortality ‐ within 30 days | Study population | OR 1.14 | 2143 | ⊕⊕⊝⊝ | |
| 45 per 1000 | 6 more per 1000 | ||||
| Rebleeding ‐ within 30 days | Study population | OR 0.81 | 2121 | ⊕⊕⊝⊝ | |
| 131 per 1000 | 23 less per 1000 | ||||
| Surgery ‐ within 30 days | Study population | OR 0.91 | 2223 | ⊕⊕⊝⊝ | |
| 77 per 1000 | 6 less per 1000 | ||||
| Proportion of participants with stigmata of recent haemorrhage at index endoscopy | Study population | OR 0.80 | 1332 | ⊕⊕⊝⊝ | |
| 465 per 1000 | 42 less per 1000 | ||||
| Endoscopic haemostatic treatment at index endoscopy | Study population | OR 0.68 | 1983 | ⊕⊕⊕⊝ | |
| 118 per 1000 | 33 less per 1000 | ||||
| *The risk in the intervention group (and its 95% confidence interval) is based on the assumed risk in the comparison group and the relative effect of the intervention (and its 95% CI). | |||||
| GRADE Working Group grades of evidence | |||||
| aThe certainty of evidence for mortality was rated down one level due to serious study limitations. Two of the five studies had high risk of bias (high risk of performance bias due to lack of blinding; unclear risk of selection bias due to unclear random sequence generation and unclear allocation concealment), and two other studies had unclear risk of bias (unclear risk of selection bias due to unclear allocation concealment). Of note, if by a 'sensitivity approach' the above‐mentioned four studies were excluded, then all the evidence would be derived from one RCT at low risk of bias (Lau 2007): the effect estimate would remain similar, and there would be no study limitations, but the imprecision would further worsen and would be considered very serious (due to very wide 95% CI and only 15 events in total) requiring rating down by two levels for imprecision; therefore, the certainty of evidence would be low with either approach. | |||||
| Outcome or subgroup title | No. of studies | No. of participants | Statistical method | Effect size |
| 1.1 Mortality Show forest plot | 5 | 2143 | Risk Ratio (M‐H, Random, 95% CI) | 1.13 [0.77, 1.66] |
| 1.2 Rebleeding Show forest plot | 5 | 2121 | Odds Ratio (M‐H, Random, 95% CI) | 0.81 [0.62, 1.06] |
| 1.3 Surgery Show forest plot | 6 | 2223 | Odds Ratio (M‐H, Random, 95% CI) | 0.91 [0.65, 1.26] |
| 1.4 Participants requiring blood transfusion Show forest plot | 4 | 1512 | Odds Ratio (M‐H, Random, 95% CI) | 0.95 [0.75, 1.20] |
| 1.5 Proportion of participants with stigmata of recent haemorrhage Show forest plot | 4 | 1332 | Odds Ratio (M‐H, Random, 95% CI) | 0.80 [0.52, 1.21] |
| 1.6 Proportion of participants with stigmata of recent haemorrhage plus Lau 2007 Show forest plot | 5 | 1709 | Odds Ratio (M‐H, Random, 95% CI) | 0.68 [0.50, 0.93] |
| 1.7 Proportion of participants with blood in stomach Show forest plot | 3 | 1230 | Odds Ratio (M‐H, Random, 95% CI) | 0.64 [0.32, 1.30] |
| 1.8 Proportion of participants with active bleeding Show forest plot | 4 | 1332 | Odds Ratio (M‐H, Random, 95% CI) | 0.74 [0.53, 1.02] |
| 1.9 Proportion of participants with active bleeding plus Lau 2007 Show forest plot | 5 | 1709 | Odds Ratio (M‐H, Random, 95% CI) | 0.67 [0.47, 0.95] |
| 1.10 Endoscopic haemostatic treatment at index endoscopy Show forest plot | 3 | 1983 | Odds Ratio (M‐H, Random, 95% CI) | 0.68 [0.50, 0.93] |
| Outcome or subgroup title | No. of studies | No. of participants | Statistical method | Effect size |
| 2.1 Mortality Show forest plot | 5 | 2143 | Odds Ratio (M‐H, Random, 95% CI) | 1.14 [0.76, 1.70] |
| 2.1.1 low or unclear risk of bias | 3 | 1983 | Odds Ratio (M‐H, Random, 95% CI) | 1.20 [0.79, 1.84] |
| 2.1.2 high risk of bias | 2 | 160 | Odds Ratio (M‐H, Random, 95% CI) | 0.66 [0.18, 2.46] |
| 2.2 Rebleeding Show forest plot | 5 | 2121 | Odds Ratio (M‐H, Random, 95% CI) | 0.81 [0.62, 1.06] |
| 2.2.1 low or unclear risk of bias | 3 | 1983 | Odds Ratio (M‐H, Random, 95% CI) | 0.87 [0.65, 1.16] |
| 2.2.2 high risk of bias | 2 | 138 | Odds Ratio (M‐H, Random, 95% CI) | 0.45 [0.19, 1.03] |
| 2.3 Surgery Show forest plot | 6 | 2223 | Odds Ratio (M‐H, Random, 95% CI) | 0.91 [0.65, 1.26] |
| 2.3.1 low or unclear risk of bias | 3 | 1983 | Odds Ratio (M‐H, Random, 95% CI) | 0.90 [0.64, 1.27] |
| 2.3.2 high risk of bias | 3 | 240 | Odds Ratio (M‐H, Random, 95% CI) | 0.85 [0.22, 3.37] |
| 2.4 Proportion of participants with stigmata of recent haemorrhage Show forest plot | 4 | 1332 | Odds Ratio (M‐H, Random, 95% CI) | 0.80 [0.52, 1.21] |
| 2.4.1 low or unclear risk of bias | 2 | 1172 | Odds Ratio (M‐H, Random, 95% CI) | 0.79 [0.40, 1.55] |
| 2.4.2 high risk of bias | 2 | 160 | Odds Ratio (M‐H, Random, 95% CI) | 1.01 [0.46, 2.19] |
| 2.5 Endoscopic haemostatic treatment at index endoscopy Show forest plot | 3 | 1983 | Odds Ratio (M‐H, Random, 95% CI) | 0.68 [0.50, 0.93] |
| 2.5.1 low or unclear risk of bias | 3 | 1983 | Odds Ratio (M‐H, Random, 95% CI) | 0.68 [0.50, 0.93] |
| Outcome or subgroup title | No. of studies | No. of participants | Statistical method | Effect size |
| 3.1 Mortality Show forest plot | 5 | 2143 | Odds Ratio (M‐H, Random, 95% CI) | 1.14 [0.76, 1.70] |
| 3.1.1 Asian | 2 | 689 | Odds Ratio (M‐H, Random, 95% CI) | 1.13 [0.43, 2.96] |
| 3.1.2 Non‐Asian | 3 | 1454 | Odds Ratio (M‐H, Random, 95% CI) | 0.96 [0.48, 1.94] |
| 3.2 Rebleeding Show forest plot | 5 | 2121 | Odds Ratio (M‐H, Random, 95% CI) | 0.81 [0.62, 1.06] |
| 3.2.1 Asian | 2 | 689 | Odds Ratio (M‐H, Random, 95% CI) | 1.04 [0.45, 2.40] |
| 3.2.2 Non‐Asian | 3 | 1432 | Odds Ratio (M‐H, Random, 95% CI) | 0.78 [0.59, 1.04] |
| 3.3 Surgery Show forest plot | 6 | 2223 | Odds Ratio (M‐H, Random, 95% CI) | 0.91 [0.65, 1.26] |
| 3.3.1 Asian | 2 | 689 | Odds Ratio (M‐H, Random, 95% CI) | 0.67 [0.19, 2.39] |
| 3.3.2 Non‐Asian | 4 | 1534 | Odds Ratio (M‐H, Random, 95% CI) | 0.93 [0.66, 1.30] |
| Outcome or subgroup title | No. of studies | No. of participants | Statistical method | Effect size |
| 4.1 Mortality Show forest plot | 5 | 2143 | Odds Ratio (M‐H, Random, 95% CI) | 1.14 [0.76, 1.70] |
| 4.1.1 Oral PPI | 1 | 205 | Odds Ratio (M‐H, Random, 95% CI) | 0.39 [0.07, 2.07] |
| 4.1.2 Intravenous PPI | 4 | 1938 | Odds Ratio (M‐H, Random, 95% CI) | 1.21 [0.80, 1.85] |
| 4.2 Rebleeding Show forest plot | 5 | 2121 | Odds Ratio (M‐H, Random, 95% CI) | 0.81 [0.62, 1.06] |
| 4.2.1 Oral PPI | 1 | 205 | Odds Ratio (M‐H, Random, 95% CI) | 1.01 [0.40, 2.54] |
| 4.2.2 Intravenous PPI | 4 | 1916 | Odds Ratio (M‐H, Random, 95% CI) | 0.79 [0.55, 1.13] |
| 4.3 Surgery Show forest plot | 6 | 2223 | Odds Ratio (M‐H, Random, 95% CI) | 0.91 [0.65, 1.26] |
| 4.3.1 Oral PPI | 1 | 205 | Odds Ratio (M‐H, Random, 95% CI) | 0.49 [0.12, 2.01] |
| 4.3.2 Intravenous PPI | 5 | 2018 | Odds Ratio (M‐H, Random, 95% CI) | 0.94 [0.67, 1.31] |
| Outcome or subgroup title | No. of studies | No. of participants | Statistical method | Effect size |
| 5.1 Mortality Show forest plot | 5 | 2143 | Odds Ratio (M‐H, Random, 95% CI) | 1.14 [0.76, 1.70] |
| 5.1.1 High dose PPI | 1 | 631 | Odds Ratio (M‐H, Random, 95% CI) | 1.16 [0.41, 3.23] |
| 5.1.2 Non‐high dose PPI | 4 | 1512 | Odds Ratio (M‐H, Random, 95% CI) | 1.13 [0.73, 1.76] |
| 5.2 Rebleeding Show forest plot | 5 | 2121 | Odds Ratio (M‐H, Random, 95% CI) | 0.81 [0.62, 1.06] |
| 5.2.1 High dose PPI | 1 | 631 | Odds Ratio (M‐H, Random, 95% CI) | 1.40 [0.56, 3.53] |
| 5.2.2 Non‐high dose PPI | 4 | 1490 | Odds Ratio (M‐H, Random, 95% CI) | 0.77 [0.58, 1.02] |
| 5.3 Surgery Show forest plot | 6 | 2223 | Odds Ratio (M‐H, Random, 95% CI) | 0.91 [0.65, 1.26] |
| 5.3.1 High dose PPI | 1 | 631 | Odds Ratio (M‐H, Random, 95% CI) | 0.67 [0.19, 2.39] |
| 5.3.2 Non‐high dose PPI | 5 | 1592 | Odds Ratio (M‐H, Random, 95% CI) | 0.93 [0.66, 1.30] |
| Outcome or subgroup title | No. of studies | No. of participants | Statistical method | Effect size |
| 6.1 Mortality Show forest plot | 5 | 2143 | Odds Ratio (M‐H, Random, 95% CI) | 1.14 [0.76, 1.70] |
| 6.1.1 PPI versus placebo | 3 | 1983 | Odds Ratio (M‐H, Random, 95% CI) | 1.20 [0.79, 1.84] |
| 6.1.2 PPI versus H2RA | 2 | 160 | Odds Ratio (M‐H, Random, 95% CI) | 0.66 [0.18, 2.46] |
| 6.2 Rebleeding Show forest plot | 5 | 2121 | Odds Ratio (M‐H, Random, 95% CI) | 0.81 [0.62, 1.06] |
| 6.2.1 PPI versus placebo | 3 | 1983 | Odds Ratio (M‐H, Random, 95% CI) | 0.87 [0.65, 1.16] |
| 6.2.2 PPI versus H2RA | 1 | 58 | Odds Ratio (M‐H, Random, 95% CI) | 0.56 [0.14, 2.26] |
| 6.2.3 PPI versus no treatment | 1 | 80 | Odds Ratio (M‐H, Random, 95% CI) | 0.39 [0.14, 1.12] |
| 6.3 Surgery Show forest plot | 6 | 2223 | Odds Ratio (M‐H, Random, 95% CI) | 0.91 [0.65, 1.26] |
| 6.3.1 PPI versus placebo | 3 | 1983 | Odds Ratio (M‐H, Random, 95% CI) | 0.90 [0.64, 1.27] |
| 6.3.2 PPI versus H2RA | 2 | 160 | Odds Ratio (M‐H, Random, 95% CI) | 1.53 [0.45, 5.18] |
| 6.3.3 PPI versus no treatment | 1 | 80 | Odds Ratio (M‐H, Random, 95% CI) | 0.37 [0.07, 2.02] |
| Outcome or subgroup title | No. of studies | No. of participants | Statistical method | Effect size |
| 7.1 Mortality Show forest plot | 5 | 2143 | Odds Ratio (M‐H, Random, 95% CI) | 1.14 [0.76, 1.70] |
| 7.1.1 Reported use of endoscopic haemostatic treatment at index endoscopy | 4 | 2041 | Odds Ratio (M‐H, Random, 95% CI) | 1.20 [0.78, 1.82] |
| 7.1.2 No mention of endoscopic haemostatic treatment at index endoscopy | 1 | 102 | Odds Ratio (M‐H, Random, 95% CI) | 0.60 [0.14, 2.66] |
| 7.2 Rebleeding Show forest plot | 5 | 2121 | Odds Ratio (M‐H, Random, 95% CI) | 0.81 [0.62, 1.06] |
| 7.2.1 Reported use of endoscopic haemostatic treatment at index endoscopy | 4 | 2041 | Odds Ratio (M‐H, Random, 95% CI) | 0.85 [0.65, 1.13] |
| 7.2.2 No mention of endoscopic haemostatic treatment at index endoscopy | 1 | 80 | Odds Ratio (M‐H, Random, 95% CI) | 0.39 [0.14, 1.12] |
| 7.3 Surgery Show forest plot | 6 | 2223 | Odds Ratio (M‐H, Random, 95% CI) | 0.91 [0.65, 1.26] |
| 7.3.1 Reported use of endoscopic haemostatic treatment at index endoscopy | 4 | 2041 | Odds Ratio (M‐H, Random, 95% CI) | 0.90 [0.64, 1.27] |
| 7.3.2 No mention of endoscopic haemostatic treatment at index endoscopy | 2 | 182 | Odds Ratio (M‐H, Random, 95% CI) | 0.85 [0.22, 3.37] |
| Outcome or subgroup title | No. of studies | No. of participants | Statistical method | Effect size |
| 8.1 Mortality Show forest plot | 2 | 580 | Odds Ratio (M‐H, Random, 95% CI) | 1.39 [0.52, 3.70] |
| 8.2 Rebleeding Show forest plot | 2 | 880 | Odds Ratio (M‐H, Fixed, 95% CI) | 0.86 [0.59, 1.26] |
| 8.3 Surgery Show forest plot | 2 | 880 | Odds Ratio (M‐H, Random, 95% CI) | 0.91 [0.59, 1.40] |