Ventilación nasal con presión positiva intermitente (VNPPI) precoz versus presión positiva nasal continua de las vías respiratorias (PPNCVR) precoz en lactantes prematuros
Información
- DOI:
- https://doi.org/10.1002/14651858.CD005384.pub2Copiar DOI

- Base de datos:
-
- Cochrane Database of Systematic Reviews
- Versión publicada:
-
- 15 diciembre 2016see what's new
- Tipo:
-
- Intervention
- Etapa:
-
- Review
- Grupo Editorial Cochrane:
-
Grupo Cochrane de Neonatología
- Copyright:
-
- Copyright © 2017 The Cochrane Collaboration. Published by John Wiley & Sons, Ltd.
Cifras del artículo
Altmetric:
Citado por:
Autores
Contributions of authors
ML, CB, and BL prepared the protocol for this review.
ML and CB performed a preliminary review and meta‐analysis; BL updated the literature search, made independent quality assessments, and extracted data before comparing results and resolving differences for the final review.
All review authors participated in data analysis and interpretation of results of the updated review.
Sources of support
Internal sources
-
No sources of support supplied
External sources
-
This work was supported, in part, by NIH grant number T35DK007386, USA.
-
Eunice Kennedy Shriver National Institute of Child Health and Human Development, National Institutes of Health, Department of Health and Human Services, USA.
Editorial support of the Cochrane Neonatal Review Group has been funded with Federal funds from the Eunice Kennedy Shriver National Institute of Child Health and Human Development, National Institutes of Health, Department of Health and Human Services, USA, under Contract No. HHSN275201100016C
-
National Institute for Health Research, UK.
Editorial support for Cochrane Neonatal has been funded with funds from a UK National Institute of Health Research Grant (NIHR) Cochrane Programme Grant (13/89/12). The views expressed in this publication are those of the authors and not necessarily those of the NHS, the NIHR, or the UK Department of Health.
Declarations of interest
Review authors acknowledge no implied or actual potential conflict of interest.
Acknowledgements
We would like to acknowledge the assistance of Drs Bisceglia, Kugelman, Dutta, Lista, and Meneses, who assisted us by providing supplementary, unpublished information.
Version history
| Published | Title | Stage | Authors | Version |
| 2023 Jul 19 | Early nasal intermittent positive pressure ventilation (NIPPV) versus early nasal continuous positive airway pressure (NCPAP) for preterm infants | Review | Brigitte Lemyre, Marc-Olivier Deguise, Paige Benson, Haresh Kirpalani, Osayame A Ekhaguere, Peter G Davis | |
| 2016 Dec 15 | Early nasal intermittent positive pressure ventilation (NIPPV) versus early nasal continuous positive airway pressure (NCPAP) for preterm infants | Review | Brigitte Lemyre, Matthew Laughon, Carl Bose, Peter G Davis | |
| 2005 Jul 20 | Prophylactic nasal intermittent positive pressure ventilation (NIPPV) versus prophylactic nasal continuous positive airway pressure (NCPAP) for preterm infants | Protocol | Matthew Laughon, Carl Bose | |
Differences between protocol and review
Because the technology and the terminology of these interventions have evolved in recent years, we expanded our search terms to include nasal intermittent mandatory ventilation, NIMV, nasal distending pressure, nasal positive pressure, nasal ventilation, non‐invasive positive pressure ventilation, synchronized intermittent mandatory ventilation, SIMV, nasopharyngeal synchronized intermittent mandatory ventilation, bilevel CPAP, BiCPAP, BiPAP, and SiPAP. We amended the search dates to include articles written between protocol publication and the official search day for the review. Because we found the original requirement of infant enrollment in studies before the age of six hours to be too stringent, we relaxed the criteria to include studies in which nasal ventilation was described as "prophylactic" or "early."
We added methods and plans for "Summary of findings" tables and GRADE recommendations, which were not included in the original protocol.
Keywords
MeSH
Medical Subject Headings (MeSH) Keywords
- *Continuous Positive Airway Pressure [adverse effects];
- *Intermittent Positive‐Pressure Ventilation [adverse effects];
- Bronchopulmonary Dysplasia [prevention & control];
- Chronic Disease;
- Infant, Premature;
- Intracranial Hemorrhages;
- Intubation, Intratracheal [statistics & numerical data];
- Oxygen Inhalation Therapy [statistics & numerical data];
- Pneumothorax [epidemiology, etiology];
- Randomized Controlled Trials as Topic;
- Respiratory Distress Syndrome, Newborn [*therapy];
- Respiratory Insufficiency [*prevention & control];
Medical Subject Headings Check Words
Humans; Infant, Newborn;
PICO

Study flow diagram.

Methodological quality summary: review authors' judgements about each methodological quality item for each included study.

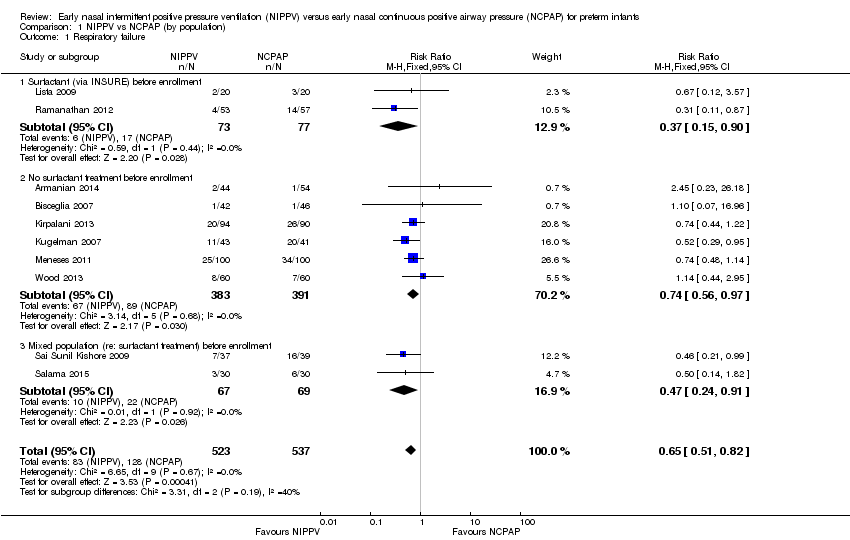
Forest plot of comparison: 1 NIPPV vs NCPAP (by population), outcome: 1.1 Respiratory failure.

Forest plot of comparison: 1 NIPPV vs NCPAP (by population), outcome: 1.2 Need for intubation.
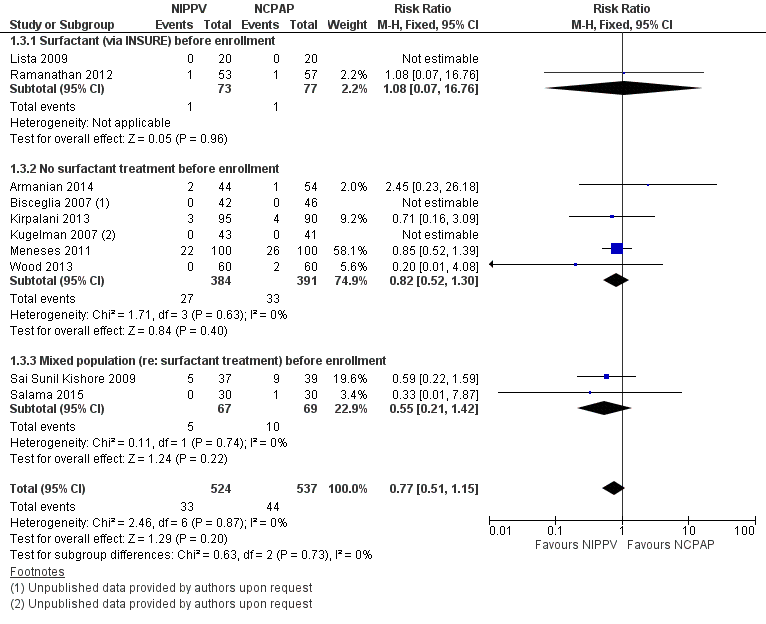
Forest plot of comparison: 1 NIPPV vs NCPAP (by population), outcome: 1.3 Mortality during study period.

Forest plot of comparison: 1 NIPPV vs NCPAP (by population), outcome: 1.4 Chronic lung disease.
Comparison 1 NIPPV vs NCPAP (by population), Outcome 1 Respiratory failure.

Comparison 1 NIPPV vs NCPAP (by population), Outcome 2 Need for intubation.

Comparison 1 NIPPV vs NCPAP (by population), Outcome 3 Mortality during study period.

Comparison 1 NIPPV vs NCPAP (by population), Outcome 4 Chronic lung disease.

Comparison 1 NIPPV vs NCPAP (by population), Outcome 5 Pneumothorax.
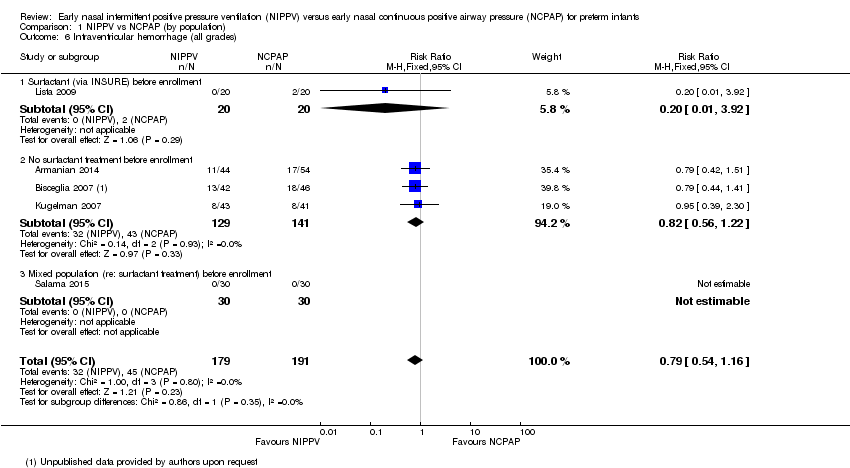
Comparison 1 NIPPV vs NCPAP (by population), Outcome 6 Intraventricular hemorrhage (all grades).

Comparison 1 NIPPV vs NCPAP (by population), Outcome 7 Severe intraventricular hemorrhage (grade III/IV).

Comparison 1 NIPPV vs NCPAP (by population), Outcome 8 Necrotizing enterocolitis (≥ Bell's stage 2).

Comparison 1 NIPPV vs NCPAP (by population), Outcome 9 Sepsis.

Comparison 1 NIPPV vs NCPAP (by population), Outcome 10 Retinopathy of prematurity (≥ stage 3).
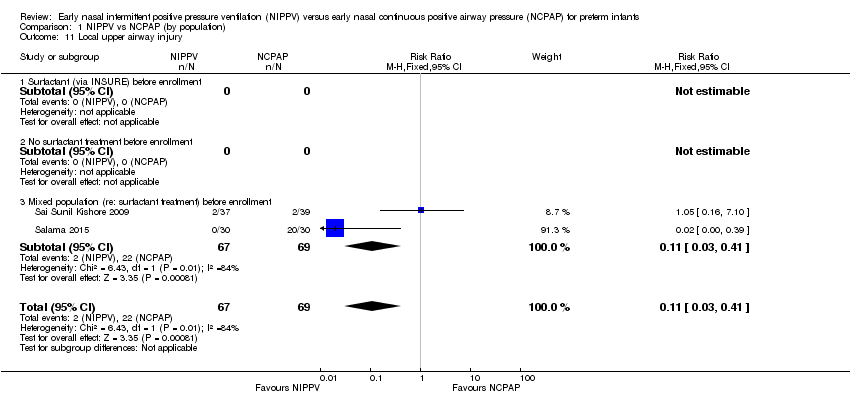
Comparison 1 NIPPV vs NCPAP (by population), Outcome 11 Local upper airway injury.
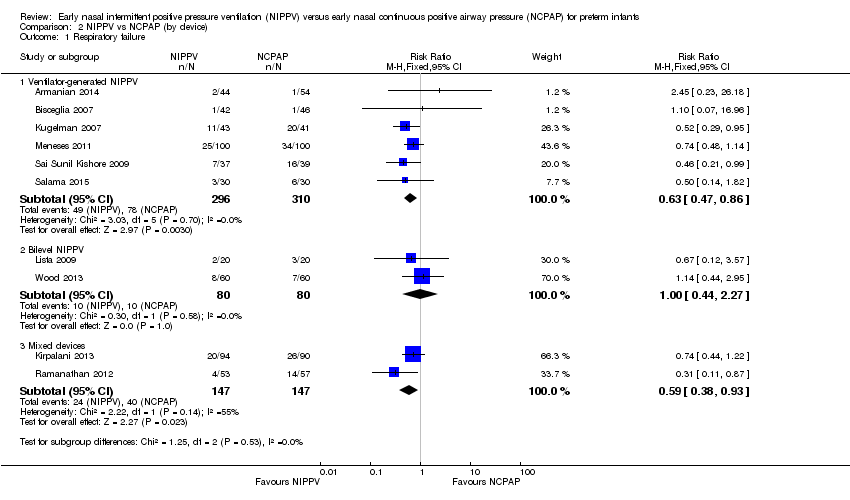
Comparison 2 NIPPV vs NCPAP (by device), Outcome 1 Respiratory failure.

Comparison 2 NIPPV vs NCPAP (by device), Outcome 2 Need for intubation.

Comparison 2 NIPPV vs NCPAP (by device), Outcome 3 Mortality.

Comparison 2 NIPPV vs NCPAP (by device), Outcome 4 Chronic lung disease.

Comparison 2 NIPPV vs NCPAP (by device), Outcome 5 Pneumothorax.

Comparison 2 NIPPV vs NCPAP (by device), Outcome 6 Severe intraventricular hemorrhage (grade III/IV).

Comparison 3 NIPPV vs NCPAP (by synchronization), Outcome 1 Respiratory failure.

Comparison 3 NIPPV vs NCPAP (by synchronization), Outcome 2 Need for intubation.

Comparison 3 NIPPV vs NCPAP (by synchronization), Outcome 3 Mortality.
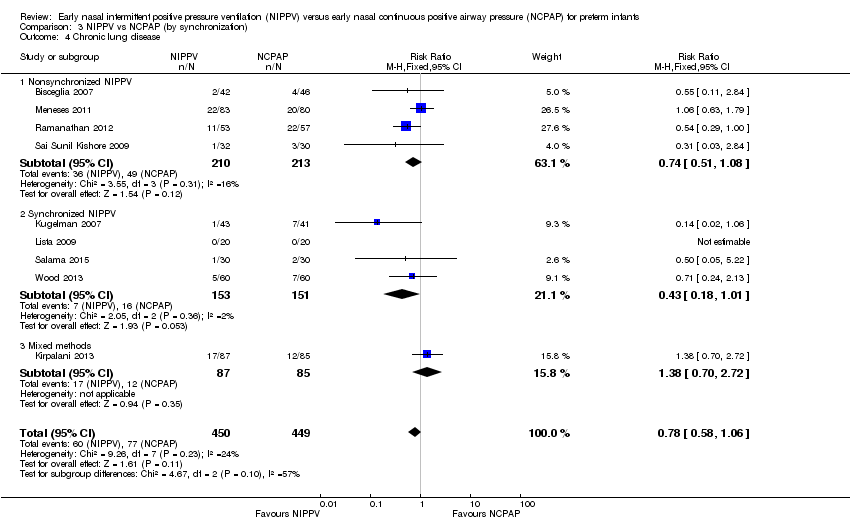
Comparison 3 NIPPV vs NCPAP (by synchronization), Outcome 4 Chronic lung disease.
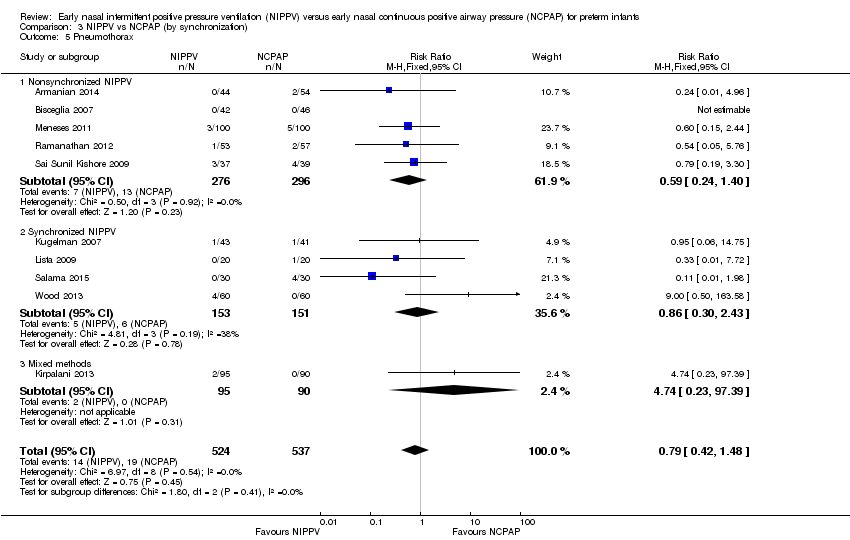
Comparison 3 NIPPV vs NCPAP (by synchronization), Outcome 5 Pneumothorax.

Comparison 3 NIPPV vs NCPAP (by synchronization), Outcome 6 Severe intraventricular hemorrhage (grade III/IV).

Comparison 4 NIPPV vs NCPAP high‐quality studies only (by device), Outcome 1 Respiratory failure (high‐quality studies).
| NIPPV versus NCPAP (by population) | ||||||
| Patient or population: preterm infants | ||||||
| Outcomes | Anticipated absolute effects* | Relative effect | Number of participants | Quality of the evidence | Comments | |
| Risk with NCPAP | Risk with NIPPV | |||||
| Respiratory failure | Study population | RR 0.62 | 876 | Moderatea | Risk of bias: unblinded intervention Meets optimal information size (OIS) (N = 377) | |
| 251 per 1000 | 155 per 1000 | |||||
| Moderate | ||||||
| 175 per 1000 | 109 per 1000 | |||||
| Need for intubation | Study population | RR 0.79 | 766 | Moderatea | Risk of bias: unblinded intervention Does not meet OIS (N = 838) | |
| 300 per 1000 | 237 per 1000 | |||||
| Moderate | ||||||
| 175 per 1000 | 138 per 1000 | |||||
| Pneumothorax | Study population | RR 0.69 | 876 | Lowa,b | Risk of bias: unblinded intervention | |
| 43 per 1000 | 29 per 1000 | |||||
| Moderate | ||||||
| 44 per 1000 | 30 per 1000 | |||||
| Severe intraventricular hemorrhage (grade III/IV) | Study population | RR 1.26 | 430 | Very lowa,b | Risk of bias: unblinded intervention | |
| 37 per 1000 | 46 per 1000 | |||||
| Moderate | ||||||
| 49 per 1000 | 61 per 1000 | |||||
| Chronic lung disease | Study population | RR 0.67 | 727 | Moderatea | Risk of bias: unblinded intervention Does not meet OIS (N = 1250) | |
| 179 per 1000 | 120 per 1000 | |||||
| Moderate | ||||||
| 170 per 1000 | 114 per 1000 | |||||
| Mortality during study period | Study population | RR 0.77 | 876 | Lowa,b | Risk of bias: unblinded intervention | |
| 89 per 1000 | 69 per 1000 | |||||
| Low | ||||||
| 0 per 1000 | 0 per 1000 | |||||
| Moderate | ||||||
| 26 per 1000 | 20 per 1000 | |||||
| *The risk in the intervention group (and its 95% confidence interval) is based on the assumed risk in the comparison group and the relative effect of the intervention (and its 95% CI). | ||||||
| GRADE Working Group grades of evidence | ||||||
| aUnblinded intervention. bImprecision: wide confidence intervals. | ||||||
| Outcome or subgroup title | No. of studies | No. of participants | Statistical method | Effect size |
| 1 Respiratory failure Show forest plot | 10 | 1060 | Risk Ratio (M‐H, Fixed, 95% CI) | 0.65 [0.51, 0.82] |
| 1.1 Surfactant (via INSURE) before enrollment | 2 | 150 | Risk Ratio (M‐H, Fixed, 95% CI) | 0.37 [0.15, 0.90] |
| 1.2 No surfactant treatment before enrollment | 6 | 774 | Risk Ratio (M‐H, Fixed, 95% CI) | 0.74 [0.56, 0.97] |
| 1.3 Mixed population (re: surfactant treatment) before enrollment | 2 | 136 | Risk Ratio (M‐H, Fixed, 95% CI) | 0.47 [0.24, 0.91] |
| 2 Need for intubation Show forest plot | 9 | 950 | Risk Ratio (M‐H, Fixed, 95% CI) | 0.78 [0.64, 0.94] |
| 2.1 Surfactant (via INSURE) before enrollment | 1 | 40 | Risk Ratio (M‐H, Fixed, 95% CI) | 0.67 [0.12, 3.57] |
| 2.2 No surfactant treatment before enrollment | 6 | 774 | Risk Ratio (M‐H, Fixed, 95% CI) | 0.84 [0.69, 1.02] |
| 2.3 Mixed population (re: surfactant treatment) before enrollment | 2 | 136 | Risk Ratio (M‐H, Fixed, 95% CI) | 0.47 [0.24, 0.91] |
| 3 Mortality during study period Show forest plot | 10 | 1061 | Risk Ratio (M‐H, Fixed, 95% CI) | 0.77 [0.51, 1.15] |
| 3.1 Surfactant (via INSURE) before enrollment | 2 | 150 | Risk Ratio (M‐H, Fixed, 95% CI) | 1.08 [0.07, 16.76] |
| 3.2 No surfactant treatment before enrollment | 6 | 775 | Risk Ratio (M‐H, Fixed, 95% CI) | 0.82 [0.52, 1.30] |
| 3.3 Mixed population (re: surfactant treatment) before enrollment | 2 | 136 | Risk Ratio (M‐H, Fixed, 95% CI) | 0.55 [0.21, 1.42] |
| 4 Chronic lung disease Show forest plot | 9 | 899 | Risk Ratio (M‐H, Fixed, 95% CI) | 0.78 [0.58, 1.06] |
| 4.1 Surfactant (via INSURE) before enrollment | 2 | 150 | Risk Ratio (M‐H, Fixed, 95% CI) | 0.54 [0.29, 1.00] |
| 4.2 No surfactant treatment before enrollment | 5 | 627 | Risk Ratio (M‐H, Fixed, 95% CI) | 0.92 [0.64, 1.32] |
| 4.3 Mixed population (re: surfactant treatment) before enrollment | 2 | 122 | Risk Ratio (M‐H, Fixed, 95% CI) | 0.39 [0.08, 1.91] |
| 5 Pneumothorax Show forest plot | 10 | 1061 | Risk Ratio (M‐H, Fixed, 95% CI) | 0.79 [0.42, 1.48] |
| 5.1 Surfactant (via INSURE) before enrollment | 2 | 150 | Risk Ratio (M‐H, Fixed, 95% CI) | 0.45 [0.07, 2.94] |
| 5.2 No surfactant treatment before enrollment | 6 | 775 | Risk Ratio (M‐H, Fixed, 95% CI) | 1.23 [0.52, 2.91] |
| 5.3 Mixed population (re: surfactant treatment) before enrollment | 2 | 136 | Risk Ratio (M‐H, Fixed, 95% CI) | 0.43 [0.13, 1.41] |
| 6 Intraventricular hemorrhage (all grades) Show forest plot | 5 | 370 | Risk Ratio (M‐H, Fixed, 95% CI) | 0.79 [0.54, 1.16] |
| 6.1 Surfactant (via INSURE) before enrollment | 1 | 40 | Risk Ratio (M‐H, Fixed, 95% CI) | 0.2 [0.01, 3.92] |
| 6.2 No surfactant treatment before enrollment | 3 | 270 | Risk Ratio (M‐H, Fixed, 95% CI) | 0.82 [0.56, 1.22] |
| 6.3 Mixed population (re: surfactant treatment) before enrollment | 1 | 60 | Risk Ratio (M‐H, Fixed, 95% CI) | 0.0 [0.0, 0.0] |
| 7 Severe intraventricular hemorrhage (grade III/IV) Show forest plot | 4 | 430 | Risk Ratio (M‐H, Fixed, 95% CI) | 1.26 [0.53, 3.01] |
| 7.1 Surfactant (via INSURE) before enrollment | 1 | 110 | Risk Ratio (M‐H, Fixed, 95% CI) | 5.37 [0.26, 109.35] |
| 7.2 No surfactant treatment before enrollment | 3 | 320 | Risk Ratio (M‐H, Fixed, 95% CI) | 1.01 [0.39, 2.59] |
| 7.3 Mixed population (re: surfactant treatment) before enrollment | 0 | 0 | Risk Ratio (M‐H, Fixed, 95% CI) | 0.0 [0.0, 0.0] |
| 8 Necrotizing enterocolitis (≥ Bell's stage 2) Show forest plot | 7 | 718 | Risk Ratio (M‐H, Fixed, 95% CI) | 0.67 [0.34, 1.31] |
| 8.1 Surfactant (via INSURE) before enrollment | 2 | 150 | Risk Ratio (M‐H, Fixed, 95% CI) | 0.54 [0.10, 2.82] |
| 8.2 No surfactant treatment before enrollment | 4 | 492 | Risk Ratio (M‐H, Fixed, 95% CI) | 0.58 [0.25, 1.33] |
| 8.3 Mixed population (re: surfactant treatment) before enrollment | 1 | 76 | Risk Ratio (M‐H, Fixed, 95% CI) | 1.58 [0.28, 8.93] |
| 9 Sepsis Show forest plot | 2 | 136 | Risk Ratio (M‐H, Fixed, 95% CI) | 0.78 [0.36, 1.70] |
| 9.1 Surfactant (via INSURE) before enrollment | 0 | 0 | Risk Ratio (M‐H, Fixed, 95% CI) | 0.0 [0.0, 0.0] |
| 9.2 No surfactant treatment before enrollment | 0 | 0 | Risk Ratio (M‐H, Fixed, 95% CI) | 0.0 [0.0, 0.0] |
| 9.3 Mixed population (re: surfactant treatment) before enrollment | 2 | 136 | Risk Ratio (M‐H, Fixed, 95% CI) | 0.78 [0.36, 1.70] |
| 10 Retinopathy of prematurity (≥ stage 3) Show forest plot | 2 | 245 | Risk Ratio (M‐H, Fixed, 95% CI) | 1.50 [0.65, 3.44] |
| 10.1 Surfactant (via INSURE) before enrollment | 1 | 110 | Risk Ratio (M‐H, Fixed, 95% CI) | 3.22 [0.13, 77.41] |
| 10.2 No surfactant treatment before enrollment | 1 | 135 | Risk Ratio (M‐H, Fixed, 95% CI) | 1.39 [0.58, 3.30] |
| 10.3 Mixed population (re: surfactant treatment) before enrollment | 0 | 0 | Risk Ratio (M‐H, Fixed, 95% CI) | 0.0 [0.0, 0.0] |
| 11 Local upper airway injury Show forest plot | 2 | 136 | Risk Ratio (M‐H, Fixed, 95% CI) | 0.11 [0.03, 0.41] |
| 11.1 Surfactant (via INSURE) before enrollment | 0 | 0 | Risk Ratio (M‐H, Fixed, 95% CI) | 0.0 [0.0, 0.0] |
| 11.2 No surfactant treatment before enrollment | 0 | 0 | Risk Ratio (M‐H, Fixed, 95% CI) | 0.0 [0.0, 0.0] |
| 11.3 Mixed population (re: surfactant treatment) before enrollment | 2 | 136 | Risk Ratio (M‐H, Fixed, 95% CI) | 0.11 [0.03, 0.41] |
| Outcome or subgroup title | No. of studies | No. of participants | Statistical method | Effect size |
| 1 Respiratory failure Show forest plot | 10 | Risk Ratio (M‐H, Fixed, 95% CI) | Subtotals only | |
| 1.1 Ventilator‐generated NIPPV | 6 | 606 | Risk Ratio (M‐H, Fixed, 95% CI) | 0.63 [0.47, 0.86] |
| 1.2 Bilevel NIPPV | 2 | 160 | Risk Ratio (M‐H, Fixed, 95% CI) | 1.0 [0.44, 2.27] |
| 1.3 Mixed devices | 2 | 294 | Risk Ratio (M‐H, Fixed, 95% CI) | 0.59 [0.38, 0.93] |
| 2 Need for intubation Show forest plot | 10 | Risk Difference (M‐H, Fixed, 95% CI) | Subtotals only | |
| 2.1 Ventilator‐generated NIPPV | 6 | 606 | Risk Difference (M‐H, Fixed, 95% CI) | ‐0.08 [‐0.14, ‐0.02] |
| 2.2 Bilevel NIPPV | 2 | 160 | Risk Difference (M‐H, Fixed, 95% CI) | 0.0 [‐0.10, 0.10] |
| 2.3 Mixed devices | 2 | 294 | Risk Difference (M‐H, Fixed, 95% CI) | ‐0.11 [‐0.20, ‐0.02] |
| 3 Mortality Show forest plot | 9 | 977 | Risk Ratio (M‐H, Fixed, 95% CI) | 0.77 [0.51, 1.15] |
| 3.1 Ventilator‐generated NIPPV | 5 | 522 | Risk Ratio (M‐H, Fixed, 95% CI) | 0.80 [0.52, 1.23] |
| 3.2 Bilevel NIPPV | 2 | 160 | Risk Ratio (M‐H, Fixed, 95% CI) | 0.2 [0.01, 4.08] |
| 3.3 Mixed devices | 2 | 295 | Risk Ratio (M‐H, Fixed, 95% CI) | 0.78 [0.21, 2.83] |
| 4 Chronic lung disease Show forest plot | 9 | Risk Ratio (M‐H, Fixed, 95% CI) | Subtotals only | |
| 4.1 Ventilator‐generated NIPPV | 5 | 457 | Risk Ratio (M‐H, Fixed, 95% CI) | 0.73 [0.47, 1.15] |
| 4.2 Bilevel NIPPV | 2 | 160 | Risk Ratio (M‐H, Fixed, 95% CI) | 0.71 [0.24, 2.13] |
| 4.3 Mixed devices | 2 | 282 | Risk Ratio (M‐H, Fixed, 95% CI) | 0.85 [0.54, 1.32] |
| 5 Pneumothorax Show forest plot | 10 | Risk Ratio (M‐H, Fixed, 95% CI) | Subtotals only | |
| 5.1 Ventilator‐generated NIPPV | 6 | 606 | Risk Ratio (M‐H, Fixed, 95% CI) | 0.49 [0.21, 1.11] |
| 5.2 Bilevel NIPPV | 2 | 160 | Risk Ratio (M‐H, Fixed, 95% CI) | 2.5 [0.49, 12.67] |
| 5.3 Mixed devices | 2 | 295 | Risk Ratio (M‐H, Fixed, 95% CI) | 1.42 [0.28, 7.29] |
| 6 Severe intraventricular hemorrhage (grade III/IV) Show forest plot | 3 | 346 | Risk Ratio (M‐H, Fixed, 95% CI) | 1.35 [0.51, 3.62] |
| 6.1 Ventilator‐generated NIPPV | 2 | 236 | Risk Ratio (M‐H, Fixed, 95% CI) | 1.03 [0.35, 3.04] |
| 6.2 Mixed devices | 1 | 110 | Risk Ratio (M‐H, Fixed, 95% CI) | 5.37 [0.26, 109.35] |
| Outcome or subgroup title | No. of studies | No. of participants | Statistical method | Effect size |
| 1 Respiratory failure Show forest plot | 10 | 1060 | Risk Ratio (M‐H, Fixed, 95% CI) | 0.64 [0.51, 0.81] |
| 1.1 Nonsynchronized NIPPV | 5 | 572 | Risk Ratio (M‐H, Fixed, 95% CI) | 0.60 [0.44, 0.83] |
| 1.2 Synchronized NIPPV | 4 | 304 | Risk Ratio (M‐H, Fixed, 95% CI) | 0.65 [0.41, 1.02] |
| 1.3 Mixed methods | 1 | 184 | Risk Ratio (M‐H, Fixed, 95% CI) | 0.74 [0.44, 1.22] |
| 2 Need for intubation Show forest plot | 10 | 1060 | Risk Ratio (M‐H, Fixed, 95% CI) | 0.73 [0.61, 0.87] |
| 2.1 Nonsynchronized NIPPV | 5 | 572 | Risk Ratio (M‐H, Fixed, 95% CI) | 0.74 [0.60, 0.92] |
| 2.2 Synchronized NIPPV | 4 | 304 | Risk Ratio (M‐H, Fixed, 95% CI) | 0.67 [0.42, 1.06] |
| 2.3 Mixed methods | 1 | 184 | Risk Ratio (M‐H, Fixed, 95% CI) | 0.74 [0.44, 1.22] |
| 3 Mortality Show forest plot | 9 | 977 | Risk Ratio (M‐H, Fixed, 95% CI) | 0.77 [0.51, 1.15] |
| 3.1 Synchronized NIPPV | 3 | 220 | Risk Ratio (M‐H, Fixed, 95% CI) | 0.25 [0.03, 2.19] |
| 3.2 Nonsynchronized NIPPV | 5 | 572 | Risk Ratio (M‐H, Fixed, 95% CI) | 0.83 [0.54, 1.27] |
| 3.3 Mixed methods | 1 | 185 | Risk Ratio (M‐H, Fixed, 95% CI) | 0.71 [0.16, 3.09] |
| 4 Chronic lung disease Show forest plot | 9 | 899 | Risk Ratio (M‐H, Fixed, 95% CI) | 0.78 [0.58, 1.06] |
| 4.1 Nonsynchronized NIPPV | 4 | 423 | Risk Ratio (M‐H, Fixed, 95% CI) | 0.74 [0.51, 1.08] |
| 4.2 Synchronized NIPPV | 4 | 304 | Risk Ratio (M‐H, Fixed, 95% CI) | 0.43 [0.18, 1.01] |
| 4.3 Mixed methods | 1 | 172 | Risk Ratio (M‐H, Fixed, 95% CI) | 1.38 [0.70, 2.72] |
| 5 Pneumothorax Show forest plot | 10 | 1061 | Risk Ratio (M‐H, Fixed, 95% CI) | 0.79 [0.42, 1.48] |
| 5.1 Nonsynchronized NIPPV | 5 | 572 | Risk Ratio (M‐H, Fixed, 95% CI) | 0.59 [0.24, 1.40] |
| 5.2 Synchronized NIPPV | 4 | 304 | Risk Ratio (M‐H, Fixed, 95% CI) | 0.86 [0.30, 2.43] |
| 5.3 Mixed methods | 1 | 185 | Risk Ratio (M‐H, Fixed, 95% CI) | 4.74 [0.23, 97.39] |
| 6 Severe intraventricular hemorrhage (grade III/IV) Show forest plot | 3 | 346 | Risk Ratio (M‐H, Fixed, 95% CI) | 1.35 [0.51, 3.62] |
| 6.1 Synchronized NIPPV | 0 | 0 | Risk Ratio (M‐H, Fixed, 95% CI) | 0.0 [0.0, 0.0] |
| 6.2 Nonsynchronized NIPPV | 3 | 346 | Risk Ratio (M‐H, Fixed, 95% CI) | 1.35 [0.51, 3.62] |
| Outcome or subgroup title | No. of studies | No. of participants | Statistical method | Effect size |
| 1 Respiratory failure (high‐quality studies) Show forest plot | 8 | 902 | Risk Ratio (M‐H, Fixed, 95% CI) | 0.64 [0.50, 0.82] |
| 1.1 Ventilator‐generated NIPPV | 4 | 448 | Risk Ratio (M‐H, Fixed, 95% CI) | 0.62 [0.45, 0.85] |
| 1.2 Bilevel NIPPV | 2 | 160 | Risk Ratio (M‐H, Fixed, 95% CI) | 1.0 [0.44, 2.27] |
| 1.3 Mixed devices | 2 | 294 | Risk Ratio (M‐H, Fixed, 95% CI) | 0.59 [0.38, 0.93] |