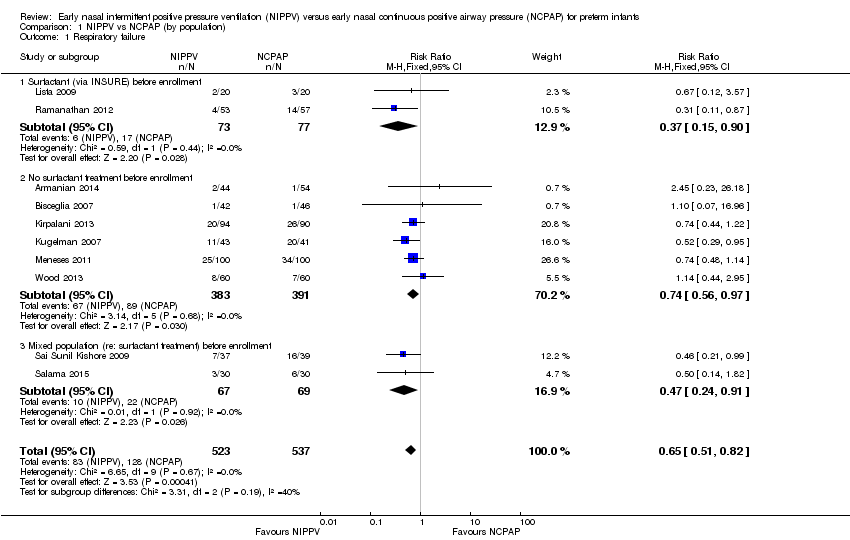
| 1 Respiratory failure Show forest plot | 10 | 1060 | Risk Ratio (M‐H, Fixed, 95% CI) | 0.65 [0.51, 0.82] |
|
| 1.1 Surfactant (via INSURE) before enrollment | 2 | 150 | Risk Ratio (M‐H, Fixed, 95% CI) | 0.37 [0.15, 0.90] |
| 1.2 No surfactant treatment before enrollment | 6 | 774 | Risk Ratio (M‐H, Fixed, 95% CI) | 0.74 [0.56, 0.97] |
| 1.3 Mixed population (re: surfactant treatment) before enrollment | 2 | 136 | Risk Ratio (M‐H, Fixed, 95% CI) | 0.47 [0.24, 0.91] |
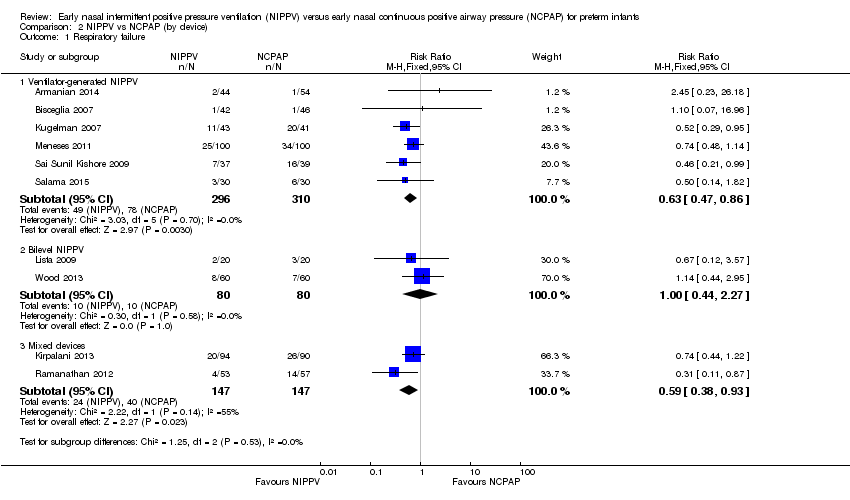
| 2 Need for intubation Show forest plot | 9 | 950 | Risk Ratio (M‐H, Fixed, 95% CI) | 0.78 [0.64, 0.94] |
|
| 2.1 Surfactant (via INSURE) before enrollment | 1 | 40 | Risk Ratio (M‐H, Fixed, 95% CI) | 0.67 [0.12, 3.57] |
| 2.2 No surfactant treatment before enrollment | 6 | 774 | Risk Ratio (M‐H, Fixed, 95% CI) | 0.84 [0.69, 1.02] |
| 2.3 Mixed population (re: surfactant treatment) before enrollment | 2 | 136 | Risk Ratio (M‐H, Fixed, 95% CI) | 0.47 [0.24, 0.91] |
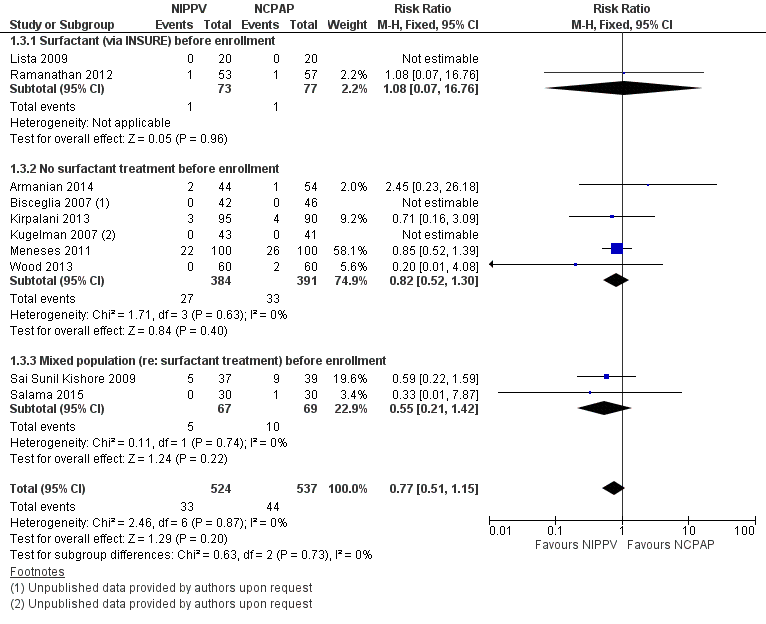
| 3 Mortality during study period Show forest plot | 10 | 1061 | Risk Ratio (M‐H, Fixed, 95% CI) | 0.77 [0.51, 1.15] |
|
| 3.1 Surfactant (via INSURE) before enrollment | 2 | 150 | Risk Ratio (M‐H, Fixed, 95% CI) | 1.08 [0.07, 16.76] |
| 3.2 No surfactant treatment before enrollment | 6 | 775 | Risk Ratio (M‐H, Fixed, 95% CI) | 0.82 [0.52, 1.30] |
| 3.3 Mixed population (re: surfactant treatment) before enrollment | 2 | 136 | Risk Ratio (M‐H, Fixed, 95% CI) | 0.55 [0.21, 1.42] |
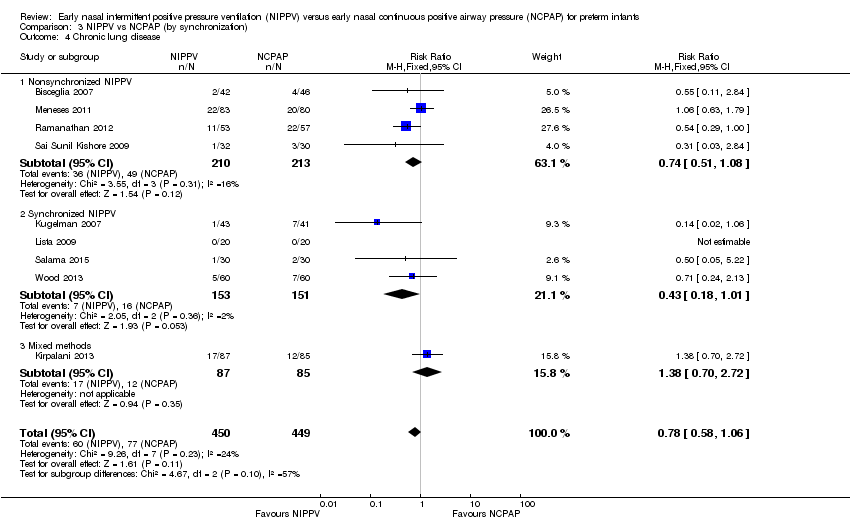
| 4 Chronic lung disease Show forest plot | 9 | 899 | Risk Ratio (M‐H, Fixed, 95% CI) | 0.78 [0.58, 1.06] |
|
| 4.1 Surfactant (via INSURE) before enrollment | 2 | 150 | Risk Ratio (M‐H, Fixed, 95% CI) | 0.54 [0.29, 1.00] |
| 4.2 No surfactant treatment before enrollment | 5 | 627 | Risk Ratio (M‐H, Fixed, 95% CI) | 0.92 [0.64, 1.32] |
| 4.3 Mixed population (re: surfactant treatment) before enrollment | 2 | 122 | Risk Ratio (M‐H, Fixed, 95% CI) | 0.39 [0.08, 1.91] |
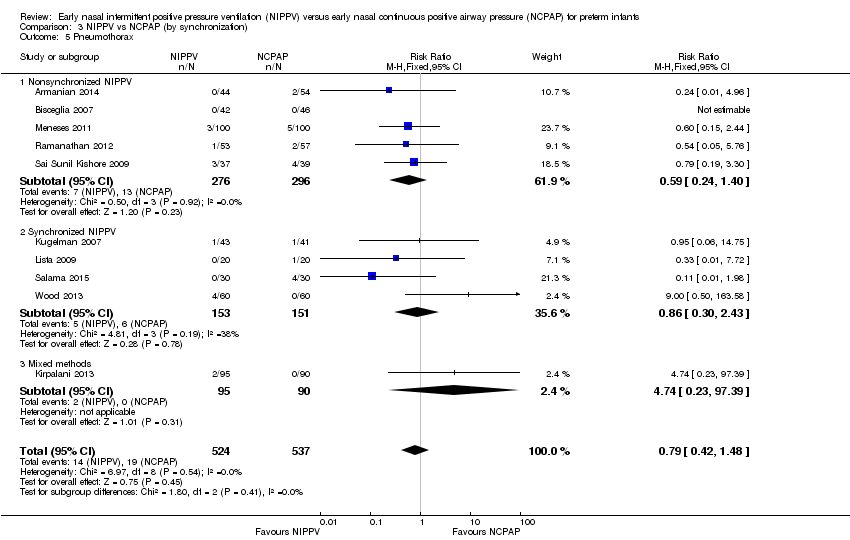
| 5 Pneumothorax Show forest plot | 10 | 1061 | Risk Ratio (M‐H, Fixed, 95% CI) | 0.79 [0.42, 1.48] |
|
| 5.1 Surfactant (via INSURE) before enrollment | 2 | 150 | Risk Ratio (M‐H, Fixed, 95% CI) | 0.45 [0.07, 2.94] |
| 5.2 No surfactant treatment before enrollment | 6 | 775 | Risk Ratio (M‐H, Fixed, 95% CI) | 1.23 [0.52, 2.91] |
| 5.3 Mixed population (re: surfactant treatment) before enrollment | 2 | 136 | Risk Ratio (M‐H, Fixed, 95% CI) | 0.43 [0.13, 1.41] |
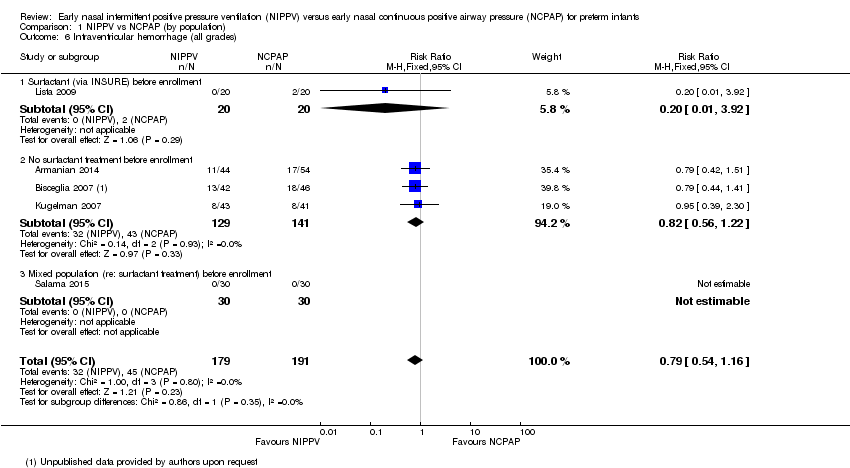
| 6 Intraventricular hemorrhage (all grades) Show forest plot | 5 | 370 | Risk Ratio (M‐H, Fixed, 95% CI) | 0.79 [0.54, 1.16] |
|
| 6.1 Surfactant (via INSURE) before enrollment | 1 | 40 | Risk Ratio (M‐H, Fixed, 95% CI) | 0.2 [0.01, 3.92] |
| 6.2 No surfactant treatment before enrollment | 3 | 270 | Risk Ratio (M‐H, Fixed, 95% CI) | 0.82 [0.56, 1.22] |
| 6.3 Mixed population (re: surfactant treatment) before enrollment | 1 | 60 | Risk Ratio (M‐H, Fixed, 95% CI) | 0.0 [0.0, 0.0] |
| 7 Severe intraventricular hemorrhage (grade III/IV) Show forest plot | 4 | 430 | Risk Ratio (M‐H, Fixed, 95% CI) | 1.26 [0.53, 3.01] |
|
| 7.1 Surfactant (via INSURE) before enrollment | 1 | 110 | Risk Ratio (M‐H, Fixed, 95% CI) | 5.37 [0.26, 109.35] |
| 7.2 No surfactant treatment before enrollment | 3 | 320 | Risk Ratio (M‐H, Fixed, 95% CI) | 1.01 [0.39, 2.59] |
| 7.3 Mixed population (re: surfactant treatment) before enrollment | 0 | 0 | Risk Ratio (M‐H, Fixed, 95% CI) | 0.0 [0.0, 0.0] |
| 8 Necrotizing enterocolitis (≥ Bell's stage 2) Show forest plot | 7 | 718 | Risk Ratio (M‐H, Fixed, 95% CI) | 0.67 [0.34, 1.31] |
|
| 8.1 Surfactant (via INSURE) before enrollment | 2 | 150 | Risk Ratio (M‐H, Fixed, 95% CI) | 0.54 [0.10, 2.82] |
| 8.2 No surfactant treatment before enrollment | 4 | 492 | Risk Ratio (M‐H, Fixed, 95% CI) | 0.58 [0.25, 1.33] |
| 8.3 Mixed population (re: surfactant treatment) before enrollment | 1 | 76 | Risk Ratio (M‐H, Fixed, 95% CI) | 1.58 [0.28, 8.93] |
| 9 Sepsis Show forest plot | 2 | 136 | Risk Ratio (M‐H, Fixed, 95% CI) | 0.78 [0.36, 1.70] |
|
| 9.1 Surfactant (via INSURE) before enrollment | 0 | 0 | Risk Ratio (M‐H, Fixed, 95% CI) | 0.0 [0.0, 0.0] |
| 9.2 No surfactant treatment before enrollment | 0 | 0 | Risk Ratio (M‐H, Fixed, 95% CI) | 0.0 [0.0, 0.0] |
| 9.3 Mixed population (re: surfactant treatment) before enrollment | 2 | 136 | Risk Ratio (M‐H, Fixed, 95% CI) | 0.78 [0.36, 1.70] |
| 10 Retinopathy of prematurity (≥ stage 3) Show forest plot | 2 | 245 | Risk Ratio (M‐H, Fixed, 95% CI) | 1.50 [0.65, 3.44] |
|
| 10.1 Surfactant (via INSURE) before enrollment | 1 | 110 | Risk Ratio (M‐H, Fixed, 95% CI) | 3.22 [0.13, 77.41] |
| 10.2 No surfactant treatment before enrollment | 1 | 135 | Risk Ratio (M‐H, Fixed, 95% CI) | 1.39 [0.58, 3.30] |
| 10.3 Mixed population (re: surfactant treatment) before enrollment | 0 | 0 | Risk Ratio (M‐H, Fixed, 95% CI) | 0.0 [0.0, 0.0] |
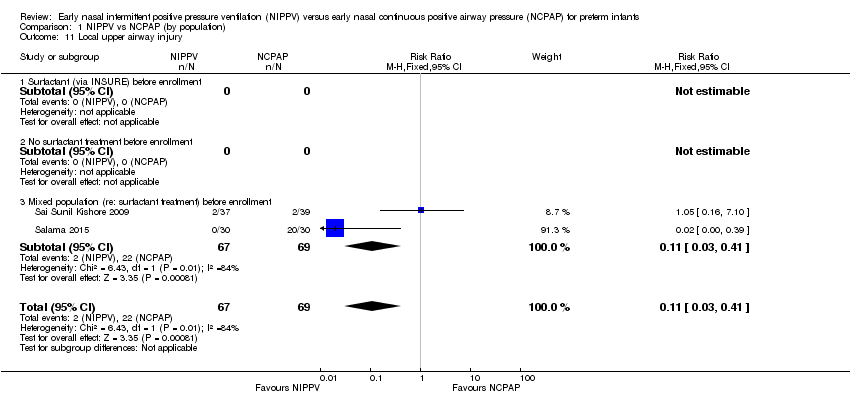
| 11 Local upper airway injury Show forest plot | 2 | 136 | Risk Ratio (M‐H, Fixed, 95% CI) | 0.11 [0.03, 0.41] |
|
| 11.1 Surfactant (via INSURE) before enrollment | 0 | 0 | Risk Ratio (M‐H, Fixed, 95% CI) | 0.0 [0.0, 0.0] |
| 11.2 No surfactant treatment before enrollment | 0 | 0 | Risk Ratio (M‐H, Fixed, 95% CI) | 0.0 [0.0, 0.0] |
| 11.3 Mixed population (re: surfactant treatment) before enrollment | 2 | 136 | Risk Ratio (M‐H, Fixed, 95% CI) | 0.11 [0.03, 0.41] |