مقایسه تهویه با فشار مثبت متناوب از راه بینی (NIPPV) زودهنگام در برابر تهویه با فشار مثبت مداوم راه هوایی از راه بینی (NCPAP) زودهنگام برای نوزادان پرهترم
چکیده
پیشینه
تهویه با فشار مثبت مداوم راه هوایی از راه بینی (nasal continuous positive airway pressure; NCPAP) یک روش برای نگهداشت فشار مثبت راه هوایی در تمام طول سیکل تنفسی از طریق استفاده از جریان معکوس گاز تنفسی (bias flow of respiratory gas) به داخل دستگاهی است که به بینی متصل است. درمان از طریق NCPAP با کاهش خطر ونتیلاسیون مکانیکی رابطه داشته و ممکن است در کاهش بیماری مزمن ریوی موثر باشد. تهویه با فشار مثبت متناوب از راه بینی (NIPPV) یک نوع ونتیلاسیون غیر‐تهاجمی است که در طول آن بیماران همزمان با ونتیلاسیون با NCPAP، به طور متناوب در معرض سطوح بالاتری از فشار راه هوایی از طریق همان دستگاه متصل به بینی قرار میگیرند.
اهداف
بررسی خطرات و مزایای NIPPV زودهنگام در برابر NCPAP زودهنگام به تنهایی برای نوزادان پرهترم در معرض خطر ابتلا یا مبتلا به دیسترس تنفسی (respiratory distress) درون ساعتهای اولیه بعد از تولد.
نقاط پایانی اولیه عبارتند از نارسایی تنفسی (respiratory failure) و نیاز به حمایت لولهگذاری تهویهای (intubated ventilatory support) در طول هفته اول زندگی. نقاط پایانی ثانویه عبارتند از بیماری مزمن ریوی (chronic lung disease; CLD) (اکسیژندرمانی در سن جنینی 36 هفتگی)، نشت هوا (air leaks)، طول دوره حمایت تنفسی، طول دوره اکسیژندرمانی، خونریزی داخل بطنی (intraventricular hemorrhage) و بروز مورتالیتی.
روشهای جستوجو
ما از راهبرد جستوجوی استاندارد گروه مرور نوزادان در کاکرین (Cochrane Neonatal Review Group) برای جستوجو در پایگاه ثبت مرکزی کارآزماییهای کنترل شده کاکرین (CENTRAL؛ شماره 9؛ 2015)؛ MEDLINE via PubMed (از 1966 تا 28 سپتامبر 2015)؛ Embase (از 1980 تا 28 سپتامبر 2015)، و Cumulative Index to Nursing and Allied Health Literature (CINAHL؛ از 1982 تا 28 سپتامبر 2015) استفاده کردیم. همچنین برای یافتن کارآزماییهای تصادفیسازی و کنترل شده و کارآزماییهای شبه‐تصادفیسازی شده در بانکهای اطلاعاتی کارآزماییهای بالینی، خلاصه مقالات کنفرانسها، و فهرست منابع مقالات بازیابی شده به جستوجو پرداختیم. یکی از اعضای گروه مرور نوزادان در کاکرین چکیدههای مربوط به انجمن اروپایی تحقیقات کودکان (European Society of Pediatric Research; ESPR) را به صورت دستی جستوجو کرد. برای به دست آوردن اطلاعات، با نویسندگان کارآزماییهای بالینی در حال انجام تماس برقرار کردیم.
معیارهای انتخاب
تمامی کارآزماییهای تصادفیسازی و شبه‐تصادفیسازی و کنترل شده را مورد بررسی قرار دادیم. مطالعاتی انتخاب شدند که به مقایسه درمان با NIPPV در برابر NCPAP در بدو تولد یا در فاصله کوتاهی بعد از تولد در نوزادان پرهترم (پیش از هفته 37 سن بارداری) پرداخته بودند.
گردآوری و تجزیهوتحلیل دادهها
با استفاده از توصیههای گروه مرور نوزادان در کاکرین به جمعآوری و تجزیهوتحلیل دادهها پرداختیم.
نتایج اصلی
ده کارآزمایی، که در مجموع از 1061 نوزاد برای شرکت در مطالعه ثبتنام به عمل آورده بودند، با معیارهای ورود به این مرور انطباق داشتند. متاآنالیز (meta‐analysis) این مطالعات نشان داد که خطر تحقق معیار نارسایی تنفسی (خطر نسبی (RR) معمول: 0.65؛ 95% فاصله اطمینان (CI): 0.51 تا 0.82؛ تفاوت خطر (RD) معمول: 0.09‐؛ 95% CI؛ 0.13‐ تا 0.04‐) و نیاز به انتوباسیون (RR معمول: 0.78؛ 95% CI؛ 0.64 تا 0.94؛ RD معمول: 0.07‐؛ 95% CI؛ 0.12‐ تا 0.02‐) میان نوزادان تحت درمان با NIPPV زودهنگام در مقایسه با NCPAP زودهنگام، به طور قابل توجهی با کاهش همراه بوده است. این متاآنالیز در خطر ابتلا به CLD در نوزادان تصادفیسازی برای دریافت NIPPV کاهشی نشان نداد (RR معمول: 0.78؛ 95% CI؛ 0.58 تا 1.06). مشاهده کنندگان هیچ شواهدی مبنی بر وجود آسیب مشاهده نکردند. نویسندگان مرور کیفیت شواهد را متوسط ارزیابی کردند (مطالعات کور نشده بودند).
نتیجهگیریهای نویسندگان
به نظر نمیرسد که NIPPV زودهنگام در کاهش نارسایی تنفسی و نیاز به انتوباسیون و ونتیلاسیون داخل نای با لوله (endotracheal tube ventilation) میان نوزادان پرهترم مبتلا به سندرم زجر تنفسی، نسبت به NCPAP به تنهایی، برتری داشته باشد. برای تایید این نتایج و به منظور ارزیابی بیخطری NIPPV در مقایسه با NCPAP به تنهایی در یک جمعیت بزرگتر از بیماران به مطالعات بیشتری نیاز است.
PICO
خلاصه به زبان ساده
مقایسه تهویه با فشار مثبت متناوب از راه بینی (NIPPV) زودهنگام در برابر تهویه با فشار مثبت مداوم راه هوایی از راه بینی (NCPAP) زودهنگام برای نوزادان پرهترم
سوال مطالعه مروری: آیا NIPPV در مقایسه با NCPAP مزایای کوتاه‐مدت و بلندمدت بهتری برای نوزادان پرهترم مبتلا یا در معرض دیسترس تنفسی به همراه دارد، بدون اینکه آسیبی به آنها برساند؟
پیشینه: برخی شواهد پیشنهاد میکنند که تهویه با فشار مثبت متناوب از راه بینی (NIPPV) اثربخشی تهویه با فشار مثبت مداوم راه هوایی از راه بینی (NCPAP) را در نوزادان نارس مبتلا به اختلالات تنفسی یا در معرض چنین اختلالاتی افزایش میدهد. نوزادان نارس مبتلا به مشکلات تنفسی اغلب نیازمند کمک از یک دستگاه (ونتیلاتور) هستند که به صورت منظم و از طریق یک لوله کار گذاشته شده در نای تنفس فراهم میکند. متخصصین اطفال که از این نوزادان پرهترم مراقبت میکنند، تلاش میکنند از استفاده از ونتیلاتورها اجتناب کنند، زیرا آنها میتوانند به ریه در حال رشد آسیب برسانند. NCPAP و NIPPV روشهای حمایت از تنفس نوزادان به شیوهای غیر‐تهاجمی هستند؛ لولهها کوتاهتر بوده و فقط تا پشت بینی امتداد مییابند، بنابراین آسیب کمتری به ریهها میرسانند. این دو روش ممکن است در بدو تولد به منظور کاهش تعداد نوزادان نیازمند به ونتیلاتور مورد استفاده قرار گیرند. NCPAP، فشار مستمر و پایداری را در پشت بینی فراهم میکند که به ریهها انتقال یافته و به کودک کمک میکند با راحتی بیشتری تنفس کند. NIPPV حمایت مشابهی را فراهم میکند اما میزانی از تنفس را نیز از طریق ونتیلاتور اضافه میکند.
ویژگیهای مطالعه: ما برای جستوجوی مطالعاتی که به مقایسه NCPAP با NIPPV در نوزادان پرهترم (متولد شده پیش از 37 هفته کامل از بارداری) نیازمند به حمایت تنفسی در فاصله زمانی کوتاهی بعد از تولد پرداخته بودند، در بانکهای اطلاعاتی علمی به جستوجو پرداختیم. مشکلات تنفسی، نیاز به لوله تنفسی و ونتیلاتور و عوارض جانبی را مورد توجه قرار دادیم. شواهد تا سپتامبر 2015 بهروز است.
نتایج کلیدی: نه کارآزمایی را به دست آوردیم که به مقایسه NCPAP با NIPPV پرداخته بودند. با تجزیهوتحلیل تمامی کارآزماییها دریافتیم که NIPPV خطر نارسایی تنفسی و نیاز به یک ونتیلاتور را کاهش میدهد. برای تعیین چگونگی ارائه NIPPV به بهترین شکل ممکن به نوزادان، مطالعات بیشتری نیاز است.
کیفیت شواهد: کیفیت کلی مطالعات وارد شده به این مرور، خوب بود.
Authors' conclusions
Summary of findings
| NIPPV versus NCPAP (by population) | ||||||
| Patient or population: preterm infants | ||||||
| Outcomes | Anticipated absolute effects* | Relative effect | Number of participants | Quality of the evidence | Comments | |
| Risk with NCPAP | Risk with NIPPV | |||||
| Respiratory failure | Study population | RR 0.62 | 876 | Moderatea | Risk of bias: unblinded intervention Meets optimal information size (OIS) (N = 377) | |
| 251 per 1000 | 155 per 1000 | |||||
| Moderate | ||||||
| 175 per 1000 | 109 per 1000 | |||||
| Need for intubation | Study population | RR 0.79 | 766 | Moderatea | Risk of bias: unblinded intervention Does not meet OIS (N = 838) | |
| 300 per 1000 | 237 per 1000 | |||||
| Moderate | ||||||
| 175 per 1000 | 138 per 1000 | |||||
| Pneumothorax | Study population | RR 0.69 | 876 | Lowa,b | Risk of bias: unblinded intervention | |
| 43 per 1000 | 29 per 1000 | |||||
| Moderate | ||||||
| 44 per 1000 | 30 per 1000 | |||||
| Severe intraventricular hemorrhage (grade III/IV) | Study population | RR 1.26 | 430 | Very lowa,b | Risk of bias: unblinded intervention | |
| 37 per 1000 | 46 per 1000 | |||||
| Moderate | ||||||
| 49 per 1000 | 61 per 1000 | |||||
| Chronic lung disease | Study population | RR 0.67 | 727 | Moderatea | Risk of bias: unblinded intervention Does not meet OIS (N = 1250) | |
| 179 per 1000 | 120 per 1000 | |||||
| Moderate | ||||||
| 170 per 1000 | 114 per 1000 | |||||
| Mortality during study period | Study population | RR 0.77 | 876 | Lowa,b | Risk of bias: unblinded intervention | |
| 89 per 1000 | 69 per 1000 | |||||
| Low | ||||||
| 0 per 1000 | 0 per 1000 | |||||
| Moderate | ||||||
| 26 per 1000 | 20 per 1000 | |||||
| *The risk in the intervention group (and its 95% confidence interval) is based on the assumed risk in the comparison group and the relative effect of the intervention (and its 95% CI). | ||||||
| GRADE Working Group grades of evidence | ||||||
| aUnblinded intervention. bImprecision: wide confidence intervals. | ||||||
Background
Description of the condition
Chronic lung disease (CLD), also known as bronchopulmonary dysplasia (BPD), is the most common serious morbidity among preterm infants. BPD has been defined historically as the need for supplemental oxygen therapy at 28 days of life; however, over time, this definition evolved to describe the need for supplemental oxygen therapy at 36 weeks' postgestational age, and it has been further standardized to include the need for oxygen therapy at 36 weeks' postgestational age to achieve oxygen saturation of 88% for 60 minutes or longer (Bancalari 2001).
The major risk factor for chronic lung disease is prematurity necessitating treatment with oxygen and mechanical ventilation (Avery 1987; Van Marter 2000), both of which are potentially modifiable. The pathogenesis of CLD involves barotrauma or volutrauma (due to assisted ventilation) that results in airway injury, smooth muscle hypertrophy, and parenchymal lung fibrosis and emphysematous changes, often complicated by inflammation, genetic predisposition, and concomitant abnormalities such as patent ductus arteriosus (PDA). CLD is also associated with increased risk of many cardiovascular abnormalities such as progressive pulmonary hypertension (due to hypoxia and vasoconstriction in the pulmonary vasculature), systemic hypertension, and left ventricular hypertrophy. It is important to note that whereas the survival of extremely low birth weight infants has increased over the years, rates of CLD have stayed relatively constant despite improving technology. CLD remains a serious problem; the incidence of CLD may be on the rise because of increased survival among the most vulnerable infants (Stoelhorst 2005).
Neonatologists have looked for noninvasive ways to support the breathing of preterm infants to avoid the need for mechanical ventilation.
Description of the intervention
Continuous distending airway pressure with the application of nasal constant positive airway pressure (NCPAP) has been used as a strategy for avoiding endotracheal tube ventilation, thereby minimizing the risk of CLD.
Historical analyses of nasal ventilation demonstrate a decreased incidence of BPD and reduced need for intubation in infants treated with noninvasive respiratory support. A study by Avery et al in 1987 demonstrated very different rates of CLD at eight institutions in the United States. The institution with the lowest rate of CLD, Columbia University, was also the institution with the highest use of nasal prong respiratory support in preterm infants with birth weight between 700 and 1500 grams. Infants showing signs of respiratory distress received nasal positive pressure support in the delivery room or within three hours of life. These infants were less likely than infants at other institutions to need mechanical ventilation, and they were less likely to develop BPD (Avery 1987).
Unfortunately, although at some centers NCPAP is a successful therapy for preterm infants, this success is not replicated at all centers. "Failures" of NCPAP are common, and many infants born at less than 28 weeks' gestation ultimately require endotracheal intubation and mechanical ventilation (Meyer 2004). In a randomized trial by Finer et al in 2004, infants who received NCPAP in the delivery room were no less likely than infants without NCPAP to need endotracheal intubation in the delivery room or in the subsequent first week of life. This study demonstrated instead a profound effect of gestational age on the need for intubation (virtually all infants born at 23 weeks required intubation vs only 14% of infants born at 27 weeks), regardless of the cohort to which they had been randomized (Finer 2004).
Nasal intermittent positive pressure ventilation (NIPPV) is a simple, effective mode of respiratory support. NIPPV augments continuous positive airway pressure (CPAP) with superimposed inflations to a set peak pressure. NIPPV may be delivered by nasal mask or prongs, which may be short or long, single or binasal. Some devices attempt to synchronize inflations with the infant's respiratory efforts.
How the intervention might work
NIPPV reduces asynchronous thoracoabdominal motion, perhaps as a result of reduced tube resistance or better stabilization of the chest wall, or both (Kiciman 1998). NIPPV results in improved tidal and minute volumes and decreased inspiratory effort required by neonates when compared with NCPAP (Moretti 1999). NIPPV may decrease the need for intubation and endotracheal tube ventilation and their associated risks. To evaluate the efficacy of NIPPV, these potential benefits should be weighed against the risks associated with delivery of positive pressure to the upper airway, pharynx, and esophagus. Potential risks of NIPPV include nasal septal injury and gastrointestinal perforation (Garland 1985).
Why it is important to do this review
Currently, two Cochrane reviews are comparing NCPAP versus NIPPV ‐ one for treatment of infants with apnea of prematurity (Lemyre 2002), and the other for prevention of extubation failure (Lemyre 2014).
The review by Lemyre et al titled "Nasal intermittent positive pressure ventilation (NIPPV) versus nasal continuous positive airway pressure (NCPAP) for preterm neonates after extubation" reveals a decreased need for reintubation among infants treated with NIPPV versus NCPAP. The review authors concluded that use of NIPPV may prevent extubation failure more effectively than use of NCPAP.
Thus, previous studies have shown that NIPPV may be superior to NCPAP in other clinical scenarios (eg, prevention of extubation failure, prevention of apnea), and it remains to be shown whether early NIPPV may provide similar benefit in preventing the primary need for intubation and mechanical ventilation when compared with NCPAP. This review seeks to determine whether NIPPV or NCPAP is a better primary mode of nasal ventilation for preventing respiratory failure, the need for intubation, and development of CLD, without causing harm such as air leak or intraventricular hemorrhage (IVH).
Objectives
To examine the risks and benefits of early NIPPV versus early NCPAP alone for preterm infants at risk of or in respiratory distress within the first hours after birth.
Primary endpoints are respiratory failure and the need for intubated ventilatory support during the first week of life. Secondary endpoints include chronic lung disease (oxygen therapy at 36 weeks' postmenstrual age), air leaks, duration of respiratory support, duration of oxygen therapy, IVH, and incidence of mortality.
Methods
Criteria for considering studies for this review
Types of studies
We considered randomized and quasi‐randomized trials for inclusion. We excluded cross‐over trials.
Types of participants
We included studies that enrolled newly born preterm infants. For this protocol, we defined newly born infants as infants less than six hours old, and preterm infants as those born at less than 37 weeks' gestational age. We included infants who received surfactant therapy if the duration of endotracheal intubation was short, and if application of NIPPV or NCPAP occurred before six hours of life.
Types of interventions
Intermittent positive pressure ventilation provided by a ventilator or a bilevel device and administered via the nasal route through short nasal prongs or nasopharyngeal tubes versus NCPAP delivered by the same methods. NIPPV included noninvasive support delivered by a mechanical ventilator or a bilevel device in a synchronized or nonsynchronized way.
Types of outcome measures
Primary outcomes
-
Respiratory failure: defined by respiratory acidosis, increased oxygen requirement, or apnea that was frequent or severe, leading to additional ventilatory support during the first week of life
-
Need for endotracheal tube (ETT) ventilation (intermittent positive pressure ventilation (IPPV) through an endotracheal tube)
Secondary outcomes
-
Mortality (neonatal and before discharge)
-
Major neurodevelopmental disability (cerebral palsy, developmental delay (Bayley or Griffith assessment greater than two standard deviations (SDs) below the mean) or intellectual impairment (intelligence quotient (IQ) greater than two SDs below the mean), blindness (vision < 6/60 in both eyes), sensorineural deafness requiring amplification)
-
Chronic lung disease (oxygen therapy at 36 weeks' postmenstrual age)
-
Pneumothorax
-
Patent ductus arteriosus
-
IVH (all grades) (Papile 1978)
-
Severe IVH (grade III/IV) (Papile 1978)
-
Necrotizing enterocolitis (Bell's ≥ stage 2) (Bell 1978)
-
Sepsis
-
Retinopathy of prematurity (≥ stage 3) (ICCROP 2005)
-
Duration of ETT ventilation (any)
-
Duration of oxygen dependence (days)
-
Duration of hospital stay (days)
-
Nasal septal injury
-
Gastrointestinal perforation
Search methods for identification of studies
Electronic searches
Please see study flow diagram (Figure 1).

Study flow diagram.
We used the criteria and standard methods of the Cochrane Collaboration and the Cochrane Neonatal Review Group (see the Cochrane Neonatal Group search strategy for specialized register).
We conducted a comprehensive search of the Cochrane Central Register of Controlled Trials (CENTRAL; 2015, Issue 9) in the Cochrane Library; MEDLINE via PubMed (1966 to September 28, 2015); Embase (1980 to September 28, 2015); and the Cumulative Index to Nursing and Allied Health Literature (CINAHL; 1982 to September 28, 2015) using the following search terms: (nasal continuous positive airway pressure OR NCPAP OR nasal intermittent positive pressure ventilation OR NIPPV OR nasal intermittent mandatory ventilation OR NIMV OR nasal distending pressure OR nasal positive pressure OR nasal ventilation OR non‐invasive positive pressure ventilation OR synchronized intermittent mandatory ventilation OR SIMV OR nasopharyngeal synchronized intermittent mandatory ventilation OR bilevel CPAP OR BiCPAP OR BiPAP OR SiPAP), plus database‐specific limiters for RCTs and neonates (see Appendix 2 for the full search strategies for each database). We applied no language restrictions.
We searched clinical trials registries for ongoing or recently completed trials (clinicaltrials.gov; the World Health Organization International Trials Registry and Platform (www.whoint/ictrp/search/en/); the ISRCTN Registry).
Searching other resources
We searched abstracts from the Pediatric Academic Society meetings (2011 to 2014) through abstract archives on the website (www.pas‐meeting.org). Members of the Cochrane Neonatal Review Group handsearched abstracts from the European Society of Pediatric Research (ESPR). We consulted experts in the field of neonatology in reference to other published articles.
Data collection and analysis
We used the standard method of conducting a systematic review, as described in the Cochrane Handbook for Systematic Reviews of Interventions, which can be found online at http://www.cochrane.org/training/cochrane‐handbook.
Selection of studies
Two review authors checked titles and abstracts identified through database searches. Review authors were not masked to authorship, journal, or results. Both review authors obtained the full text of all studies of possible relevance for independent assessment.
Data extraction and management
Two review authors independently extracted data. We contacted trial authors to request missing data if needed.
Assessment of risk of bias in included studies
We assessed risk of bias using the criteria outlined in the Cochrane Handbook for Systematic Reviews of Intervention (Higgins 2011) and presented this information in "Risk of bias tables" for the following domains.
-
Selection bias.
-
Performance bias.
-
Attrition bias.
-
Reporting bias.
-
Any other bias.
We resolved disagreements by discussion or by consultation with a third assessor. See Appendix 3 for a more detailed description of risk of bias for each domain.
Measures of treatment effect
For individual studies, we expressed results as risk ratios (RRs) and risk differences (RDs) with 95% confidence intervals (CIs) for dichotomous outcomes, and as mean differences (MDs and 95% CIs) for continuous outcomes.
Assessment of heterogeneity
We calculated the I2 statistic across trials using the Cochrane statistical package (RevMan 5.1) to test for significant heterogeneity. We explored possible sources of heterogeneity if the treatment effect showed moderate to high heterogeneity between studies, as described in the Cochrane Handbook for Systematic Reviews of Interventions, as an I2 statistic of > 50% heterogeneity.
Data synthesis
We synthesized data by using the standard method of the Cochrane Neonatal Review Group. We expressed results as typical risk ratios (RRs) and typical risk differences (RDs) with 95% confidence intervals (CIs) for dichotomous outcomes, and as weighted mean differences (WMDs and 95% CIs) for continuous outcomes, by using a fixed‐effect "assumption free" model.
Quality of evidence
We used the Grading of Recommendations Assessment, Development and Evaluation (GRADE) approach, as outlined in the GRADE Handbook (Schünemann 2013), to assess the quality of evidence for the following (clinically relevant) outcomes: respiratory failure, need for endotracheal tube ventilation (IPPV through an endotracheal tube), chronic lung disease (oxygen therapy at 36 weeks' postmenstrual age), pneumothorax, severe IVH (grade III/IV), and mortality (neonatal and before discharge) (post hoc).
Two review authors independently assessed the quality of evidence for each of the outcomes above. We considered evidence from RCTs as high quality but downgraded evidence one level for serious (or two levels for very serious) limitations on the basis of the following: design (risk of bias), consistency across studies, directness of the evidence, precision of estimates, and presence of publication bias. We used the GRADEpro 2008 Guideline Development Tool to create a ‘Summary of findings’ table to report the quality of the evidence.
The GRADE approach results in an assessment of the quality of a body of evidence by one of four grades.
-
High: We are very confident that the true effect lies close to that of the estimate of effect.
-
Moderate: We are moderately confident in the effect estimate: The true effect is likely to be close to the estimate of effect but may be substantially different.
-
Low: Our confidence in the effect estimate is limited: The true effect may be substantially different from the estimate of effect.
-
Very low: We have very little confidence in the effect estimate: The true effect is likely to be substantially different from the estimate of effect.
Subgroup analysis and investigation of heterogeneity
Planned subgroup analyses included gestational age (< 28 weeks vs ≥ 28 weeks), birth weight (< 1000 grams vs ≥ 1000 grams), whether infants received surfactant before randomization (via intubation‐surfactant‐extubation (INSURE) or prophylactic), whether NIPPV was delivered by a ventilator or by a bilevel device, and whether or not NIPPV was synchronized.
Results
Description of studies
Please see the Characteristics of included studies table.
Results of the search
The initial literature search returned 1160 potential articles or abstracts, of which 37 were of particular interest (full‐text review). See Figure 1.
Included studies
We identified 10 studies that met our inclusion criteria: Armanian 2014, Bisceglia 2007, Kirpalani 2013, Sai Sunil Kishore 2009, Kugelman 2007, Lista 2009, Meneses 2011, Ramanathan 2012, Salama 2015, and Wood 2013.
Armanian 2014 performed a quasi‐randomized trial that enrolled 98 infants (< 1501 grams and/or < 35 weeks) with respiratory distress syndrome (RDS) and a compatible chest x‐ray requiring noninvasive respiratory support after birth. Investigators randomized 44 infants to NIPPV and 54 to NCPAP, according to their medical chart number (odd or even number). All infants received aminophylline. A ventilator (unspecified) in the nonsynchronized mode provided NIPPV. The control group received bubble CPAP. Both groups used short binasal prongs. The primary outcome measure was respiratory failure with need for intubation within 48 hours. Secondary outcomes included need for surfactant, duration of oxygen, CLD, time to full feeds, length of hospital stay, pneumothorax, IVH, and PDA.
Bisceglia 2007 enrolled 88 preterm infants (28 to 34 weeks' gestational age) with mild to moderate RDS in the first four hours of birth. Investigators randomized 46 infants to NCPAP alone and 42 to NIPPV. They did not treat infants with aminophylline or caffeine, and they performed ventilation of both groups via nasal cannulae with the Bear Infant Ventilator CUB 750 (Ackrad Laboratories, Cranford, NJ, USA). Study authors did not synchronize NIPPV with spontaneous breathing. The primary outcome measured was number of infants needing intubation, and secondary outcomes included total duration of respiratory support, number of apneic episodes, and variation in blood gas levels. Upon receiving correspondence, study authors provided data for mortality at 28 days; presence of BPD, IVH, and necrotizing enterocolitis; and duration of hospital stay.
Kirpalani 2013 enrolled 1009 preterm infants (< 1000 grams and < 30 weeks). Researchers provided NIPPV by ventilator or bilevel device. Synchronization was allowed but was not mandatory. The primary outcome was death or moderate to severe BPD at 36 weeks. Among studied infants, 185 received noninvasive respiratory support from birth and were randomized in their first 24 hours (95 infants received NIPPV; 90 received NCPAP). We obtained data from study authors about these 185 infants for inclusion in this review.
Sai Sunil Kishore 2009 enrolled 76 infants (28 to 34 weeks' gestational age) with RDS in an RCT. Investigators randomized 37 infants to NIPPV and 39 NCPAP alone. They provided nasal respiratory support for infants by using VI P Bird‐R Sterling (Viasys Health Care, Conshohocken, PA, USA) and Drager Babylog 8000 (Drager Medical Inc, Lubeck, Germany) ventilators. NIPPV was nonsynchronized. Primary outcomes measured were failure of noninvasive respiratory support and need for intubation within the first 48 hours of randomization. Secondary outcomes included failure of nasal respiratory support within the first seven days, duration of respiratory support, duration of oxygen, duration of hospitalization, time to full feeds, air leaks, septicemia, upper airway injury, feed intolerance, abdominal distention, and bowel perforation.
Kugelman 2007 performed an RCT of 84 infants (24 to 34 weeks' gestational age) with RDS. Study authors randomized 41 infants to NCPAP alone and 43 to NIPPV. They administered both modes of respiratory support using the SLE 2000 (SLE Ltd, Surrey, UK) via nasal prongs and synchronized NIPPV with spontaneous breathing and with the infants' breathing. The primary outcome measured was need for mechanical ventilation, and secondary outcomes included blood pressure, heart rate, respiratory rate, blood gases, time needed to stop respiratory support, incidence of IVH, incidence of BPD, time to full feeds, and length of hospital stay.
Lista 2009 conducted an RCT of 40 infants (28 to 34 weeks' gestational age) with RDS diagnosed in the first hour of life. Researchers randomized 20 infants to NIPPV and 20 to NCPAP. They administered both treatments using Infant Flow (Becton, Dickinson and Company, Franklin Lakes, NJ, USA) devices, and they synchronized NIPPV. The primary outcome measured was cytokine levels, and secondary outcomes included heart rate, blood pressure, oxygen saturation, blood gas levels, length of ventilation, incidence of PDA, treatment with ibuprofen, treatment with surfactant, pneumothorax, IVH, and oxygen dependency at 28 days (or at 36 weeks' gestational age).
Meneses 2011 enrolled 200 infants (26 to 33 and 6/7 weeks' gestational age) with RDS in an RCT. Investigators randomized 100 infants to NIPPV and an equal number to NCPAP alone. They performed nasal respiratory support of infants using the InterMed continuous‐flow and bubble CPAP systems (InterMed Inc, São Paulo, Brazil) via binasal prongs. NIPPV was nonsynchronized. The primary outcome measured was need for intubation in the first 72 hours of life. Secondary outcomes included total duration of ETT ventilation, total duration on NCPAP, total duration on supplemental oxygen, pneumothorax, BPD, PDA, necrotizing enterocolitis, IVH (grade III/IV), retinopathy of prematurity (ROP) (≥ stage 3), time to full feeds, and length of hospital stay.
Ramanathan 2012 performed a randomized controlled multicenter trial. Within 120 minutes of delivery, they enrolled 110 infants born between 26 + 0 and 29 + 6 weeks who required intubation for respiratory distress. They randomized infants at the time they received surfactant to NIPPV, nonsynchronized, via a ventilator or a bilevel device, or to NCPAP (bubble CPAP, synchronized inspiratory positive airway pressure (SiPAP), or ventilator). The primary outcome was the need for mechanical ventilation at seven days. Secondary outcomes included number of doses of surfactant, days on a ventilator, days on CPAP, days on oxygen, mortality, air leak, pulmonary hemorrhage, PDA, IVH grade III/IV, spontaneous intestinal perforation, ROP stage 3 or higher, length of stay, and CLD.
Salama 2015 performed a quasi‐randomized trial that enrolled 60 infants (28 to 34 weeks with RDS). The population was mixed at randomization: Some infants had received prophylactic surfactant (those < 29 weeks) and others had not. Researchers randomized 30 infants to NIPPV, provided by a Neoport E100M ventilator (DRE Medical, Louisville, KY, USA) in the synchronized mode, and 30 infants to NCPAP (bubble CPAP). Randomization was based on admission numbers. The primary outcome was failure of noninvasive respiratory support with defined criteria. Secondary outcomes included duration of mechanical ventilation, nasal injury, abdominal distention, gastrointestinal perforation, pneumothorax, CLD, sepsis, and IVH.
Wood 2013 (abstract) performed a two‐center RCT that enrolled 120 infants at 28 + 0 to 31 + 6 weeks and less than 6 hours of life with respiratory distress. Infants did not receive surfactant before randomization. Study authors provided NIPPV (n = 60) using a SiPAP in the synchronized mode (Trigger); the control group received CPAP (n = 60) without additional settings. The primary outcome was failure of noninvasive support.
Excluded studies
See Characteristics of excluded studies.
Studies that evaluated infants with apnea included Gizzi 2015,Lin 1998,Lin 2011,Pantalitschka 2009, and Ryan 1989.
Studies that evaluated infants after extubation included Barrington 2001,Friedlich 1999,Gao 2010,Jasani 2016, Kahramaner 2014,Khalaf 2001,Khorana 2008,Moretti 2008, and O'Brien 2012.
Studies that were not RCTs (or quasi‐randomized trials) included Aghai 2006,Herber‐Jonat 2006,Liu 2003,Manzar 2004, and Migliori 2005.
Other studies included Bhandari 2007 (compared synchronized NIPPV vs mechanical ventilation), Baneshi 2014 (no report on primary outcome), Chen 2015 (enrolled twins only), Kugelman 2014a (compared high‐flow nasal cannula vs NIPPV), Salvo 2015 (compared two methods of providing NIPPV), Santin 2004 (compared NIPPV vs conventional ventilation), Shi 2010 (included term infants), Shi 2014 (included term infants), and Zhou 2015 (examined DuoPAP (Hamilton Medical, Bonaduz, Switzerland)).
Ongoing studies and studies awaiting classification included Chen 2013,Fu 2014,Gao 2014,Sasi 2013, and Silveira 2015.
Risk of bias in included studies
We assessed methodological quality using the criteria of the Cochrane Neonatal Review Group. See risk of bias descriptions in the Characteristics of included studies table and Figure 2 for details.

Methodological quality summary: review authors' judgements about each methodological quality item for each included study.
Effects of interventions
See: Summary of findings for the main comparison NIPPV versus NCPAP (by population)
NIPPV versus NCPAP (by population) (Comparison 1)
PRIMARY OUTCOME
Respiratory failure: defined by respiratory acidosis, increased oxygen requirement, or apnea that was frequent or severe, leading to additional ventilatory support during the first week of life (Outcome 1.1)
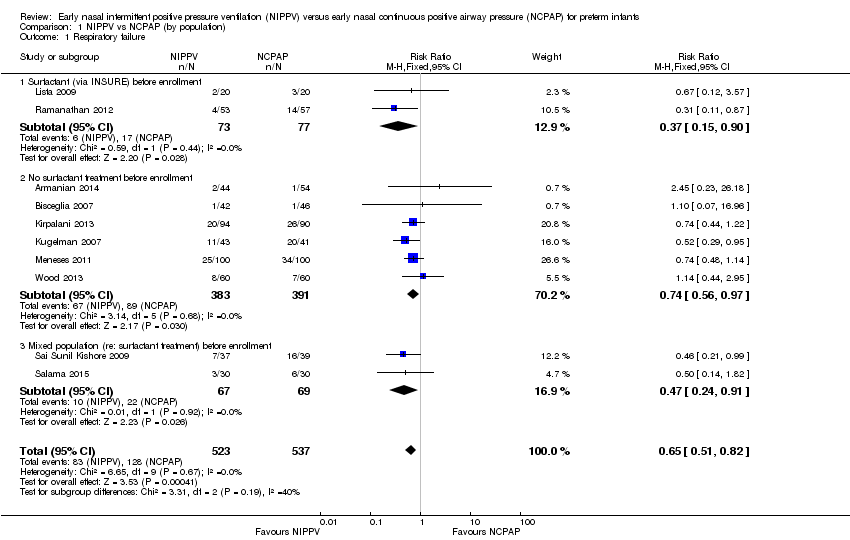
Overall, included trials enrolled 1061 preterm infants. Three of the 10 trials (Ramanathan 2012; Kugelman 2007; Sai Sunil Kishore 2009 showed statistically significant benefit for infants initially treated with NIPPV in terms of respiratory failure in the first week of life. Meta‐analysis showed that the effect was clinically important (typical risk ratio (RR) 0.65, 95% confidence interval (CI) 0.51 to 0.82; typical risk difference (RD) ‐0.09, 95% CI ‐0.13 to ‐0.04), with 11 infants (95% CI 8 to 25) needing to be treated with NIPPV to prevent one respiratory failure. We graded evidence for this outcome as moderate quality (unblinded intervention) (Analysis 1.1; Figure 3). Heterogeneity was low (for all outcomes).
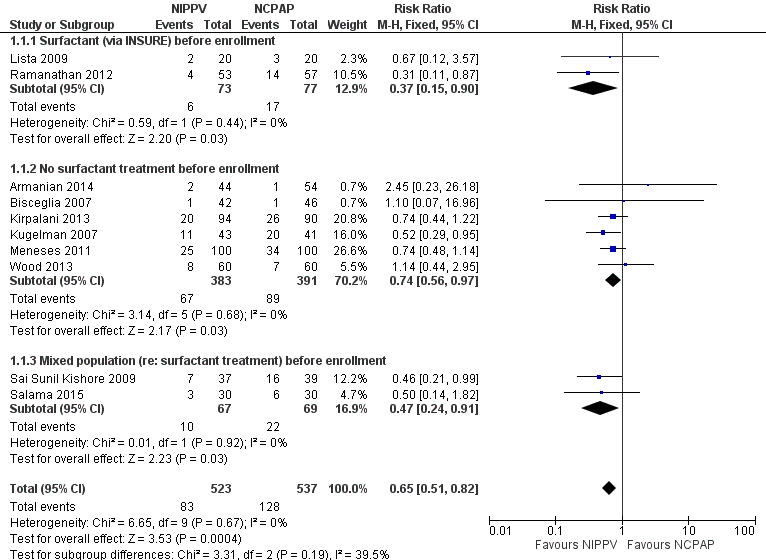
Forest plot of comparison: 1 NIPPV vs NCPAP (by population), outcome: 1.1 Respiratory failure.
Two studies (Lista 2009; Ramanathan 2012) included infants who received surfactant before randomization via INSURE. Six studies (Armanian 2014; Bisceglia 2007; Kirpalani 2013; Kugelman 2007; Meneses 2011; Wood 2013) included infants who did not receive surfactant, and two studies (Sai Sunil Kishore 2009; Salama 2015) included a mixed population of infants. The effect on respiratory failure was statistically significant in the three populations of infants studied.
Need for endotracheal tube ventilation (Outcome 1.2)
Nine trials reported on this outcome (n = 950), which could not be ascertained in one trial (Ramanathan 2012). Meta‐analysis showed statistically significant benefit for infants initially treated with NIPPV (typical RR 0.78, 95% CI 0.64 to 0.94; typical RD ‐0.07, 95% CI ‐0.12 to ‐0.02), with 17 infants (95% CI 8 to 50) needing to be treated with NIPPV to prevent one respiratory failure. We graded evidence for this outcome as moderate quality (unblinded intervention) (Analysis 1.2; Figure 4).

Forest plot of comparison: 1 NIPPV vs NCPAP (by population), outcome: 1.2 Need for intubation.
SECONDARY OUTCOMES
Mortality during study period (Outcome 1.3)
All trials reported this outcome. Overall, investigators noted no statistically significant reduction in mortality during neonatal intensive care unit (NICU) admission (typical RR 0.77, 95% CI 0.51 to 1.15). We graded evidence for this outcome as moderate quality (unblinded intervention) (Analysis 1.3; Figure 5).
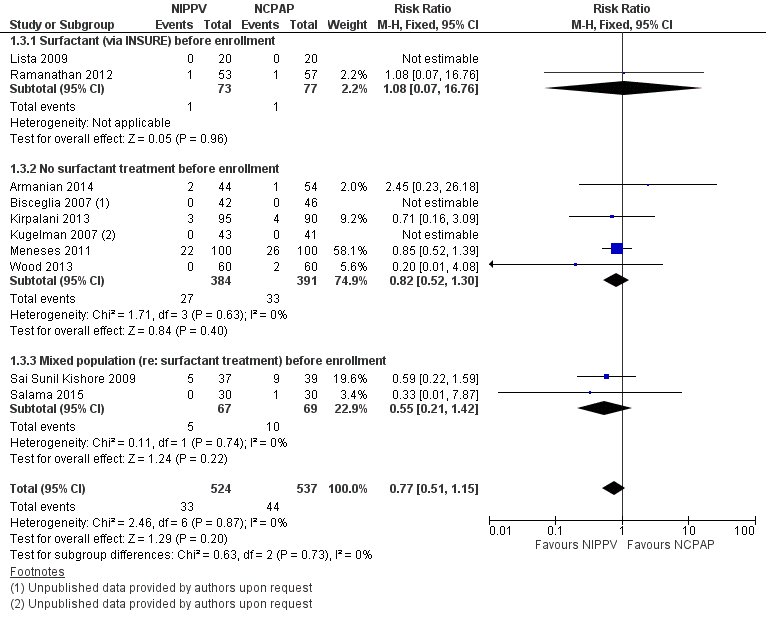
Forest plot of comparison: 1 NIPPV vs NCPAP (by population), outcome: 1.3 Mortality during study period.
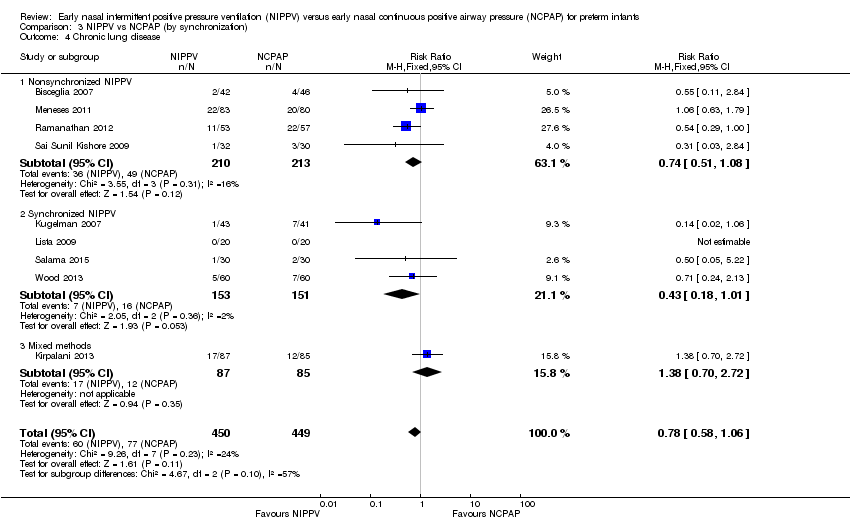
Chronic lung disease (need for oxygen at 36 weeks in surviving infants) (Outcome 1.4)
All trials except Armanian 2014 reported oxygen need at 36 weeks' corrected gestational age (CLD). Only one trial (Ramanathan 2012), in which infants received surfactant before randomization, reported a decrease in CLD. Meta‐analysis did not show a reduction in CLD (typical RR 0.78, 95% CI 0.58 to 1.06). We graded evidence for this outcome as moderate quality (unblinded intervention) (Analysis 1.4; Figure 6).

Forest plot of comparison: 1 NIPPV vs NCPAP (by population), outcome: 1.4 Chronic lung disease.
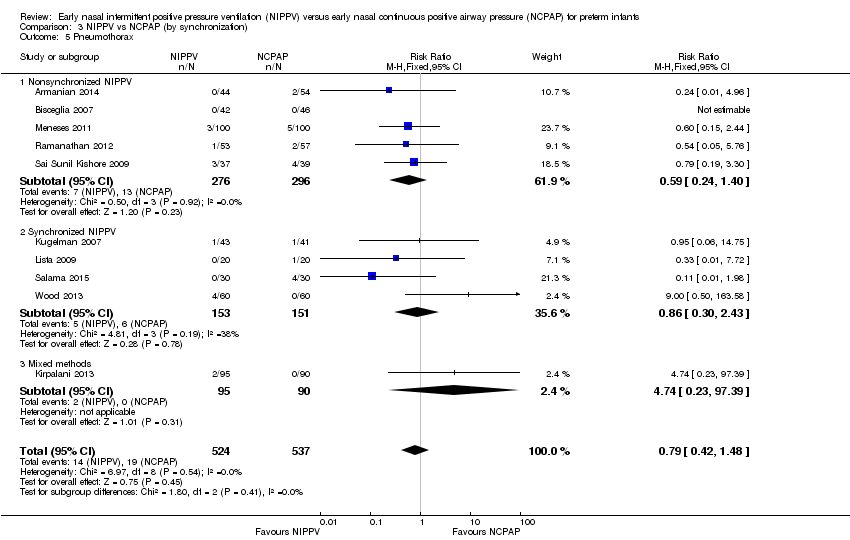
Pneumothorax (Outcome 1.5)
All 10 trials reported this outcome. Regardless of the population (surfactant or not before randomization), results showed no difference in the incidence of pneumothorax between infants randomized to NIPPV and those randomized to NCPAP (typical RR 0.79, 95% CI 0.42 to 1.48). We graded evidence for this outcome as moderate quality (unblinded intervention) (Analysis 1.5).
Intraventricular hemorrhage, all grades (Outcome 1.6)
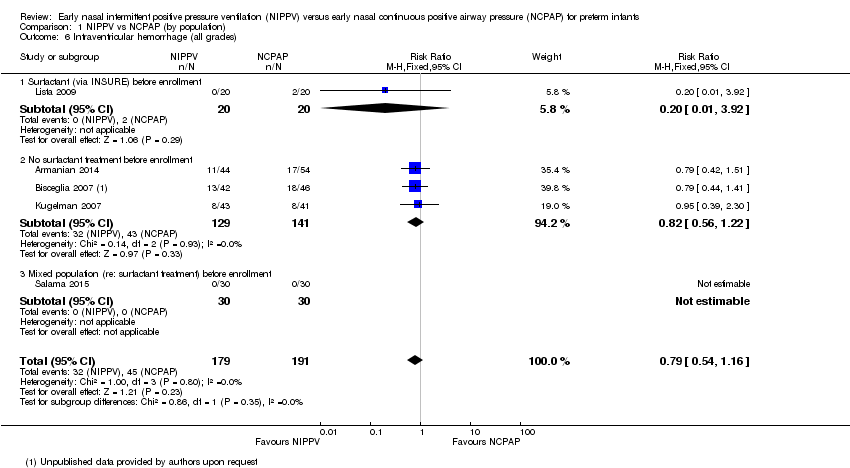
Five trials (Armanian 2014; Bisceglia 2007; Kugelman 2007; Lista 2009; Salama 2015) reported on this outcome. Sai Sunil Kishore 2009 reported a combined outcome of IVH and periventricular leukomalacia. No trial showed a difference in IVH between treatment groups (typical RR 0.79, 95% CI 0.54 to 1.16; typical RD ‐0.05, 95% CI ‐0.13 to 0.03). We graded evidence for this outcome as moderate quality (unblinded intervention) (Analysis 1.6).
Severe intraventricular hemorrhage, grade III/IV (Outcome 1.7)
Only four trials (n = 430) (Bisceglia 2007 (study authors provided on request); Kugelman 2007; Meneses 2011; Ramanathan 2012) reported on this outcome. No trial showed a reduction in IVH in one treatment group compared with the other (typical RR 1.26, 95% CI 0.53 to 3.01; typical RD 0.01, 95% CI ‐0.03 to 0.05). We graded evidence for this outcome as low quality (unblinded intervention and wide CI) (Analysis 1.7).
Necrotizing enterocolitis ≥ Bell's stage 2 (Outcome 1.8)
Seven trials (Bisceglia 2007; Sai Sunil Kishore 2009; Kugelman 2007; Lista 2009; Meneses 2011; Ramanathan 2012; Wood 2013) reported on this outcome. No trial showed a reduction in necrotizing enterocolitis stage 2 or greater in one treatment group compared with the other (typical RR 0.67, 95% CI 0.34 to 1.31; typical RD ‐0.02, 95% CI ‐0.05 to 0.01). We graded evidence for this outcome as moderate quality (unblinded intervention) (Analysis 1.8).
Sepsis (Outcome 1.9)
Only two studies (Sai Sunil Kishore 2009; Salama 2015) (n = 136) reported on this outcome. Results of meta‐analysis showed no difference between groups (typical RR 0.78, 95% CI 0.36 to 1.70; typical RD ‐0.04, 95% CI ‐0.16 to 0.08). We graded evidence for this outcome as moderate quality (unblinded intervention) (Analysis 1.9).
Retinopathy of prematurity (≥ stage 3) (Outcome 1.10)
Only two studies (Meneses 2011; Ramanathan 2012) (n = 245) reported on this outcome. Meta‐analysis showed no difference between groups (typical RR 1.50, 95% CI 0.65 to 3.44; typical RD 0.03, 95% CI ‐0.04 to 0.10). We graded evidence for this outcome as moderate quality (unblinded intervention) (Analysis 1.10).
Duration of endotracheal tube intubation
Three studies reported on this outcome; all included infants who did not receive surfactant before randomization. Duration of intubation and mechanical ventilation varied significantly between trials, with one trial reporting mean duration of seven to 12 hours (Bisceglia 2007) and the other two trials reporting mean duration between 10 and 13 days (Kugelman 2007; Meneses 2011). This heterogeneity precludes a meaningful meta‐analysis. Overall, no trial reported a clinically significant reduction in time required for mechanical ventilation in infants who received NIPPV. We graded evidence for this outcome as low quality (unblinded intervention and inconsistency).
Duration of oxygen dependence
Four studies reported this outcome (Sai Sunil Kishore 2009; Lista 2009; Meneses 2011; Ramanathan 2012) for 412 participants. These studies showed a high degree of heterogeneity, precluding meaningful meta‐analysis. Only one study (Ramanathan 2012), in which all infants received surfactant before randomization, demonstrated a reduction in the number of days on oxygen among infants who received NIPPV (29 days vs 38 days). We graded evidence for this outcome as low quaity (unblinded intervention and inconsistency).
Duration of hospital stay
Five trials (Armanian 2014; Sai Sunil Kishore 2009Kugelman 2007; Meneses 2011; Ramanathan 2012) reported this outcome (n = 554). Hospital stay ranged between 21 and 71 days with a high degree of heterogeneity between studies; therefore, we did not perform a meta‐analysis. Only one study (Armanian 2014) demonstrated a reduction in duration of stay (22 days in the NIPPV group vs 29 days in the CPAP group). We graded evidence for this outcome as low quality (unblinded intervention and inconsistency).
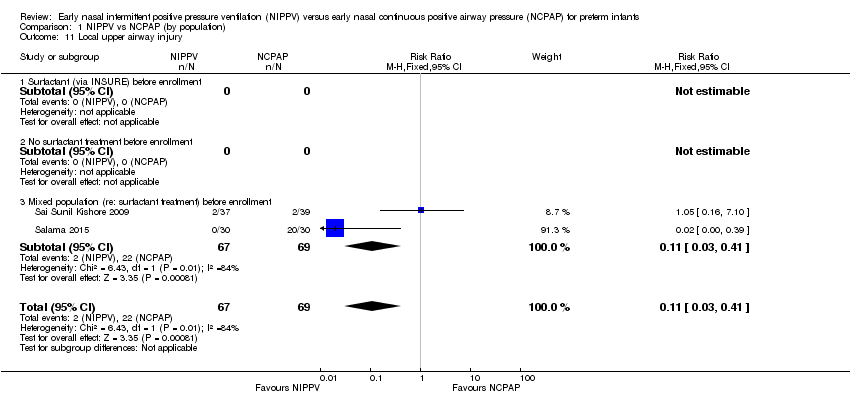
Upper airway injury (Outcome 1.11)
Sai Sunil Kishore 2009 reported two infants in each group with local upper airway injury. Study authors did not specify the nature of the injury and did not state whether it was nasal septal injury. Salama 2015 reported 20 cases of nasal injury in the NCPAP group (out of 30 infants) and none in the NIPPV group, without further description. We graded evidence for this outcome as low quality (unblinded intervention and imprecision) (Analysis 1.11).
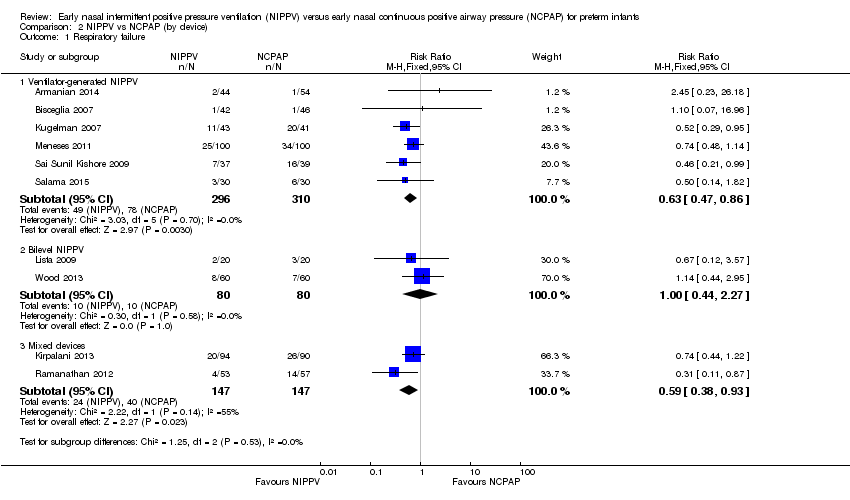
NIPPV versus NCPAP (by device) (Comparison 2)
Six trials used NIPPV delivered via ventilator (Bisceglia 2007; Sai Sunil Kishore 2009; Kugelman 2007; Meneses 2011; Armanian 2014; Salama 2015), two used bilevel devices (Lista 2009; Wood 2013), and two used both ventilator‐driven and bilevel devices (Kirpalani 2013; Ramanathan 2012). Two of the six trials using a ventilator to generate NIPPV showed benefit of NIPPV in preventing respiratory failure post extubation. Meta‐analysis of these six trials showed a reduction in rate of respiratory failure in the NIPPV group (typical RR 0.63, 95% CI 0.47 to 0.86) (Analysis 2.1). Results showed no evidence of benefit in the two trials using bilevel devices. One trial using both ventilators and bilevel devices (Ramanathan 2012) showed a reduction in respiratory failure at seven days (typical RR 0.31, 95% CI 0.11 to 0.87). Study authors provided no information on the relative proportion of infants who received NIPPV via ventilator or bilevel device (Analysis 2.1). Infants who received NIPPV via ventilator were intubated less often than those who received CPAP (typical RR 0.77, 95% CI 0.63 to 0.95; typical RD ‐0.08, 95% CI ‐0.14 to ‐0.02; number needed to treat for an additional beneficial outcome (NNTB) 13 (95% CI 7 to 50)) (Analysis 2.2).
When review authors examined CLD by device delivering NIPPV, we observed no reduction in CLD in any of the subgroups (Analysis 2.4). One trial using mixed devices showed a possible reduction in CLD in the NIPPV group, with the confidence interval including 1.0 (typical RR 0.54, 95% CI 0.29 to 1.0). We noted no difference in the rate of pneumothoraces between groups (Analysis 2.5) and no difference in mortality or severe IVH within subgroups (Analysis 2.3; Analysis 2.6).
Synchronized versus nonsynchronized NIPPV (Comparison 3)
Four studies used synchronized NIPPV (Kugelman 2007; Lista 2009; Salama 2015; Wood 2013), and five did not (Armanian 2014; Bisceglia 2007; Sai Sunil Kishore 2009; Meneses 2011; Ramanathan 2012). One study allowed both methods (Kirpalani 2013). Nonsynchronized studies (n = 572) showed overall benefit in reducing respiratory failure (typical RR 0.60, 95% CI 0.44 to 0.83), and synchronized studies (n = 304) did not demonstrate benefit (typical RR 0.65, 95% CI 0.41 to 1.02) (Analysis 3.1). Findings were similar when we examined the need for intubation: Nonsynchronized studies showed benefit (typical RR 0.74, 95% CI 0.60 to 0.92), and synchronized studies showed a trend toward benefit (typical RR 0.67, 95% CI 0.42 to 1.06) (Analysis 3.2). However, the subgroup difference was not statistically significant.
We noted no difference in mortality within subgroups (Analysis 3.3). When we examined CLD by synchronization, we found that no method showed statistically significant benefit (Analysis 3.4). We observed no difference in the rate of pneumothoraces between groups (Analysis 3.5). No study using synchronized NIPPV reported on severe IVH (Analysis 3.6).
Post hoc analysis
NIPPV versus NCPAP: high‐quality studies (by device) (Comparison 4)
Respiratory failure: high‐quality studies only (by device) (Outcome 4.1)
Overall, meta‐analysis of 10 studies enrolling 1061 infants revealed a clinically important reduction in respiratory failure (defined by respiratory acidosis, increased oxygen requirement, or apnea that was frequent or severe, leading to additional ventilatory support during the first week of life) (typical RR 0.65, 95% CI 0.51 to 0.82; typical RD ‐0.09, 95% CI ‐0.13 to ‐0.04), with 11 infants (95% CI 8 to 25) needing to be treated with NIPPV to prevent one respiratory failure. We graded evidence for this outcome as moderate quality (unblinded intervention).
Owing to methodological limitations (risk of selection bias) in two studies (Armanian 2014; Salama 2015), we performed a post hoc analysis for the outcome respiratory failure post extubation, including only higher‐quality studies in the analysis (Analysis 4.1). Results were largely unchanged (typical RR 0.64, 95% CI 0.50 to 0.82; typical RD ‐0.10, 95% CI ‐0.15 to ‐0.04).
Discussion
The meta‐analysis performed in this review showed a strong effect of nasal intermittent positive pressure ventilation (NIPPV) on prevention of respiratory failure or need for intubation the first few days after birth in infants with respiratory distress. Results showed no reduction in risk of chronic lung disease (CLD) overall but revealed a reduction in one trial, in which infants received surfactant before randomization. We identified no other short‐term benefit and no harm in any trials. Most included studies were small, single‐center trials. Eight of the 10 trials identified in this review had no major methodological limitations. Two trials were quasi‐randomized and had potential selection bias (Armanian 2014; Salama 2015), and one was reported as an abstract with clearly presented data (Wood 2013). Because of the nature of the interventions, it has been impossible to blind caregivers, and bias may have arisen through uneven use of co‐interventions. Investigators dealt with potential confounders, such as methylxanthine usage and indications for intubation, by having management protocols in place and by using objective respiratory failure criteria, enhancing confidence in study findings.
Because of the promising results of another related systematic review on NIPPV versus nasal continuous positive airway pressure (NCPAP) to aid with extubation (Lemyre 2014), it is reasonable to conclude that NIPPV might be more effective than NCPAP alone in providing respiratory support to preterm infants and in preventing the need for intubation. Results may have revealed differences in the effectiveness of different devices used to provide NIPPV (ventilator and bilevel); however, additional studies are needed to delineate this. We could not determine benefits for a subgroup of (smaller and more immature) infants included in this review. However, researchers should further assess benefits as well as relatively uncommon risks such as pneumothorax and severe intraventricular hemorrhage because occasionally large trials can disagree with the results of meta‐analysis of smaller trials (Cappelleri 1996; Villar 1995).

Study flow diagram.

Methodological quality summary: review authors' judgements about each methodological quality item for each included study.

Forest plot of comparison: 1 NIPPV vs NCPAP (by population), outcome: 1.1 Respiratory failure.

Forest plot of comparison: 1 NIPPV vs NCPAP (by population), outcome: 1.2 Need for intubation.

Forest plot of comparison: 1 NIPPV vs NCPAP (by population), outcome: 1.3 Mortality during study period.

Forest plot of comparison: 1 NIPPV vs NCPAP (by population), outcome: 1.4 Chronic lung disease.
Comparison 1 NIPPV vs NCPAP (by population), Outcome 1 Respiratory failure.

Comparison 1 NIPPV vs NCPAP (by population), Outcome 2 Need for intubation.

Comparison 1 NIPPV vs NCPAP (by population), Outcome 3 Mortality during study period.

Comparison 1 NIPPV vs NCPAP (by population), Outcome 4 Chronic lung disease.

Comparison 1 NIPPV vs NCPAP (by population), Outcome 5 Pneumothorax.
Comparison 1 NIPPV vs NCPAP (by population), Outcome 6 Intraventricular hemorrhage (all grades).

Comparison 1 NIPPV vs NCPAP (by population), Outcome 7 Severe intraventricular hemorrhage (grade III/IV).

Comparison 1 NIPPV vs NCPAP (by population), Outcome 8 Necrotizing enterocolitis (≥ Bell's stage 2).

Comparison 1 NIPPV vs NCPAP (by population), Outcome 9 Sepsis.

Comparison 1 NIPPV vs NCPAP (by population), Outcome 10 Retinopathy of prematurity (≥ stage 3).
Comparison 1 NIPPV vs NCPAP (by population), Outcome 11 Local upper airway injury.
Comparison 2 NIPPV vs NCPAP (by device), Outcome 1 Respiratory failure.

Comparison 2 NIPPV vs NCPAP (by device), Outcome 2 Need for intubation.

Comparison 2 NIPPV vs NCPAP (by device), Outcome 3 Mortality.

Comparison 2 NIPPV vs NCPAP (by device), Outcome 4 Chronic lung disease.

Comparison 2 NIPPV vs NCPAP (by device), Outcome 5 Pneumothorax.

Comparison 2 NIPPV vs NCPAP (by device), Outcome 6 Severe intraventricular hemorrhage (grade III/IV).

Comparison 3 NIPPV vs NCPAP (by synchronization), Outcome 1 Respiratory failure.

Comparison 3 NIPPV vs NCPAP (by synchronization), Outcome 2 Need for intubation.

Comparison 3 NIPPV vs NCPAP (by synchronization), Outcome 3 Mortality.
Comparison 3 NIPPV vs NCPAP (by synchronization), Outcome 4 Chronic lung disease.
Comparison 3 NIPPV vs NCPAP (by synchronization), Outcome 5 Pneumothorax.

Comparison 3 NIPPV vs NCPAP (by synchronization), Outcome 6 Severe intraventricular hemorrhage (grade III/IV).

Comparison 4 NIPPV vs NCPAP high‐quality studies only (by device), Outcome 1 Respiratory failure (high‐quality studies).
| NIPPV versus NCPAP (by population) | ||||||
| Patient or population: preterm infants | ||||||
| Outcomes | Anticipated absolute effects* | Relative effect | Number of participants | Quality of the evidence | Comments | |
| Risk with NCPAP | Risk with NIPPV | |||||
| Respiratory failure | Study population | RR 0.62 | 876 | Moderatea | Risk of bias: unblinded intervention Meets optimal information size (OIS) (N = 377) | |
| 251 per 1000 | 155 per 1000 | |||||
| Moderate | ||||||
| 175 per 1000 | 109 per 1000 | |||||
| Need for intubation | Study population | RR 0.79 | 766 | Moderatea | Risk of bias: unblinded intervention Does not meet OIS (N = 838) | |
| 300 per 1000 | 237 per 1000 | |||||
| Moderate | ||||||
| 175 per 1000 | 138 per 1000 | |||||
| Pneumothorax | Study population | RR 0.69 | 876 | Lowa,b | Risk of bias: unblinded intervention | |
| 43 per 1000 | 29 per 1000 | |||||
| Moderate | ||||||
| 44 per 1000 | 30 per 1000 | |||||
| Severe intraventricular hemorrhage (grade III/IV) | Study population | RR 1.26 | 430 | Very lowa,b | Risk of bias: unblinded intervention | |
| 37 per 1000 | 46 per 1000 | |||||
| Moderate | ||||||
| 49 per 1000 | 61 per 1000 | |||||
| Chronic lung disease | Study population | RR 0.67 | 727 | Moderatea | Risk of bias: unblinded intervention Does not meet OIS (N = 1250) | |
| 179 per 1000 | 120 per 1000 | |||||
| Moderate | ||||||
| 170 per 1000 | 114 per 1000 | |||||
| Mortality during study period | Study population | RR 0.77 | 876 | Lowa,b | Risk of bias: unblinded intervention | |
| 89 per 1000 | 69 per 1000 | |||||
| Low | ||||||
| 0 per 1000 | 0 per 1000 | |||||
| Moderate | ||||||
| 26 per 1000 | 20 per 1000 | |||||
| *The risk in the intervention group (and its 95% confidence interval) is based on the assumed risk in the comparison group and the relative effect of the intervention (and its 95% CI). | ||||||
| GRADE Working Group grades of evidence | ||||||
| aUnblinded intervention. bImprecision: wide confidence intervals. | ||||||
| Outcome or subgroup title | No. of studies | No. of participants | Statistical method | Effect size |
| 1 Respiratory failure Show forest plot | 10 | 1060 | Risk Ratio (M‐H, Fixed, 95% CI) | 0.65 [0.51, 0.82] |
| 1.1 Surfactant (via INSURE) before enrollment | 2 | 150 | Risk Ratio (M‐H, Fixed, 95% CI) | 0.37 [0.15, 0.90] |
| 1.2 No surfactant treatment before enrollment | 6 | 774 | Risk Ratio (M‐H, Fixed, 95% CI) | 0.74 [0.56, 0.97] |
| 1.3 Mixed population (re: surfactant treatment) before enrollment | 2 | 136 | Risk Ratio (M‐H, Fixed, 95% CI) | 0.47 [0.24, 0.91] |
| 2 Need for intubation Show forest plot | 9 | 950 | Risk Ratio (M‐H, Fixed, 95% CI) | 0.78 [0.64, 0.94] |
| 2.1 Surfactant (via INSURE) before enrollment | 1 | 40 | Risk Ratio (M‐H, Fixed, 95% CI) | 0.67 [0.12, 3.57] |
| 2.2 No surfactant treatment before enrollment | 6 | 774 | Risk Ratio (M‐H, Fixed, 95% CI) | 0.84 [0.69, 1.02] |
| 2.3 Mixed population (re: surfactant treatment) before enrollment | 2 | 136 | Risk Ratio (M‐H, Fixed, 95% CI) | 0.47 [0.24, 0.91] |
| 3 Mortality during study period Show forest plot | 10 | 1061 | Risk Ratio (M‐H, Fixed, 95% CI) | 0.77 [0.51, 1.15] |
| 3.1 Surfactant (via INSURE) before enrollment | 2 | 150 | Risk Ratio (M‐H, Fixed, 95% CI) | 1.08 [0.07, 16.76] |
| 3.2 No surfactant treatment before enrollment | 6 | 775 | Risk Ratio (M‐H, Fixed, 95% CI) | 0.82 [0.52, 1.30] |
| 3.3 Mixed population (re: surfactant treatment) before enrollment | 2 | 136 | Risk Ratio (M‐H, Fixed, 95% CI) | 0.55 [0.21, 1.42] |
| 4 Chronic lung disease Show forest plot | 9 | 899 | Risk Ratio (M‐H, Fixed, 95% CI) | 0.78 [0.58, 1.06] |
| 4.1 Surfactant (via INSURE) before enrollment | 2 | 150 | Risk Ratio (M‐H, Fixed, 95% CI) | 0.54 [0.29, 1.00] |
| 4.2 No surfactant treatment before enrollment | 5 | 627 | Risk Ratio (M‐H, Fixed, 95% CI) | 0.92 [0.64, 1.32] |
| 4.3 Mixed population (re: surfactant treatment) before enrollment | 2 | 122 | Risk Ratio (M‐H, Fixed, 95% CI) | 0.39 [0.08, 1.91] |
| 5 Pneumothorax Show forest plot | 10 | 1061 | Risk Ratio (M‐H, Fixed, 95% CI) | 0.79 [0.42, 1.48] |
| 5.1 Surfactant (via INSURE) before enrollment | 2 | 150 | Risk Ratio (M‐H, Fixed, 95% CI) | 0.45 [0.07, 2.94] |
| 5.2 No surfactant treatment before enrollment | 6 | 775 | Risk Ratio (M‐H, Fixed, 95% CI) | 1.23 [0.52, 2.91] |
| 5.3 Mixed population (re: surfactant treatment) before enrollment | 2 | 136 | Risk Ratio (M‐H, Fixed, 95% CI) | 0.43 [0.13, 1.41] |
| 6 Intraventricular hemorrhage (all grades) Show forest plot | 5 | 370 | Risk Ratio (M‐H, Fixed, 95% CI) | 0.79 [0.54, 1.16] |
| 6.1 Surfactant (via INSURE) before enrollment | 1 | 40 | Risk Ratio (M‐H, Fixed, 95% CI) | 0.2 [0.01, 3.92] |
| 6.2 No surfactant treatment before enrollment | 3 | 270 | Risk Ratio (M‐H, Fixed, 95% CI) | 0.82 [0.56, 1.22] |
| 6.3 Mixed population (re: surfactant treatment) before enrollment | 1 | 60 | Risk Ratio (M‐H, Fixed, 95% CI) | 0.0 [0.0, 0.0] |
| 7 Severe intraventricular hemorrhage (grade III/IV) Show forest plot | 4 | 430 | Risk Ratio (M‐H, Fixed, 95% CI) | 1.26 [0.53, 3.01] |
| 7.1 Surfactant (via INSURE) before enrollment | 1 | 110 | Risk Ratio (M‐H, Fixed, 95% CI) | 5.37 [0.26, 109.35] |
| 7.2 No surfactant treatment before enrollment | 3 | 320 | Risk Ratio (M‐H, Fixed, 95% CI) | 1.01 [0.39, 2.59] |
| 7.3 Mixed population (re: surfactant treatment) before enrollment | 0 | 0 | Risk Ratio (M‐H, Fixed, 95% CI) | 0.0 [0.0, 0.0] |
| 8 Necrotizing enterocolitis (≥ Bell's stage 2) Show forest plot | 7 | 718 | Risk Ratio (M‐H, Fixed, 95% CI) | 0.67 [0.34, 1.31] |
| 8.1 Surfactant (via INSURE) before enrollment | 2 | 150 | Risk Ratio (M‐H, Fixed, 95% CI) | 0.54 [0.10, 2.82] |
| 8.2 No surfactant treatment before enrollment | 4 | 492 | Risk Ratio (M‐H, Fixed, 95% CI) | 0.58 [0.25, 1.33] |
| 8.3 Mixed population (re: surfactant treatment) before enrollment | 1 | 76 | Risk Ratio (M‐H, Fixed, 95% CI) | 1.58 [0.28, 8.93] |
| 9 Sepsis Show forest plot | 2 | 136 | Risk Ratio (M‐H, Fixed, 95% CI) | 0.78 [0.36, 1.70] |
| 9.1 Surfactant (via INSURE) before enrollment | 0 | 0 | Risk Ratio (M‐H, Fixed, 95% CI) | 0.0 [0.0, 0.0] |
| 9.2 No surfactant treatment before enrollment | 0 | 0 | Risk Ratio (M‐H, Fixed, 95% CI) | 0.0 [0.0, 0.0] |
| 9.3 Mixed population (re: surfactant treatment) before enrollment | 2 | 136 | Risk Ratio (M‐H, Fixed, 95% CI) | 0.78 [0.36, 1.70] |
| 10 Retinopathy of prematurity (≥ stage 3) Show forest plot | 2 | 245 | Risk Ratio (M‐H, Fixed, 95% CI) | 1.50 [0.65, 3.44] |
| 10.1 Surfactant (via INSURE) before enrollment | 1 | 110 | Risk Ratio (M‐H, Fixed, 95% CI) | 3.22 [0.13, 77.41] |
| 10.2 No surfactant treatment before enrollment | 1 | 135 | Risk Ratio (M‐H, Fixed, 95% CI) | 1.39 [0.58, 3.30] |
| 10.3 Mixed population (re: surfactant treatment) before enrollment | 0 | 0 | Risk Ratio (M‐H, Fixed, 95% CI) | 0.0 [0.0, 0.0] |
| 11 Local upper airway injury Show forest plot | 2 | 136 | Risk Ratio (M‐H, Fixed, 95% CI) | 0.11 [0.03, 0.41] |
| 11.1 Surfactant (via INSURE) before enrollment | 0 | 0 | Risk Ratio (M‐H, Fixed, 95% CI) | 0.0 [0.0, 0.0] |
| 11.2 No surfactant treatment before enrollment | 0 | 0 | Risk Ratio (M‐H, Fixed, 95% CI) | 0.0 [0.0, 0.0] |
| 11.3 Mixed population (re: surfactant treatment) before enrollment | 2 | 136 | Risk Ratio (M‐H, Fixed, 95% CI) | 0.11 [0.03, 0.41] |
| Outcome or subgroup title | No. of studies | No. of participants | Statistical method | Effect size |
| 1 Respiratory failure Show forest plot | 10 | Risk Ratio (M‐H, Fixed, 95% CI) | Subtotals only | |
| 1.1 Ventilator‐generated NIPPV | 6 | 606 | Risk Ratio (M‐H, Fixed, 95% CI) | 0.63 [0.47, 0.86] |
| 1.2 Bilevel NIPPV | 2 | 160 | Risk Ratio (M‐H, Fixed, 95% CI) | 1.0 [0.44, 2.27] |
| 1.3 Mixed devices | 2 | 294 | Risk Ratio (M‐H, Fixed, 95% CI) | 0.59 [0.38, 0.93] |
| 2 Need for intubation Show forest plot | 10 | Risk Difference (M‐H, Fixed, 95% CI) | Subtotals only | |
| 2.1 Ventilator‐generated NIPPV | 6 | 606 | Risk Difference (M‐H, Fixed, 95% CI) | ‐0.08 [‐0.14, ‐0.02] |
| 2.2 Bilevel NIPPV | 2 | 160 | Risk Difference (M‐H, Fixed, 95% CI) | 0.0 [‐0.10, 0.10] |
| 2.3 Mixed devices | 2 | 294 | Risk Difference (M‐H, Fixed, 95% CI) | ‐0.11 [‐0.20, ‐0.02] |
| 3 Mortality Show forest plot | 9 | 977 | Risk Ratio (M‐H, Fixed, 95% CI) | 0.77 [0.51, 1.15] |
| 3.1 Ventilator‐generated NIPPV | 5 | 522 | Risk Ratio (M‐H, Fixed, 95% CI) | 0.80 [0.52, 1.23] |
| 3.2 Bilevel NIPPV | 2 | 160 | Risk Ratio (M‐H, Fixed, 95% CI) | 0.2 [0.01, 4.08] |
| 3.3 Mixed devices | 2 | 295 | Risk Ratio (M‐H, Fixed, 95% CI) | 0.78 [0.21, 2.83] |
| 4 Chronic lung disease Show forest plot | 9 | Risk Ratio (M‐H, Fixed, 95% CI) | Subtotals only | |
| 4.1 Ventilator‐generated NIPPV | 5 | 457 | Risk Ratio (M‐H, Fixed, 95% CI) | 0.73 [0.47, 1.15] |
| 4.2 Bilevel NIPPV | 2 | 160 | Risk Ratio (M‐H, Fixed, 95% CI) | 0.71 [0.24, 2.13] |
| 4.3 Mixed devices | 2 | 282 | Risk Ratio (M‐H, Fixed, 95% CI) | 0.85 [0.54, 1.32] |
| 5 Pneumothorax Show forest plot | 10 | Risk Ratio (M‐H, Fixed, 95% CI) | Subtotals only | |
| 5.1 Ventilator‐generated NIPPV | 6 | 606 | Risk Ratio (M‐H, Fixed, 95% CI) | 0.49 [0.21, 1.11] |
| 5.2 Bilevel NIPPV | 2 | 160 | Risk Ratio (M‐H, Fixed, 95% CI) | 2.5 [0.49, 12.67] |
| 5.3 Mixed devices | 2 | 295 | Risk Ratio (M‐H, Fixed, 95% CI) | 1.42 [0.28, 7.29] |
| 6 Severe intraventricular hemorrhage (grade III/IV) Show forest plot | 3 | 346 | Risk Ratio (M‐H, Fixed, 95% CI) | 1.35 [0.51, 3.62] |
| 6.1 Ventilator‐generated NIPPV | 2 | 236 | Risk Ratio (M‐H, Fixed, 95% CI) | 1.03 [0.35, 3.04] |
| 6.2 Mixed devices | 1 | 110 | Risk Ratio (M‐H, Fixed, 95% CI) | 5.37 [0.26, 109.35] |
| Outcome or subgroup title | No. of studies | No. of participants | Statistical method | Effect size |
| 1 Respiratory failure Show forest plot | 10 | 1060 | Risk Ratio (M‐H, Fixed, 95% CI) | 0.64 [0.51, 0.81] |
| 1.1 Nonsynchronized NIPPV | 5 | 572 | Risk Ratio (M‐H, Fixed, 95% CI) | 0.60 [0.44, 0.83] |
| 1.2 Synchronized NIPPV | 4 | 304 | Risk Ratio (M‐H, Fixed, 95% CI) | 0.65 [0.41, 1.02] |
| 1.3 Mixed methods | 1 | 184 | Risk Ratio (M‐H, Fixed, 95% CI) | 0.74 [0.44, 1.22] |
| 2 Need for intubation Show forest plot | 10 | 1060 | Risk Ratio (M‐H, Fixed, 95% CI) | 0.73 [0.61, 0.87] |
| 2.1 Nonsynchronized NIPPV | 5 | 572 | Risk Ratio (M‐H, Fixed, 95% CI) | 0.74 [0.60, 0.92] |
| 2.2 Synchronized NIPPV | 4 | 304 | Risk Ratio (M‐H, Fixed, 95% CI) | 0.67 [0.42, 1.06] |
| 2.3 Mixed methods | 1 | 184 | Risk Ratio (M‐H, Fixed, 95% CI) | 0.74 [0.44, 1.22] |
| 3 Mortality Show forest plot | 9 | 977 | Risk Ratio (M‐H, Fixed, 95% CI) | 0.77 [0.51, 1.15] |
| 3.1 Synchronized NIPPV | 3 | 220 | Risk Ratio (M‐H, Fixed, 95% CI) | 0.25 [0.03, 2.19] |
| 3.2 Nonsynchronized NIPPV | 5 | 572 | Risk Ratio (M‐H, Fixed, 95% CI) | 0.83 [0.54, 1.27] |
| 3.3 Mixed methods | 1 | 185 | Risk Ratio (M‐H, Fixed, 95% CI) | 0.71 [0.16, 3.09] |
| 4 Chronic lung disease Show forest plot | 9 | 899 | Risk Ratio (M‐H, Fixed, 95% CI) | 0.78 [0.58, 1.06] |
| 4.1 Nonsynchronized NIPPV | 4 | 423 | Risk Ratio (M‐H, Fixed, 95% CI) | 0.74 [0.51, 1.08] |
| 4.2 Synchronized NIPPV | 4 | 304 | Risk Ratio (M‐H, Fixed, 95% CI) | 0.43 [0.18, 1.01] |
| 4.3 Mixed methods | 1 | 172 | Risk Ratio (M‐H, Fixed, 95% CI) | 1.38 [0.70, 2.72] |
| 5 Pneumothorax Show forest plot | 10 | 1061 | Risk Ratio (M‐H, Fixed, 95% CI) | 0.79 [0.42, 1.48] |
| 5.1 Nonsynchronized NIPPV | 5 | 572 | Risk Ratio (M‐H, Fixed, 95% CI) | 0.59 [0.24, 1.40] |
| 5.2 Synchronized NIPPV | 4 | 304 | Risk Ratio (M‐H, Fixed, 95% CI) | 0.86 [0.30, 2.43] |
| 5.3 Mixed methods | 1 | 185 | Risk Ratio (M‐H, Fixed, 95% CI) | 4.74 [0.23, 97.39] |
| 6 Severe intraventricular hemorrhage (grade III/IV) Show forest plot | 3 | 346 | Risk Ratio (M‐H, Fixed, 95% CI) | 1.35 [0.51, 3.62] |
| 6.1 Synchronized NIPPV | 0 | 0 | Risk Ratio (M‐H, Fixed, 95% CI) | 0.0 [0.0, 0.0] |
| 6.2 Nonsynchronized NIPPV | 3 | 346 | Risk Ratio (M‐H, Fixed, 95% CI) | 1.35 [0.51, 3.62] |
| Outcome or subgroup title | No. of studies | No. of participants | Statistical method | Effect size |
| 1 Respiratory failure (high‐quality studies) Show forest plot | 8 | 902 | Risk Ratio (M‐H, Fixed, 95% CI) | 0.64 [0.50, 0.82] |
| 1.1 Ventilator‐generated NIPPV | 4 | 448 | Risk Ratio (M‐H, Fixed, 95% CI) | 0.62 [0.45, 0.85] |
| 1.2 Bilevel NIPPV | 2 | 160 | Risk Ratio (M‐H, Fixed, 95% CI) | 1.0 [0.44, 2.27] |
| 1.3 Mixed devices | 2 | 294 | Risk Ratio (M‐H, Fixed, 95% CI) | 0.59 [0.38, 0.93] |