مقایسه تهویه با فشار مثبت متناوب از راه بینی (NIPPV) زودهنگام در برابر تهویه با فشار مثبت مداوم راه هوایی از راه بینی (NCPAP) زودهنگام برای نوزادان پرهترم
Appendices
Appendix 1. Abbreviations used in this review
NIPPV: nasal intermittent positive pressure ventilation.
NCPAP: nasal continuous positive pressure ventilation.
RDS: respiratory distress syndrome.
BPD: bronchopulmonary dysplasia.
IVH: intraventricular hemorrhage.
Appendix 2. Standard search methods
PubMed: ((infant, newborn[MeSH] OR newborn OR neonate OR neonatal OR premature OR low birth weight OR VLBW OR LBW or infan* or neonat*) AND (randomised controlled trial [pt] OR controlled clinical trial [pt] OR Clinical Trial[ptyp] OR randomized [tiab] OR placebo [tiab] OR clinical trials as topic [mesh: noexp] OR randomly [tiab] OR trial [ti]) NOT (animals [mh] NOT humans [mh]))
Embase: (infant, newborn or newborn or neonate or neonatal or premature or very low birth weight or low birth weight or VLBW or LBW or Newborn or infan* or neonat*) AND (human not animal) AND (randomized controlled trial or controlled clinical trial or randomized or placebo or clinical trials as topic or randomly or trial or clinical trial)
CINAHL: (infant, newborn OR newborn OR neonate OR neonatal OR premature OR low birth weight OR VLBW OR LBW or Newborn or infan* or neonat*) AND (randomized controlled trial OR controlled clinical trial OR randomized OR placebo OR clinical trials as topic OR randomly OR trial OR PT clinical trial)
Cochrane Library: (infant or newborn or neonate or neonatal or premature or very low birth weight or low birth weight or VLBW or LBW)
Appendix 3. Risk of bias tool
The following issues were evaluated and entered into the risk of bias table:
1. Sequence generation (checking for possible selection bias). Was the allocation sequence adequately generated?
For each included study, we categorized the method used to generate the allocation sequence as:
a. low risk (any truly random process, eg, random number table, computer random number generator);
b. high risk (any nonrandom process, eg, odd or even date of birth, hospital or clinic record number); or
c. unclear risk.
2. Allocation concealment (checking for possible selection bias). Was allocation adequately concealed?
For each included study, we categorized the method used to conceal the allocation sequence as:
a. low risk (eg, telephone or central randomization, consecutively numbered sealed opaque envelopes);
b. high risk (open random allocation, eg, unsealed or nonopaque envelopes, alternation, date of birth); or
c. unclear risk.
3. Blinding (checking for possible performance bias). Was knowledge of the allocated intervention adequately prevented during the study? At study entry? At the time of outcome assessment?
For each included study, we categorized the methods used to blind study participants and personnel from knowledge of which intervention a participant received. Blinding was assessed separately for different outcomes or classes of outcomes. We categorized the methods as:
a. low risk, high risk or unclear risk for participants;
b. low risk, high risk or unclear risk for personnel; or
c. low risk, high risk or unclear risk for outcome assessors.
4. Incomplete outcome data (checking for possible attrition bias through withdrawals, dropouts, protocol deviations). Were incomplete outcome data adequately addressed?
For each included study and for each outcome, we described the completeness of data including attrition and exclusions from the analysis. We noted whether attrition and exclusions were reported, the numbers included in the analysis at each stage (compared with the total randomized participants), reasons for attrition or exclusion when reported, and whether missing data were balanced across groups or were related to outcomes. When sufficient information was reported or supplied by trial authors, we re‐included missing data in the analyses. We categorized the methods as:
a. low risk (< 20% missing data);
b. high risk (≥ 20% missing data); or
c. unclear risk.
5. Selective reporting bias. Are reports of the study free of suggestion of selective outcome reporting?
For each included study, we described how we investigated the possibility of selective outcome reporting bias and what we found. We assessed the methods as:
a. low risk (when it is clear that all of the study’s prespecified outcomes and all expected outcomes of interest to the review have been reported);
b. high risk (when not all of the study’s prespecified outcomes have been reported; one or more reported primary outcomes were not prespecified; outcomes of interest were reported incompletely and so cannot be used; study failed to include results of a key outcome that would have been expected to have been reported); or
c. unclear risk.
6. Other sources of bias. Was the study apparently free of other problems that could put it at high risk of bias?
For each included study, we described any important concerns that we had about other possible sources of bias (eg, whether a potential source of bias was related to the specific study design, whether the trial was stopped early owing to some data‐dependent process). We assessed whether each study was free of other problems that could put it at risk of bias as:
a. low risk;
b. high risk; or
c. unclear risk.
If needed, we planned to explore the impact of the level of bias by undertaking sensitivity analyses.

Study flow diagram.

Methodological quality summary: review authors' judgements about each methodological quality item for each included study.

Forest plot of comparison: 1 NIPPV vs NCPAP (by population), outcome: 1.1 Respiratory failure.

Forest plot of comparison: 1 NIPPV vs NCPAP (by population), outcome: 1.2 Need for intubation.
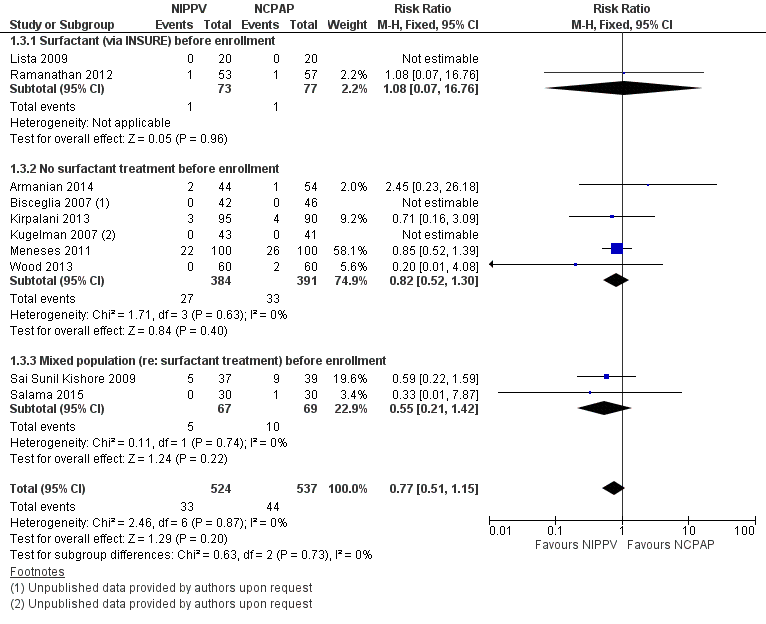
Forest plot of comparison: 1 NIPPV vs NCPAP (by population), outcome: 1.3 Mortality during study period.

Forest plot of comparison: 1 NIPPV vs NCPAP (by population), outcome: 1.4 Chronic lung disease.
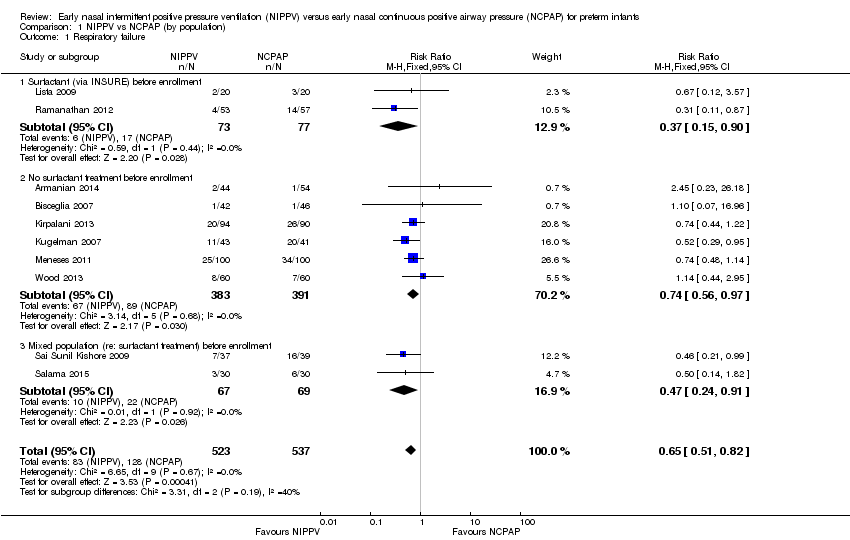
Comparison 1 NIPPV vs NCPAP (by population), Outcome 1 Respiratory failure.

Comparison 1 NIPPV vs NCPAP (by population), Outcome 2 Need for intubation.

Comparison 1 NIPPV vs NCPAP (by population), Outcome 3 Mortality during study period.

Comparison 1 NIPPV vs NCPAP (by population), Outcome 4 Chronic lung disease.

Comparison 1 NIPPV vs NCPAP (by population), Outcome 5 Pneumothorax.
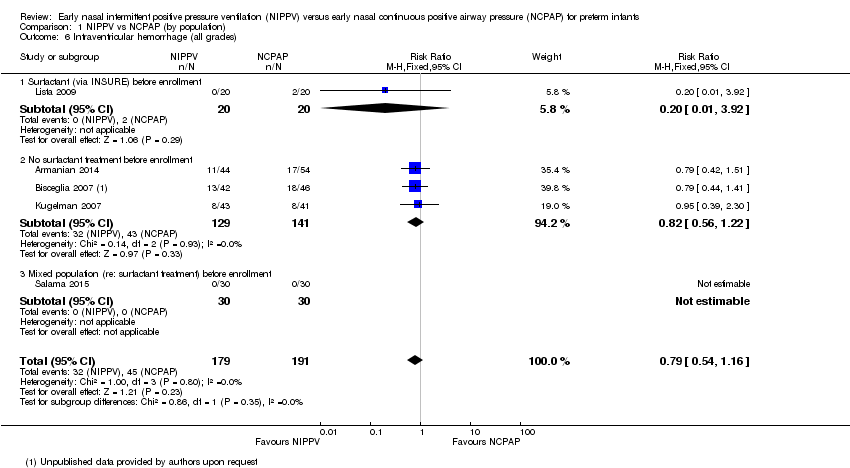
Comparison 1 NIPPV vs NCPAP (by population), Outcome 6 Intraventricular hemorrhage (all grades).

Comparison 1 NIPPV vs NCPAP (by population), Outcome 7 Severe intraventricular hemorrhage (grade III/IV).

Comparison 1 NIPPV vs NCPAP (by population), Outcome 8 Necrotizing enterocolitis (≥ Bell's stage 2).

Comparison 1 NIPPV vs NCPAP (by population), Outcome 9 Sepsis.

Comparison 1 NIPPV vs NCPAP (by population), Outcome 10 Retinopathy of prematurity (≥ stage 3).
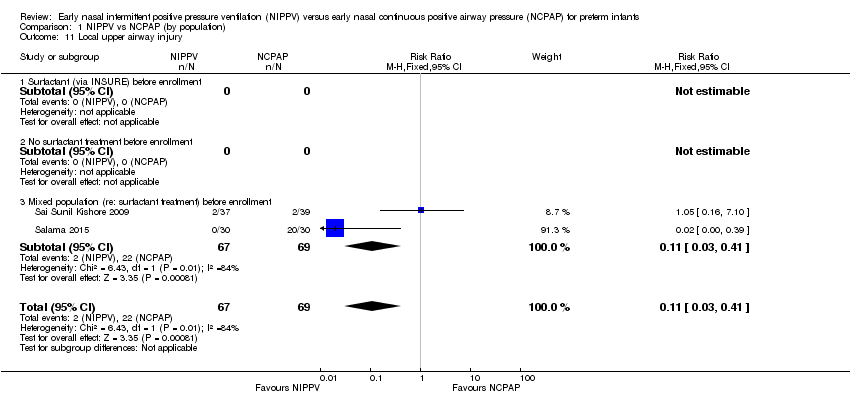
Comparison 1 NIPPV vs NCPAP (by population), Outcome 11 Local upper airway injury.
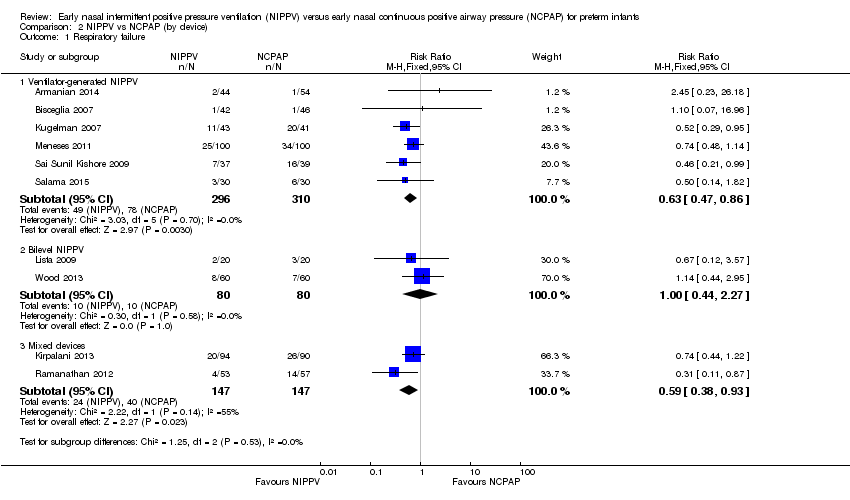
Comparison 2 NIPPV vs NCPAP (by device), Outcome 1 Respiratory failure.

Comparison 2 NIPPV vs NCPAP (by device), Outcome 2 Need for intubation.

Comparison 2 NIPPV vs NCPAP (by device), Outcome 3 Mortality.

Comparison 2 NIPPV vs NCPAP (by device), Outcome 4 Chronic lung disease.

Comparison 2 NIPPV vs NCPAP (by device), Outcome 5 Pneumothorax.

Comparison 2 NIPPV vs NCPAP (by device), Outcome 6 Severe intraventricular hemorrhage (grade III/IV).

Comparison 3 NIPPV vs NCPAP (by synchronization), Outcome 1 Respiratory failure.

Comparison 3 NIPPV vs NCPAP (by synchronization), Outcome 2 Need for intubation.

Comparison 3 NIPPV vs NCPAP (by synchronization), Outcome 3 Mortality.
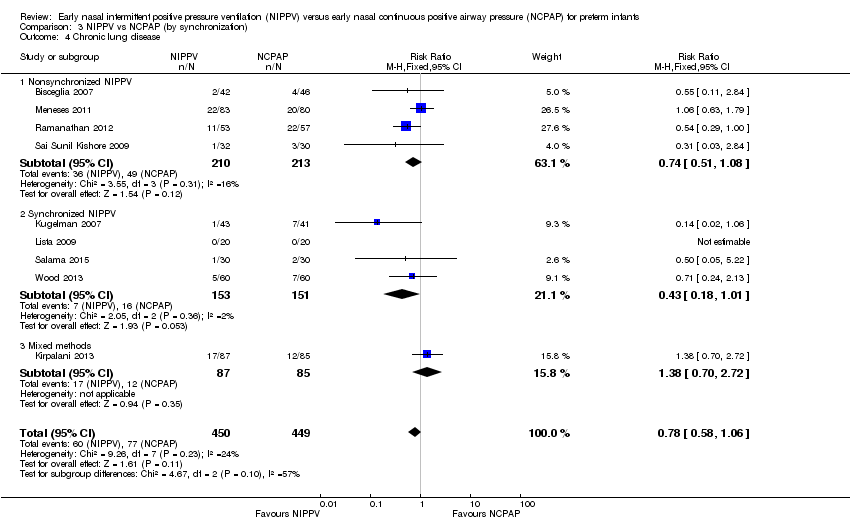
Comparison 3 NIPPV vs NCPAP (by synchronization), Outcome 4 Chronic lung disease.
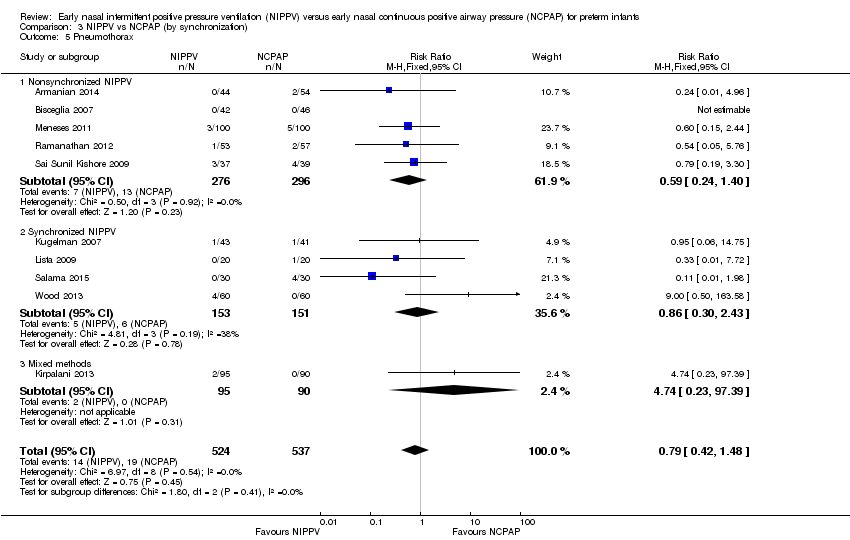
Comparison 3 NIPPV vs NCPAP (by synchronization), Outcome 5 Pneumothorax.

Comparison 3 NIPPV vs NCPAP (by synchronization), Outcome 6 Severe intraventricular hemorrhage (grade III/IV).

Comparison 4 NIPPV vs NCPAP high‐quality studies only (by device), Outcome 1 Respiratory failure (high‐quality studies).
| NIPPV versus NCPAP (by population) | ||||||
| Patient or population: preterm infants | ||||||
| Outcomes | Anticipated absolute effects* | Relative effect | Number of participants | Quality of the evidence | Comments | |
| Risk with NCPAP | Risk with NIPPV | |||||
| Respiratory failure | Study population | RR 0.62 | 876 | Moderatea | Risk of bias: unblinded intervention Meets optimal information size (OIS) (N = 377) | |
| 251 per 1000 | 155 per 1000 | |||||
| Moderate | ||||||
| 175 per 1000 | 109 per 1000 | |||||
| Need for intubation | Study population | RR 0.79 | 766 | Moderatea | Risk of bias: unblinded intervention Does not meet OIS (N = 838) | |
| 300 per 1000 | 237 per 1000 | |||||
| Moderate | ||||||
| 175 per 1000 | 138 per 1000 | |||||
| Pneumothorax | Study population | RR 0.69 | 876 | Lowa,b | Risk of bias: unblinded intervention | |
| 43 per 1000 | 29 per 1000 | |||||
| Moderate | ||||||
| 44 per 1000 | 30 per 1000 | |||||
| Severe intraventricular hemorrhage (grade III/IV) | Study population | RR 1.26 | 430 | Very lowa,b | Risk of bias: unblinded intervention | |
| 37 per 1000 | 46 per 1000 | |||||
| Moderate | ||||||
| 49 per 1000 | 61 per 1000 | |||||
| Chronic lung disease | Study population | RR 0.67 | 727 | Moderatea | Risk of bias: unblinded intervention Does not meet OIS (N = 1250) | |
| 179 per 1000 | 120 per 1000 | |||||
| Moderate | ||||||
| 170 per 1000 | 114 per 1000 | |||||
| Mortality during study period | Study population | RR 0.77 | 876 | Lowa,b | Risk of bias: unblinded intervention | |
| 89 per 1000 | 69 per 1000 | |||||
| Low | ||||||
| 0 per 1000 | 0 per 1000 | |||||
| Moderate | ||||||
| 26 per 1000 | 20 per 1000 | |||||
| *The risk in the intervention group (and its 95% confidence interval) is based on the assumed risk in the comparison group and the relative effect of the intervention (and its 95% CI). | ||||||
| GRADE Working Group grades of evidence | ||||||
| aUnblinded intervention. bImprecision: wide confidence intervals. | ||||||
| Outcome or subgroup title | No. of studies | No. of participants | Statistical method | Effect size |
| 1 Respiratory failure Show forest plot | 10 | 1060 | Risk Ratio (M‐H, Fixed, 95% CI) | 0.65 [0.51, 0.82] |
| 1.1 Surfactant (via INSURE) before enrollment | 2 | 150 | Risk Ratio (M‐H, Fixed, 95% CI) | 0.37 [0.15, 0.90] |
| 1.2 No surfactant treatment before enrollment | 6 | 774 | Risk Ratio (M‐H, Fixed, 95% CI) | 0.74 [0.56, 0.97] |
| 1.3 Mixed population (re: surfactant treatment) before enrollment | 2 | 136 | Risk Ratio (M‐H, Fixed, 95% CI) | 0.47 [0.24, 0.91] |
| 2 Need for intubation Show forest plot | 9 | 950 | Risk Ratio (M‐H, Fixed, 95% CI) | 0.78 [0.64, 0.94] |
| 2.1 Surfactant (via INSURE) before enrollment | 1 | 40 | Risk Ratio (M‐H, Fixed, 95% CI) | 0.67 [0.12, 3.57] |
| 2.2 No surfactant treatment before enrollment | 6 | 774 | Risk Ratio (M‐H, Fixed, 95% CI) | 0.84 [0.69, 1.02] |
| 2.3 Mixed population (re: surfactant treatment) before enrollment | 2 | 136 | Risk Ratio (M‐H, Fixed, 95% CI) | 0.47 [0.24, 0.91] |
| 3 Mortality during study period Show forest plot | 10 | 1061 | Risk Ratio (M‐H, Fixed, 95% CI) | 0.77 [0.51, 1.15] |
| 3.1 Surfactant (via INSURE) before enrollment | 2 | 150 | Risk Ratio (M‐H, Fixed, 95% CI) | 1.08 [0.07, 16.76] |
| 3.2 No surfactant treatment before enrollment | 6 | 775 | Risk Ratio (M‐H, Fixed, 95% CI) | 0.82 [0.52, 1.30] |
| 3.3 Mixed population (re: surfactant treatment) before enrollment | 2 | 136 | Risk Ratio (M‐H, Fixed, 95% CI) | 0.55 [0.21, 1.42] |
| 4 Chronic lung disease Show forest plot | 9 | 899 | Risk Ratio (M‐H, Fixed, 95% CI) | 0.78 [0.58, 1.06] |
| 4.1 Surfactant (via INSURE) before enrollment | 2 | 150 | Risk Ratio (M‐H, Fixed, 95% CI) | 0.54 [0.29, 1.00] |
| 4.2 No surfactant treatment before enrollment | 5 | 627 | Risk Ratio (M‐H, Fixed, 95% CI) | 0.92 [0.64, 1.32] |
| 4.3 Mixed population (re: surfactant treatment) before enrollment | 2 | 122 | Risk Ratio (M‐H, Fixed, 95% CI) | 0.39 [0.08, 1.91] |
| 5 Pneumothorax Show forest plot | 10 | 1061 | Risk Ratio (M‐H, Fixed, 95% CI) | 0.79 [0.42, 1.48] |
| 5.1 Surfactant (via INSURE) before enrollment | 2 | 150 | Risk Ratio (M‐H, Fixed, 95% CI) | 0.45 [0.07, 2.94] |
| 5.2 No surfactant treatment before enrollment | 6 | 775 | Risk Ratio (M‐H, Fixed, 95% CI) | 1.23 [0.52, 2.91] |
| 5.3 Mixed population (re: surfactant treatment) before enrollment | 2 | 136 | Risk Ratio (M‐H, Fixed, 95% CI) | 0.43 [0.13, 1.41] |
| 6 Intraventricular hemorrhage (all grades) Show forest plot | 5 | 370 | Risk Ratio (M‐H, Fixed, 95% CI) | 0.79 [0.54, 1.16] |
| 6.1 Surfactant (via INSURE) before enrollment | 1 | 40 | Risk Ratio (M‐H, Fixed, 95% CI) | 0.2 [0.01, 3.92] |
| 6.2 No surfactant treatment before enrollment | 3 | 270 | Risk Ratio (M‐H, Fixed, 95% CI) | 0.82 [0.56, 1.22] |
| 6.3 Mixed population (re: surfactant treatment) before enrollment | 1 | 60 | Risk Ratio (M‐H, Fixed, 95% CI) | 0.0 [0.0, 0.0] |
| 7 Severe intraventricular hemorrhage (grade III/IV) Show forest plot | 4 | 430 | Risk Ratio (M‐H, Fixed, 95% CI) | 1.26 [0.53, 3.01] |
| 7.1 Surfactant (via INSURE) before enrollment | 1 | 110 | Risk Ratio (M‐H, Fixed, 95% CI) | 5.37 [0.26, 109.35] |
| 7.2 No surfactant treatment before enrollment | 3 | 320 | Risk Ratio (M‐H, Fixed, 95% CI) | 1.01 [0.39, 2.59] |
| 7.3 Mixed population (re: surfactant treatment) before enrollment | 0 | 0 | Risk Ratio (M‐H, Fixed, 95% CI) | 0.0 [0.0, 0.0] |
| 8 Necrotizing enterocolitis (≥ Bell's stage 2) Show forest plot | 7 | 718 | Risk Ratio (M‐H, Fixed, 95% CI) | 0.67 [0.34, 1.31] |
| 8.1 Surfactant (via INSURE) before enrollment | 2 | 150 | Risk Ratio (M‐H, Fixed, 95% CI) | 0.54 [0.10, 2.82] |
| 8.2 No surfactant treatment before enrollment | 4 | 492 | Risk Ratio (M‐H, Fixed, 95% CI) | 0.58 [0.25, 1.33] |
| 8.3 Mixed population (re: surfactant treatment) before enrollment | 1 | 76 | Risk Ratio (M‐H, Fixed, 95% CI) | 1.58 [0.28, 8.93] |
| 9 Sepsis Show forest plot | 2 | 136 | Risk Ratio (M‐H, Fixed, 95% CI) | 0.78 [0.36, 1.70] |
| 9.1 Surfactant (via INSURE) before enrollment | 0 | 0 | Risk Ratio (M‐H, Fixed, 95% CI) | 0.0 [0.0, 0.0] |
| 9.2 No surfactant treatment before enrollment | 0 | 0 | Risk Ratio (M‐H, Fixed, 95% CI) | 0.0 [0.0, 0.0] |
| 9.3 Mixed population (re: surfactant treatment) before enrollment | 2 | 136 | Risk Ratio (M‐H, Fixed, 95% CI) | 0.78 [0.36, 1.70] |
| 10 Retinopathy of prematurity (≥ stage 3) Show forest plot | 2 | 245 | Risk Ratio (M‐H, Fixed, 95% CI) | 1.50 [0.65, 3.44] |
| 10.1 Surfactant (via INSURE) before enrollment | 1 | 110 | Risk Ratio (M‐H, Fixed, 95% CI) | 3.22 [0.13, 77.41] |
| 10.2 No surfactant treatment before enrollment | 1 | 135 | Risk Ratio (M‐H, Fixed, 95% CI) | 1.39 [0.58, 3.30] |
| 10.3 Mixed population (re: surfactant treatment) before enrollment | 0 | 0 | Risk Ratio (M‐H, Fixed, 95% CI) | 0.0 [0.0, 0.0] |
| 11 Local upper airway injury Show forest plot | 2 | 136 | Risk Ratio (M‐H, Fixed, 95% CI) | 0.11 [0.03, 0.41] |
| 11.1 Surfactant (via INSURE) before enrollment | 0 | 0 | Risk Ratio (M‐H, Fixed, 95% CI) | 0.0 [0.0, 0.0] |
| 11.2 No surfactant treatment before enrollment | 0 | 0 | Risk Ratio (M‐H, Fixed, 95% CI) | 0.0 [0.0, 0.0] |
| 11.3 Mixed population (re: surfactant treatment) before enrollment | 2 | 136 | Risk Ratio (M‐H, Fixed, 95% CI) | 0.11 [0.03, 0.41] |
| Outcome or subgroup title | No. of studies | No. of participants | Statistical method | Effect size |
| 1 Respiratory failure Show forest plot | 10 | Risk Ratio (M‐H, Fixed, 95% CI) | Subtotals only | |
| 1.1 Ventilator‐generated NIPPV | 6 | 606 | Risk Ratio (M‐H, Fixed, 95% CI) | 0.63 [0.47, 0.86] |
| 1.2 Bilevel NIPPV | 2 | 160 | Risk Ratio (M‐H, Fixed, 95% CI) | 1.0 [0.44, 2.27] |
| 1.3 Mixed devices | 2 | 294 | Risk Ratio (M‐H, Fixed, 95% CI) | 0.59 [0.38, 0.93] |
| 2 Need for intubation Show forest plot | 10 | Risk Difference (M‐H, Fixed, 95% CI) | Subtotals only | |
| 2.1 Ventilator‐generated NIPPV | 6 | 606 | Risk Difference (M‐H, Fixed, 95% CI) | ‐0.08 [‐0.14, ‐0.02] |
| 2.2 Bilevel NIPPV | 2 | 160 | Risk Difference (M‐H, Fixed, 95% CI) | 0.0 [‐0.10, 0.10] |
| 2.3 Mixed devices | 2 | 294 | Risk Difference (M‐H, Fixed, 95% CI) | ‐0.11 [‐0.20, ‐0.02] |
| 3 Mortality Show forest plot | 9 | 977 | Risk Ratio (M‐H, Fixed, 95% CI) | 0.77 [0.51, 1.15] |
| 3.1 Ventilator‐generated NIPPV | 5 | 522 | Risk Ratio (M‐H, Fixed, 95% CI) | 0.80 [0.52, 1.23] |
| 3.2 Bilevel NIPPV | 2 | 160 | Risk Ratio (M‐H, Fixed, 95% CI) | 0.2 [0.01, 4.08] |
| 3.3 Mixed devices | 2 | 295 | Risk Ratio (M‐H, Fixed, 95% CI) | 0.78 [0.21, 2.83] |
| 4 Chronic lung disease Show forest plot | 9 | Risk Ratio (M‐H, Fixed, 95% CI) | Subtotals only | |
| 4.1 Ventilator‐generated NIPPV | 5 | 457 | Risk Ratio (M‐H, Fixed, 95% CI) | 0.73 [0.47, 1.15] |
| 4.2 Bilevel NIPPV | 2 | 160 | Risk Ratio (M‐H, Fixed, 95% CI) | 0.71 [0.24, 2.13] |
| 4.3 Mixed devices | 2 | 282 | Risk Ratio (M‐H, Fixed, 95% CI) | 0.85 [0.54, 1.32] |
| 5 Pneumothorax Show forest plot | 10 | Risk Ratio (M‐H, Fixed, 95% CI) | Subtotals only | |
| 5.1 Ventilator‐generated NIPPV | 6 | 606 | Risk Ratio (M‐H, Fixed, 95% CI) | 0.49 [0.21, 1.11] |
| 5.2 Bilevel NIPPV | 2 | 160 | Risk Ratio (M‐H, Fixed, 95% CI) | 2.5 [0.49, 12.67] |
| 5.3 Mixed devices | 2 | 295 | Risk Ratio (M‐H, Fixed, 95% CI) | 1.42 [0.28, 7.29] |
| 6 Severe intraventricular hemorrhage (grade III/IV) Show forest plot | 3 | 346 | Risk Ratio (M‐H, Fixed, 95% CI) | 1.35 [0.51, 3.62] |
| 6.1 Ventilator‐generated NIPPV | 2 | 236 | Risk Ratio (M‐H, Fixed, 95% CI) | 1.03 [0.35, 3.04] |
| 6.2 Mixed devices | 1 | 110 | Risk Ratio (M‐H, Fixed, 95% CI) | 5.37 [0.26, 109.35] |
| Outcome or subgroup title | No. of studies | No. of participants | Statistical method | Effect size |
| 1 Respiratory failure Show forest plot | 10 | 1060 | Risk Ratio (M‐H, Fixed, 95% CI) | 0.64 [0.51, 0.81] |
| 1.1 Nonsynchronized NIPPV | 5 | 572 | Risk Ratio (M‐H, Fixed, 95% CI) | 0.60 [0.44, 0.83] |
| 1.2 Synchronized NIPPV | 4 | 304 | Risk Ratio (M‐H, Fixed, 95% CI) | 0.65 [0.41, 1.02] |
| 1.3 Mixed methods | 1 | 184 | Risk Ratio (M‐H, Fixed, 95% CI) | 0.74 [0.44, 1.22] |
| 2 Need for intubation Show forest plot | 10 | 1060 | Risk Ratio (M‐H, Fixed, 95% CI) | 0.73 [0.61, 0.87] |
| 2.1 Nonsynchronized NIPPV | 5 | 572 | Risk Ratio (M‐H, Fixed, 95% CI) | 0.74 [0.60, 0.92] |
| 2.2 Synchronized NIPPV | 4 | 304 | Risk Ratio (M‐H, Fixed, 95% CI) | 0.67 [0.42, 1.06] |
| 2.3 Mixed methods | 1 | 184 | Risk Ratio (M‐H, Fixed, 95% CI) | 0.74 [0.44, 1.22] |
| 3 Mortality Show forest plot | 9 | 977 | Risk Ratio (M‐H, Fixed, 95% CI) | 0.77 [0.51, 1.15] |
| 3.1 Synchronized NIPPV | 3 | 220 | Risk Ratio (M‐H, Fixed, 95% CI) | 0.25 [0.03, 2.19] |
| 3.2 Nonsynchronized NIPPV | 5 | 572 | Risk Ratio (M‐H, Fixed, 95% CI) | 0.83 [0.54, 1.27] |
| 3.3 Mixed methods | 1 | 185 | Risk Ratio (M‐H, Fixed, 95% CI) | 0.71 [0.16, 3.09] |
| 4 Chronic lung disease Show forest plot | 9 | 899 | Risk Ratio (M‐H, Fixed, 95% CI) | 0.78 [0.58, 1.06] |
| 4.1 Nonsynchronized NIPPV | 4 | 423 | Risk Ratio (M‐H, Fixed, 95% CI) | 0.74 [0.51, 1.08] |
| 4.2 Synchronized NIPPV | 4 | 304 | Risk Ratio (M‐H, Fixed, 95% CI) | 0.43 [0.18, 1.01] |
| 4.3 Mixed methods | 1 | 172 | Risk Ratio (M‐H, Fixed, 95% CI) | 1.38 [0.70, 2.72] |
| 5 Pneumothorax Show forest plot | 10 | 1061 | Risk Ratio (M‐H, Fixed, 95% CI) | 0.79 [0.42, 1.48] |
| 5.1 Nonsynchronized NIPPV | 5 | 572 | Risk Ratio (M‐H, Fixed, 95% CI) | 0.59 [0.24, 1.40] |
| 5.2 Synchronized NIPPV | 4 | 304 | Risk Ratio (M‐H, Fixed, 95% CI) | 0.86 [0.30, 2.43] |
| 5.3 Mixed methods | 1 | 185 | Risk Ratio (M‐H, Fixed, 95% CI) | 4.74 [0.23, 97.39] |
| 6 Severe intraventricular hemorrhage (grade III/IV) Show forest plot | 3 | 346 | Risk Ratio (M‐H, Fixed, 95% CI) | 1.35 [0.51, 3.62] |
| 6.1 Synchronized NIPPV | 0 | 0 | Risk Ratio (M‐H, Fixed, 95% CI) | 0.0 [0.0, 0.0] |
| 6.2 Nonsynchronized NIPPV | 3 | 346 | Risk Ratio (M‐H, Fixed, 95% CI) | 1.35 [0.51, 3.62] |
| Outcome or subgroup title | No. of studies | No. of participants | Statistical method | Effect size |
| 1 Respiratory failure (high‐quality studies) Show forest plot | 8 | 902 | Risk Ratio (M‐H, Fixed, 95% CI) | 0.64 [0.50, 0.82] |
| 1.1 Ventilator‐generated NIPPV | 4 | 448 | Risk Ratio (M‐H, Fixed, 95% CI) | 0.62 [0.45, 0.85] |
| 1.2 Bilevel NIPPV | 2 | 160 | Risk Ratio (M‐H, Fixed, 95% CI) | 1.0 [0.44, 2.27] |
| 1.3 Mixed devices | 2 | 294 | Risk Ratio (M‐H, Fixed, 95% CI) | 0.59 [0.38, 0.93] |