Insulina para el control de la glucemia en el accidente cerebrovascular isquémico agudo
Información
- DOI:
- https://doi.org/10.1002/14651858.CD005346.pub4Copiar DOI

- Base de datos:
-
- Cochrane Database of Systematic Reviews
- Versión publicada:
-
- 23 enero 2014see what's new
- Tipo:
-
- Intervention
- Etapa:
-
- Review
- Grupo Editorial Cochrane:
-
Grupo Cochrane de Accidentes cerebrovasculares
- Copyright:
-
- Copyright © 2014 The Cochrane Collaboration. Published by John Wiley & Sons, Ltd.
Cifras del artículo
Altmetric:
Citado por:
Autores
Contributions of authors
MF Bellolio wrote the background section, collected the data, did the analyses and wrote the results and conclusion of the full review and the updated review.
RM Gilmore wrote the background section, collected the data, wrote the results and conclusion of the full review, and abstracted data and quality measurements for the updated review.
LG Stead devised the initial review and wrote the original protocol.
MFB and RMG updated this version of the review.
The authors approve and take full responsibility for the contents of this systematic review.
Sources of support
Internal sources
-
Mayo Clinic, USA.
Protected time for research to the principal investigator
External sources
-
No sources of support supplied
Declarations of interest
None of the authors has any conflicts of interest to disclose.
Acknowledgements
To Hazel Fraser and the Cochrane Stroke Group for their continuous support, and to Daniel Cabrera for his support in selecting articles and preparing the manuscript.
Version history
| Published | Title | Stage | Authors | Version |
| 2014 Jan 23 | Insulin for glycaemic control in acute ischaemic stroke | Review | M Fernanda Bellolio, Rachel M Gilmore, Latha Ganti | |
| 2011 Sep 07 | Insulin for glycaemic control in acute ischaemic stroke | Review | M Fernanda Bellolio, Rachel M Gilmore, Latha G Stead | |
| 2008 Apr 23 | Insulin for glycaemic control in acute ischaemic stroke | Protocol | M Fernanda Bellolio, Rachel M Gilmore, Latha G Stead | |
| 2005 Jul 20 | Interventions for controlling hyperglycaemia in acute ischaemic stroke | Protocol | Latha Stead, Rachel M Gilmore, Nisant Anand, Amy L Weaver | |
Keywords
MeSH
Medical Subject Headings (MeSH) Keywords
- Blood Glucose [*metabolism];
- Diabetes Mellitus [mortality];
- Hyperglycemia [blood, complications, *drug therapy, mortality];
- Hypoglycemia [blood, complications, mortality];
- Hypoglycemic Agents [*administration & dosage];
- Insulin [*administration & dosage];
- Prognosis;
- Randomized Controlled Trials as Topic;
- Reference Values;
- Stroke [*blood, complications];
Medical Subject Headings Check Words
Aged; Female; Humans; Male;
PICO
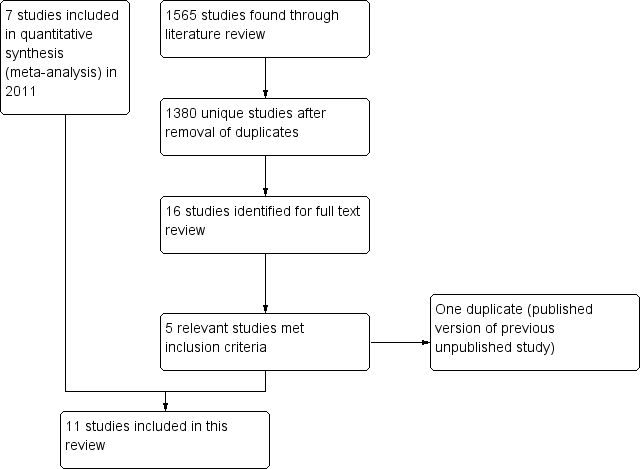
Study flow diagram.

Risk of bias summary: review authors' judgements about each risk of bias item for each included study.

Comparison 1 Dependency or death, Outcome 1 Dependency or death at the end of the follow‐up.

Comparison 1 Dependency or death, Outcome 2 Death.

Comparison 1 Dependency or death, Outcome 3 Diabetes mellitus versus no diabetes mellitus.
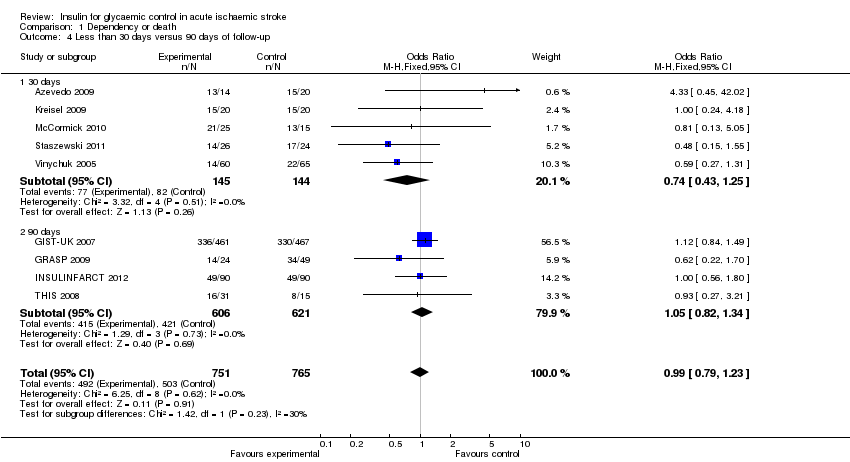
Comparison 1 Dependency or death, Outcome 4 Less than 30 days versus 90 days of follow‐up.

Comparison 2 Functional neurological outcome, Outcome 1 NIHSS or ESS at the end of the follow‐up.
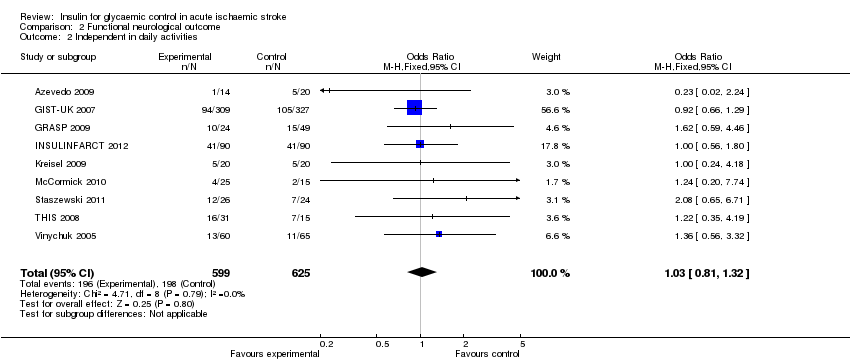
Comparison 2 Functional neurological outcome, Outcome 2 Independent in daily activities.
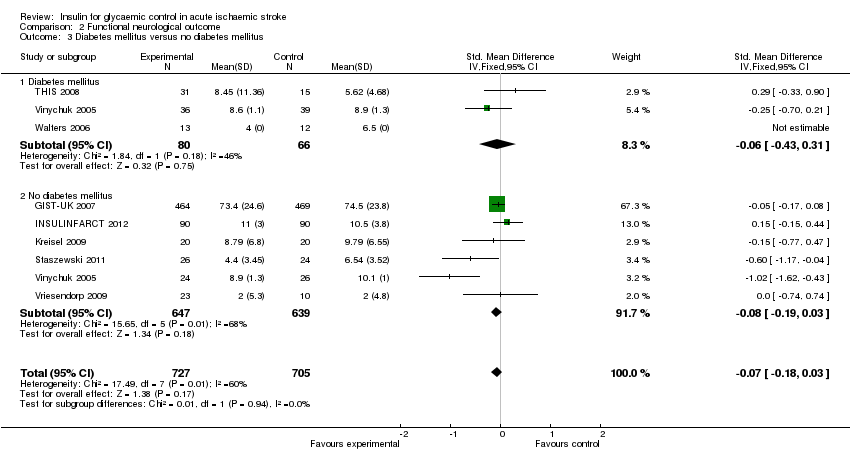
Comparison 2 Functional neurological outcome, Outcome 3 Diabetes mellitus versus no diabetes mellitus.

Comparison 2 Functional neurological outcome, Outcome 4 Less than 30 days versus 90 days of follow‐up.
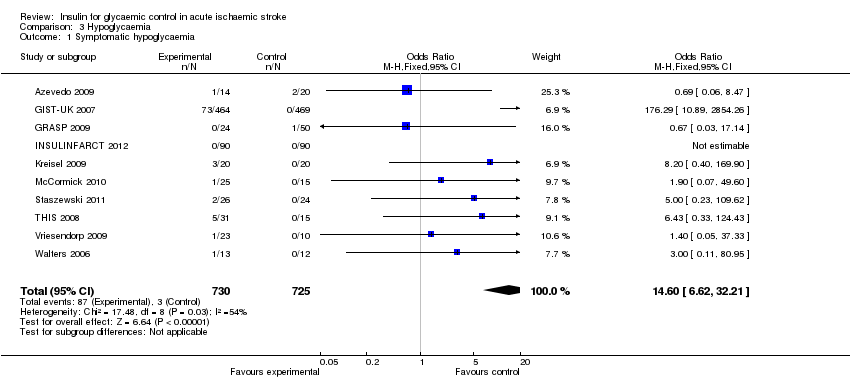
Comparison 3 Hypoglycaemia, Outcome 1 Symptomatic hypoglycaemia.
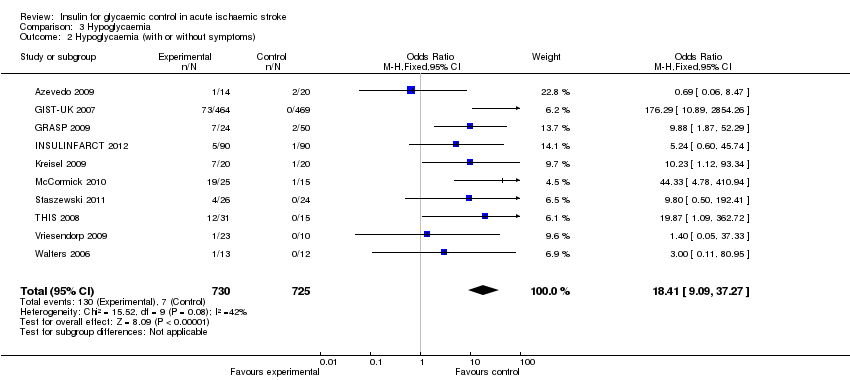
Comparison 3 Hypoglycaemia, Outcome 2 Hypoglycaemia (with or without symptoms).

Comparison 4 Mean glucose level, Outcome 1 Mean glucose level.
| Study | Generation of randomisation | Allocation concealment | Blinding: participants and physicians | Blinding: outcome to allocation group | Lost to follow‐up (%) |
| Low risk | Low risk | High risk | High risk | 0 | |
| Low risk | Low risk | High risk | Low risk | 7.4 | |
| Low risk | High risk | High risk | Low risk | 0 | |
| Low risk | Low risk | High risk | Low risk | 0 | |
| Low risk | Low risk | High risk | High risk | 0 | |
| Low risk | Low risk | High risk | Low risk | 1.4 | |
| Low risk | Unclear risk | High risk | High risk | 10 | |
| Low risk | Unclear risk | Unclear risk | High risk | Not reported | |
| Low risk | Low risk | High risk | High risk | 2.2 | |
| High risk | High risk | High risk | High risk | 15.2 | |
| Low risk | Unclear risk | High risk | High risk | Not reported |
| Outcome or subgroup title | No. of studies | No. of participants | Statistical method | Effect size |
| 1 Dependency or death at the end of the follow‐up Show forest plot | 9 | 1516 | Odds Ratio (M‐H, Fixed, 95% CI) | 0.99 [0.79, 1.23] |
| 2 Death Show forest plot | 9 | 1422 | Odds Ratio (M‐H, Fixed, 95% CI) | 1.09 [0.85, 1.41] |
| 3 Diabetes mellitus versus no diabetes mellitus Show forest plot | 8 | 1482 | Odds Ratio (M‐H, Fixed, 95% CI) | 0.97 [0.77, 1.21] |
| 3.1 Diabetes mellitus | 3 | 194 | Odds Ratio (M‐H, Fixed, 95% CI) | 0.66 [0.35, 1.24] |
| 3.2 No diabetes mellitus | 6 | 1288 | Odds Ratio (M‐H, Fixed, 95% CI) | 1.02 [0.81, 1.30] |
| 4 Less than 30 days versus 90 days of follow‐up Show forest plot | 9 | 1516 | Odds Ratio (M‐H, Fixed, 95% CI) | 0.99 [0.79, 1.23] |
| 4.1 30 days | 5 | 289 | Odds Ratio (M‐H, Fixed, 95% CI) | 0.74 [0.43, 1.25] |
| 4.2 90 days | 4 | 1227 | Odds Ratio (M‐H, Fixed, 95% CI) | 1.05 [0.82, 1.34] |
| Outcome or subgroup title | No. of studies | No. of participants | Statistical method | Effect size |
| 1 NIHSS or ESS at the end of the follow‐up Show forest plot | 8 | 1432 | Std. Mean Difference (IV, Fixed, 95% CI) | ‐0.09 [‐0.19, 0.01] |
| 2 Independent in daily activities Show forest plot | 9 | 1224 | Odds Ratio (M‐H, Fixed, 95% CI) | 1.03 [0.81, 1.32] |
| 3 Diabetes mellitus versus no diabetes mellitus Show forest plot | 8 | 1432 | Std. Mean Difference (IV, Fixed, 95% CI) | ‐0.07 [‐0.18, 0.03] |
| 3.1 Diabetes mellitus | 3 | 146 | Std. Mean Difference (IV, Fixed, 95% CI) | ‐0.06 [‐0.43, 0.31] |
| 3.2 No diabetes mellitus | 6 | 1286 | Std. Mean Difference (IV, Fixed, 95% CI) | ‐0.08 [‐0.19, 0.03] |
| 4 Less than 30 days versus 90 days of follow‐up Show forest plot | 8 | 1432 | Std. Mean Difference (IV, Fixed, 95% CI) | ‐0.09 [‐0.19, 0.01] |
| 4.1 30 days | 5 | 273 | Std. Mean Difference (IV, Fixed, 95% CI) | ‐0.47 [‐0.72, ‐0.23] |
| 4.2 90 days | 3 | 1159 | Std. Mean Difference (IV, Fixed, 95% CI) | ‐0.00 [‐0.12, 0.11] |
| Outcome or subgroup title | No. of studies | No. of participants | Statistical method | Effect size |
| 1 Symptomatic hypoglycaemia Show forest plot | 10 | 1455 | Odds Ratio (M‐H, Fixed, 95% CI) | 14.60 [6.62, 32.21] |
| 2 Hypoglycaemia (with or without symptoms) Show forest plot | 10 | 1455 | Odds Ratio (M‐H, Fixed, 95% CI) | 18.41 [9.09, 37.27] |
| Outcome or subgroup title | No. of studies | No. of participants | Statistical method | Effect size |
| 1 Mean glucose level Show forest plot | 8 | 1398 | Mean Difference (IV, Fixed, 95% CI) | ‐0.63 [‐0.80, ‐0.46] |