Insulina para el control de la glucemia en el accidente cerebrovascular isquémico agudo
Resumen
Antecedentes
Los pacientes con hiperglucemia y accidente cerebrovascular agudo tienen mayor mortalidad, el accidente cerebrovascular es más grave y el deterioro funcional es mayor en comparación con los pacientes con niveles normales de glucemia que presentan accidente cerebrovascular. Ésta es una actualización de una revisión Cochrane publicada por primera vez en 2011.
Objetivos
Determinar si el control intensivo del tratamiento con insulina dirigido a mantener la glucosa sérica dentro de un rango normal específico (4 a 7,5 mmol/l) en las primeras 24 horas del accidente cerebrovascular isquémico agudo influye en el resultado.
Métodos de búsqueda
Se hicieron búsquedas en el registro de ensayos del Grupo Cochrane de Accidentes Cerebrales Vasculares (Cochrane Stroke Group) (septiembre de 2013), CENTRAL (The Cochrane Library 2013, número 8), MEDLINE (1950 hasta septiembre de 2013), EMBASE (1980 hasta septiembre de 2013), CINAHL (1982 hasta septiembre de 2013), Science Citation Index (1900 hasta septiembre de 2013), y en Web of Science (ISI Web of Knowledge) (1993 hasta septiembre de 2013). También se hicieron búsquedas en registros de ensayos en curso y en SCOPUS.
Criterios de selección
Ensayos controlados aleatorios (ECA) que compararan el control intensivo del tratamiento con insulina versus atención habitual en adultos con accidente cerebrovascular isquémico agudo.
Obtención y análisis de los datos
A través de la búsqueda bibliográfica se obtuvieron 1565 títulos. Dos revisores de forma independiente seleccionaron los artículos incluidos y extrajeron las características de los estudios, la calidad de los estudios y los datos para calcular el odds ratio (OR) y el intervalo de confianza (IC) del 95%, la diferencia de medias (DM) y la diferencia de medias estandarizada (DME) de las medidas de resultado. Los desacuerdos se resolvieron mediante discusión.
Resultados principales
Se incluyeron 11 ECA con 1583 participantes (791 participantes del grupo de intervención y 792 del grupo control). Se encontró que no hubo diferencias entre los grupos de tratamiento y control en el resultado de mortalidad o dependencia (OR 0,99; IC del 95%: 0,79 a 1,23) o el déficit neurológico final (DME ‐0,09; IC del 95%: ‐0,19 a 0,01). La tasa de hipoglucemia sintomática fue mayor en el grupo de intervención (OR 14,6; IC del 95%: 6,6 a 32,2). En los análisis de subgrupos de diabetes mellitus (DM) versus sin DM, no se encontraron diferencias para los resultados de mortalidad y discapacidad o déficit neurológico. El número necesario para tratar no fue significativo para los resultados de mortalidad ni déficit neurológico final. El número necesario para dañar fue nueve para la hipoglucemia sintomática.
Conclusiones de los autores
Después de actualizar los resultados de la revisión anterior se encontró que la administración de insulina intravenosa para mantener la glucosa sérica dentro de un rango específico en las primeras horas del accidente cerebrovascular isquémico agudo no tiene efectos beneficiosos sobre el resultado funcional, la mortalidad o la mejoría en el déficit neurológico final, y aumentó significativamente el número de episodios hipoglucémicos. Específicamente, los pacientes en los que los niveles de glucosa se mantuvieron dentro de un rango más ajustado con insulina intravenosa presentaron un riesgo mayor de hipoglucemia sintomática y asintomática que los pacientes del grupo control.
PICOs
Resumen en términos sencillos
Control de niveles altos de azúcar en sangre con insulina en pacientes que presentaron un accidente cerebrovascular isquémico agudo
Después de un accidente cerebrovascular, los pacientes con niveles altos de azúcar en sangre tienen un aumento en la mortalidad independientemente de la edad, de la gravedad del accidente cerebrovascular o del tipo de accidente cerebrovascular. La insulina puede reducir los niveles de azúcar en sangre. No se conoce cuál debe ser el nivel óptimo de azúcar en sangre después de un accidente cerebrovascular. Se realizaron búsquedas de ensayos que compararon la atención habitual con el tratamiento intensivo con insulina (para tratar de mantener los niveles de azúcar en sangre dentro del rango normal de 4 a 7,5 mmol/l) después del accidente cerebrovascular. Se encontraron 11 ensayos con 1583 participantes. Tratar de mantener la glucemia dentro de un rango ajustado inmediatamente después de un accidente cerebrovascular no mejoró los resultados del déficit neurológico y la dependencia. Sin embargo, aumentó significativamente las probabilidades de presentar niveles muy bajos de glucemia (hipoglucemia), que pueden ser perjudiciales y pueden causar daño cerebral y muerte. En conjunto, los ensayos no mostraron efectos beneficiosos del control intensivo de los niveles de azúcar en sangre después del accidente cerebrovascular.
Authors' conclusions
Background
Description of the condition
Hyperglycaemia (where the blood glucose concentration is greater than 6.1 mmol/L) on admission to hospital is common after acute ischaemic stroke and occurs in up to two‐thirds of all patients (Scott 1999). There has been much debate over the years as to whether hyperglycaemia in people with acute stroke is the result of a stress response (Candelise 1985; Jorgensen 1994), poor glycaemic control in people with diabetes, or unrecognised diabetes. Regardless, the majority of clinical trials have concluded that hyperglycaemia predicts increased stroke mortality independently of age, stroke severity, or stroke type (Capes 2001; Gray 1987; Melamed 1976; Weir 1997). However, the uncertainty over whether hyperglycaemia worsens prognosis through the augmentation of acute brain injury (Jorgensen 1994; Kiers 1992; Van Kooten 1993; Weir 1997) or is merely a physiological response to acute stroke (Murros 1992; Murros 1993; O'Neill 1991; Woo 1988) still remains.
Hyperglycaemia has been shown to have a deleterious effect on ischaemic brain tissue in numerous animal studies, and many mechanisms have been proposed to explain this phenomenon (de Courten‐Myers 1989; Gisselsson 1999; Lin 1998; Myers 1977; Pulsinelli 1982). One of the most consistent findings is the association between hyperglycaemia and cerebral acidosis (Pulsinelli 1982; Rehncrona 1981). Enhanced acidosis may exaggerate ischaemic neuronal injury by facilitating free radical formation, activating pH‐dependent endonucleases, or altering intracellular calcium regulation (Barber 1967; Barry 1993; Combs 1992; Regli 1996; Rehncrona 1981; Siesjo 1985; Siesjo 1996). Moderately and severely elevated blood glucose levels have been shown to enhance cortical intracellular acidosis and significantly worsen mitochondrial function (Anderson 1999; Hoxworth 1999).
It has also been postulated that intracellular acidosis enhances glutamate release. Glutamate plays a central role in neuronal death because it activates post‐synaptic glutamate receptors and leads to an excessive influx of calcium, subsequent mitochondrial injury, and cell death (Li 2000; Nedergaard 1996). In addition, the pre‐synaptic release of glutamate mediates repeated waves of spreading depression (a decrease of activity in the cortex), which is another mechanism believed to propagate the necrosis of penumbral tissue (Koistinaho 1999; Lo 2003).
Previous studies in humans showed that people with acute ischaemic stroke and hyperglycaemia had worse outcomes when compared with those with normal glycaemic levels. Multiple observational studies have showed that people with hyperglycaemia exhibited greater stroke severity and greater functional impairment than those with normoglycaemia; people with hyperglycaemia were 2.3 times more likely to be dead at 90 days compared with those with normal glucose levels in one study (Stead 2009). To date, most of the work done in humans in the field of hyperglycaemia and stroke has been limited to correlating the presence of hyperglycaemia to ischaemic stroke outcome. The next logical step in this debate is to ascertain whether treating hyperglycaemia following stroke does, in fact, reduce mortality and improve functional outcome.
Description of the intervention
Insulin has a number of effects on glucose metabolism including inhibition of glycogenolysis and gluconeogenesis, increased glucose transport into fat and muscle, increased glycolysis, and stimulation of glycogen synthesis (Ramnanan 2010). All these mechanisms decrease the levels of circulating glucose. Insulin serves to co‐ordinate the use of alternative fuels (glucose and free fatty acids) to meet the energy demands of the organism during fasting, exercise, and stress (Farese 1991; Fielding 1998).
How the intervention might work
In acute stroke the initial ischaemia is rarely complete due to collateral blood supply. The ischaemic penumbra is the area of hypoperfused, but still viable, tissue that surrounds a densely ischaemic, hypoxic core. This is the area that is vulnerable to the metabolic imbalances mentioned above. With hyperglycaemia, there is a reduction in penumbral salvage and an increase in brain lactate levels (Parsons 2002). Therefore, it is believed that if the detrimental effects associated with hyperglycaemia are mediated primarily through metabolic mechanisms, tight glycaemic control during acute stroke may reduce the extent of ultimate brain injury (Bruno 2004). Acute hyperglycaemia is associated by neuroimaging with reduced salvage of penumbral tissue and greater final infarct size (Parsons 2002), and hyperglycaemia is associated with reduced benefit from recanalization with thrombolytic therapy (Bruno 2002). Also, experimental studies have showed that administration of insulin during focal and global ischaemia may reduce subsequent brain damage (Auer 1998; Hamilton 1995; Voll 1989; Voll 1991; Wass 1996; Zhu 1994).
Why it is important to do this review
Previous versions of our review (Bellolio 2008; Bellolio 2011) showed that the use of insulin to maintain glycaemia in a tight range had no improvement in functional outcome, death, or final neurological deficit and significantly increased the number of hypoglycaemic episodes.
The purpose of this review is to update the previous review with new information to ascertain whether the use of insulin to control hyperglycaemia within a tight range in the acute phase of ischaemic stroke influences outcome.
Objectives
To determine whether intensively monitoring insulin therapy aimed at maintaining serum glucose within a specific normal range (4 to 7.5 mmol/L) in the first 24 hours of acute ischaemic stroke influences outcome.
Methods
Criteria for considering studies for this review
Types of studies
All randomised controlled trials (RCTs) comparing insulin with placebo, low dose insulin versus high dose insulin, or close monitoring of glucose versus loose monitoring in people with acute ischaemic stroke with blood glucose levels greater than 6.1 mmol/L were eligible for inclusion.
Types of participants
Trials that included adults, older than 18 years of age, presenting within 24 hours of acute ischaemic stroke with serum glucose levels greater than 6.1 mmol/L were eligible for inclusion. We included people of either gender both with and without diabetes.
Definite ischaemic stroke implies people in whom computed tomography (CT) or magnetic resonance imaging (MRI) was performed before randomisation. Presumed ischaemic stroke refers to people who did not have a CT or MRI so haemorrhage could not be excluded.
Types of interventions
We included trials that evaluated intervention with insulin, or tight glycaemic control, to maintain a glycaemic level between 4 and 7.5 mmol/L (72 to 135 mg/dL). The intervention had to start within 24 hours of symptom onset. The control interventions were placebo, no treatment, or loose control with insulin.
Types of outcome measures
Primary outcomes
Death or dependency at the end of the scheduled follow‐up. Dependency is defined as being severely dependent on others in activities of daily living, or being significantly disabled; this corresponds to a Barthel Index score 60 or less, or a modified Rankin Scale grade 3 to 6 (Uyttenboogaart 2007).
Secondary outcomes
-
Measures of neurological deficit after intervention for hyperglycaemia, including the National Institutes of Health Stroke Scale (NIHSS) and the European Stroke Scale (ESS).
-
Number of deaths in each group at the end of the scheduled follow‐up.
-
Hypoglycaemia, defined as glucose concentration less than 3 mmol/L. Symptomatic hypoglycaemia was defined as confusion, visual disturbances, seizures, sweating, or hunger in a person with a glucose level lower than 3 mmol/L. The numbers of hypoglycaemic events (symptomatic and asymptomatic) in each group were compared.
Search methods for identification of studies
See the 'Specialized register' section in the Cochrane Stroke Group module. We did not apply any language restrictions and arranged translation of relevant articles published in languages other than English.
Electronic searches
We searched the Cochrane Stroke Group Trials Register (last searched September 2013). We also searched MEDLINE (1950 to September 2013) (Appendix 1), the Cochrane Central Register of Controlled Trials (CENTRAL) (The Cochrane Library 2013, Issue 8) (Appendix 2), EMBASE (1980 to September 2013) (Appendix 3), Science Citation Index (1900 to September 2013) (Appendix 4), Web of Science (1993 to September 2013) (Appendix 5), and CINAHL (1982 to September 2013) (Appendix 6). The Cochrane Stroke Group Trials Search Co‐ordinator developed the MEDLINE search strategy, which was adapted for the other databases by a reference librarian who also ran the searches.
In an effort to identify further published, unpublished, and ongoing trials we searched:
-
Stroke Trials Directory (www.strokecenter.org/trials/),
-
ClinicalTrials.gov (http://clinicaltrials.gov/),
-
Current Controlled Trials (www.controlled‐trials.com/),
-
SCOPUS (www.scopus.com/).
Searching other resources
We checked the reference lists of the selected articles to identify additional trials.
Data collection and analysis
Selection of studies
Two review authors (MFB and RMG) independently screened the titles and abstracts of the records identified from the electronic searches and excluded obviously irrelevant studies. We obtained the full texts of the remaining papers and the same review authors selected studies for inclusion based on the predefined criteria. The review authors were not blinded to the journal, institution, or study authors.
Data extraction and management
Using a standardised data extraction form and working in duplicate, two review authors (MFB and RMG) abstracted the following descriptive data from every study: description of randomisation, concealment of participants, blinding, intention to treat and lost to follow‐up as part of the quality assessment. The same two review authors also collected information on: definitive or presumed acute ischaemic stroke (based on the use of CT or MRI before or after randomisation), number of participants, gender, age, proportion of people with diabetes, setting (stroke unit, critical care unit, or non‐critical care unit), characteristics of treatment and control interventions (insulin dose, frequency, route, and duration), co‐interventions, and frequency of the glucose level checks.
We abstracted the specific stroke outcomes from every study. We collected end‐of‐study deaths, Barthel score, Rankin Scale, National Institutes of Health Stroke Scale (NIHSS), European Stroke Scale (ESS), and the number of hypoglycaemic events (symptomatic and asymptomatic). Outcomes were collected at the end of follow‐up. Follow‐up was defined for each study as ≤ 30 or ≤ 90 days. We contacted all the authors of the included studies, if data were missing or unclear, to obtain full details.
The same two review authors resolved any discrepancies between the two sets of data through discussion. One author (MFB) entered the data into the Review Manager software, RevMan 5.2 (RevMan 2012) and performed the analyses.
Assessment of risk of bias in included studies
Two review authors (MFB and RMG) independently assessed risk of bias for each study using the criteria outlined in the Cochrane Handbook for Systematic Reviews of Interventions (Higgins 2011). We resolved any disagreements by discussion. We assessed the risk of bias according to the following domains.
-
Random sequence generation.
-
Allocation concealment.
-
Blinding of participants and personnel.
-
Blinding of outcome assessment.
-
Incomplete outcome data.
We graded the risk of bias for each domain as high, low, or unclear and provided information from the study report together with a justification for our judgment in the 'Risk of bias' tables.
Measures of treatment effect
The treatment was insulin and the measurements of treatment effect were glucose levels and functional scales including death, Barthel score, Rankin Scale, NIHSS, ESS, and the number of hypoglycaemic events (symptomatic and asymptomatic).
Unit of analysis issues
The glucose level is a continuous variable and was provided in mg/dL or mml/L; all the values were converted to the same unit (mml/L) prior to any analysis.
When the scales used different units of measure, that is Barthel and ESS to evaluate functional outcome, we used standardised mean differences (SMDs) as recommended by the Cochrane Handbook for Systematic Reviews of Interventions (Higgins 2011).
Dealing with missing data
We contacted all the authors of the included studies, if data were missing or unclear, to obtain full details regarding study design, outcomes, and attrition rates. When the data were not available, we included the study in the qualitative analysis. For missing measures of precision, that is missing standard deviations, we estimated these with the available information, like interquartile range or standard error, according to the Cochrane Handbook for Systematic Reviews of Interventions (Higgins 2011).
Assessment of heterogeneity
We assessed clinical heterogeneity by determining whether the characteristics of the participants, interventions, outcome measures, and timing of outcome measurement were similar across studies. We assessed statistical heterogeneity using the I2 statistic.
Assessment of reporting biases
When the data were not available we contacted the study authors for more information. If data were still missing we classified the study as unclear. For the assessment of publication bias, we evaluated funnel plots if at least 10 studies examined the same outcome.
Data synthesis
We used RevMan 5.2 (RevMan 2012) for all the meta‐analyses.
We analysed the primary outcome of death or dependency at the end of the scheduled follow‐up as a binary outcome.
For the secondary outcome of neurological deficit after intervention, the NIHSS and the ESS are ordinal scales with a minimum increment of one point and we used these as continuous variables for the purposes of the analyses. The NIHSS ranges from 0 to 42 points, with 0 points being no measurable neurological deficit. The ESS ranges from 0 to 100 points, with 0 points being bedridden. We analysed hypoglycaemia as a binary outcome with a cut‐off value of less than 3 mmol/L and defined symptomatic hypoglycaemia as confusion, visual disturbances, seizures, sweating, or hunger in a person with a glucose level lower than 3 mmol/L.
For continuous outcomes we determined the pooled mean difference (MD) between the treatment and control interventions and the associated 95% confidence interval (CI) using a fixed‐effect model. For continuous outcomes using different scales (for example for assessment of the final deficit with the NIHSS and ESS) we determined the pooled SMD between the treatment and control interventions and the associated 95% CI using a fixed‐effect model. For binary outcomes we determined the odds ratio (OR) between the treatment and control interventions and the associated 95% CI using a fixed‐effect model.
When any of the values in the outcome was zero, a 0.5 continuity correction factor was applied automatically by the RevMan software (0.5 added to all cells).
Subgroup analysis and investigation of heterogeneity
We determined subgroup analyses a priori. We compared:
-
diabetic versus non‐diabetic cohorts for the outcomes of death and dependency, and final neurological deficit. Most of the studies did not report results separated by diabetic status so we did the analysis comparing the cohorts with more than 50% diabetic versus less than 50% diabetic;
-
outcomes measured at less than 30 days versus 90 days.
To explore these hypotheses, we estimated the difference in treatment effects between subgroups or treatment‐subgroup interactions (Altman 2003).
We quantified heterogeneity and inconsistency in the studies using the I2 statistic, which describes the proportion of variance across studies not due to chance.
Sensitivity analysis
We determined sensitivity analyses a priori. We excluded:
-
studies with presumed diagnosis of ischaemic stroke (studies that did not perform CT or MRI before the randomisation, therefore haemorrhagic strokes were not excluded);
-
studies where the controls received insulin (loose control studies);
-
studies with inadequate allocation concealment;
-
the largest study.
Results
Description of studies
Results of the search
We obtained a total of 1565 articles and, after removing duplicates, we manually screened 1380 records. We retrieved a total of 16 trials for more detailed evaluation. We included four new trials and one study was the published version of a previously included study (Staszewski 2011). See Figure 1 for details.

Study flow diagram.
Included studies
We included a total of 11 trials involving 1583 participants (791 participants in the intervention group and 792 in the control group). Three ongoing studies at the time of our previous review were completed and have been included in this review (Azevedo 2009; INSULINFARCT 2012; McCormick 2010).
Enrolled participants were typically older people (mean age 74 years) with equal gender distribution. Baseline characteristics were similar in the intervention and control groups, with higher baseline glycaemic levels measured at admission in the cohorts with a higher proportion of people with diabetes mellitus.
In GIST‐UK 2007,16% of the cohort had a disease different from ischaemic stroke but with a measurable neurological impairment (for example intracranial haemorrhage).
In nine studies participants had a definitive diagnosis of acute ischaemic stroke prior to randomisation. All 11 studies reported intervention with an intravenous insulin infusion. Vinychuk 2005 reported the results separately for participants with and without diabetes mellitus.
For the functional outcome, four studies used the Barthel score and six studies used the modified Rankin Scale. Walters 2006 did not report functional outcome scales.
One study in the previous version of this review (Staszewski 2007) is now included as a published study (Staszewski 2011).
For the neurological deficit assessment, six studies reported the NIHSS and one reported the ESS at the end of the follow‐up. The NIHSS is a 42‐point score; a higher score indicates a worse functional outcome and higher level of disability. The ESS score ranges from 0 to 100 points, 0 being bedridden and a higher score showing a better functional outcome. Ten studies reported hypoglycaemia and eight reported deaths; Vinychuk 2005 did not report these outcomes.
Azevedo 2009 was available in abstract format only and we contacted the author to obtain more information. We also contacted the author of an ongoing study (NCT00373269) and the study is currently inactive. We contacted other authors for the previous version of this review.
Excluded studies
Excluded studies were those that did not meet the inclusion criteria. Some studies were not included because: (1) they were not randomised trials, (2) they had a mixed critical care population with less than 5% of the participants having ischaemic stroke (Green 2010), or (3) stroke was an outcome of the study but the study was not done on stroke participants (CIMT Trial; Miyashita 2008; VADT).
Risk of bias in included studies
All studies were randomised with a parallel design. GRASP 2009 was stratified by glucose concentration, and Vriesendorp 2009 was stratified by dysphagia and diabetes mellitus (DM). All studies except Vriesendorp 2009 had adequate generation of randomisation. There was a high risk of bias in allocation concealment in five of the 11 studies, and most of the assessors of outcomes were not blinded.
Four studies had a high risk of bias secondary to inadequate allocation: in Staszewski 2011 the list was read by the investigator entering the participant into the trial; Vriesendorp 2009 used consecutive envelopes; and Azevedo 2009 and Kreisel 2009 did not report this information. In none of the studies were physicians blinded to the intervention. Participants were blinded to the intervention in Azevedo 2009 and THIS 2008, and in four studies the outcome assessment was blinded (GIST‐UK 2007; GRASP 2009; Staszewski 2011; THIS 2008).
GRASP 2009 and Walters 2006 were pilot studies, and GIST‐UK 2007 was stopped early due to the slow enrolment rate. See the summary risk of bias in Table 1 and Figure 2.
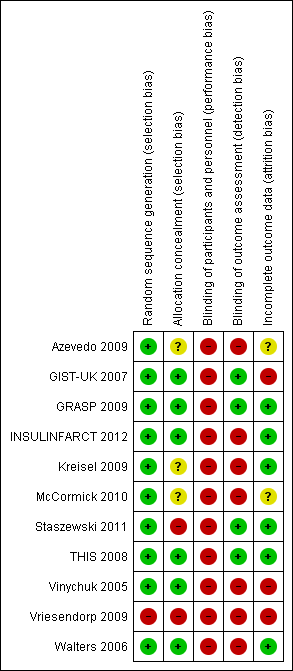
Risk of bias summary: review authors' judgements about each risk of bias item for each included study.
| Study | Generation of randomisation | Allocation concealment | Blinding: participants and physicians | Blinding: outcome to allocation group | Lost to follow‐up (%) |
| Low risk | Low risk | High risk | High risk | 0 | |
| Low risk | Low risk | High risk | Low risk | 7.4 | |
| Low risk | High risk | High risk | Low risk | 0 | |
| Low risk | Low risk | High risk | Low risk | 0 | |
| Low risk | Low risk | High risk | High risk | 0 | |
| Low risk | Low risk | High risk | Low risk | 1.4 | |
| Low risk | Unclear risk | High risk | High risk | 10 | |
| Low risk | Unclear risk | Unclear risk | High risk | Not reported | |
| Low risk | Low risk | High risk | High risk | 2.2 | |
| High risk | High risk | High risk | High risk | 15.2 | |
| Low risk | Unclear risk | High risk | High risk | Not reported |
Allocation
Six studies had adequate allocation, two studies had a high risk of bias because either the list was read by the investigator (Staszewski 2011) or consecutive envelopes were used (Vriesendorp 2009), and two studies did not provide this information (Kreisel 2009; McCormick 2010).
Blinding
All the studies had a high risk of bias with regard to blinding. Most of the studies were not blinded to the treatment arm and had different treatments and co‐interventions for the intervention and control groups. In no studies were the physicians blinded to the intervention. Two studies (Azevedo 2009; THIS 2008) had participants blinded to the intervention. Four studies had outcome assessors blinded to the allocation group (GIST‐UK 2007; GRASP 2009; Staszewski 2011; THIS 2008).
Incomplete outcome data
Most of the studies had an adequate attrition rate and the loss to follow‐up was between 0% (Staszewski 2011; THIS 2008; Vinychuk 2005; Walters 2006) to 15.2% (Vriesendorp 2009). The loss to follow‐up was 7.4% in GIST‐UK 2007, 7.5% in Kreisel 2009, 1.4% in GRASP 2009, unknown in Vinychuk 2005 but estimated to be 2.3%, estimated to be 15.2% in Vriesendorp 2009, and 2.2% in INSULINFARCT 2012. Loss to follow‐up was not reported in Azevedo 2009 or McCormick 2010. All the studies used intention‐to‐treat (ITT) analyses. One study reported results per protocol and used ITT (INSULINFARCT 2012). GIST‐UK 2007 was terminated early because of the low enrolment rate.
Selective reporting
It is possible that there was reporting bias. However, we did not detect significant selective reporting among the included studies. Most of the studies had a functional outcome reported as well as death and hypoglycaemia as outcomes.
Other potential sources of bias
Azevedo 2009 was available in abstract format only thereby increasing the risk of bias and risk to methodological quality. Full text articles were available for the other 10 studies.
Effects of interventions
The mean glycaemic level during treatment was significantly lower in the intervention group than in the control group, with an MD of ‐0.63 (95% CI ‐0.80 to ‐0.46, Analysis 4.1). The average glucose level in the intervention group was 6.7 mmol/L, and 7.3 mmol/L in the loose control group.
Dependency or death
Modified Rankin grades and Barthel scores were used. Meta‐analysis of the nine comparisons (1516 participants) found no significant difference between the treatment and control groups, with an OR of 0.99 (95% CI 0.79 to 1.23, Analysis 1.1).
Death
Meta‐analysis of the nine comparisons (1422 participants) found no significant difference between the treatment and control groups, with an OR of 1.09 (95% CI 0.85 to 1.41, Analysis 1.2).
Final neurological deficit
NIHSS and ESS were used. Meta‐analysis of the eight comparisons (1432 participants) found no significant difference between the treatment and control groups, with a pooled SMD of ‐0.09 (95% CI ‐0.19 to 0.01, Analysis 2.1).
When using the dichotomised outcome of dependency on others for functional activities, the comparison of the nine studies had an OR of 1.03 (95% CI 0.81 to 1.32, Analysis 2.2).
Hypoglycaemia
Meta‐analysis of the 10 comparisons (1455 participants) found a significant difference in the incidence of hypoglycaemia between the treatment and control groups, with an OR of 14.6 (95% CI 6.6 to 32.2) for symptomatic hypoglycaemia and an OR of 18.4 (95% CI 9.1 to 37.3) in participants with or without symptoms of hypoglycaemia (Analysis 3.1 and Analysis 3.2).
Subgroup analyses
Diabetes mellitus versus no diabetes mellitus (DM)
For the outcome of dependence or death we compared those studies with 50% or more of the cohort having DM versus the studies with less than 50% of the cohort with DM. Vinychuk 2005 reported these cohorts separately. The studies included in the DM group were THIS 2008 (100% DM in the intervention group and 73.3% in the control group), Walters 2006 (53.9% in the intervention and 50% in the control group), and GRASP 2009 (50% in the intervention and 64% in the control group). The studies included in the no DM cohort were GIST‐UK 2007 (17% in the intervention and 16% in the control), Staszewski 2011 (0% DM), Kreisel 2009 (30% DM in the intervention and 35% in the control group), McCormick 2010 (28% in the intervention and 40% in the control group), INSULINFARCT 2012 (8% in the intervention and 17% in the control group), and Vriesendorp 2009 (35% in the intervention and 40% in the control group).
The meta‐analysis found no significant difference between the treatment and control groups for the outcome of dependency or death when stratified by DM status, with an OR of 0.66 (95% CI 0.35 to 1.24) for DM and an OR of 1.02 (95% CI 0.81 to 1.30) for participants without DM (Analysis 1.3).
For the outcome of final neurological deficit, the SMD for participants with DM was ‐0.06 (95% CI ‐0.43 to 0.31) and for participants without DM it was ‐0.08 (95% CI ‐0.19 to 0.03, Analysis 2.3).
Follow‐up
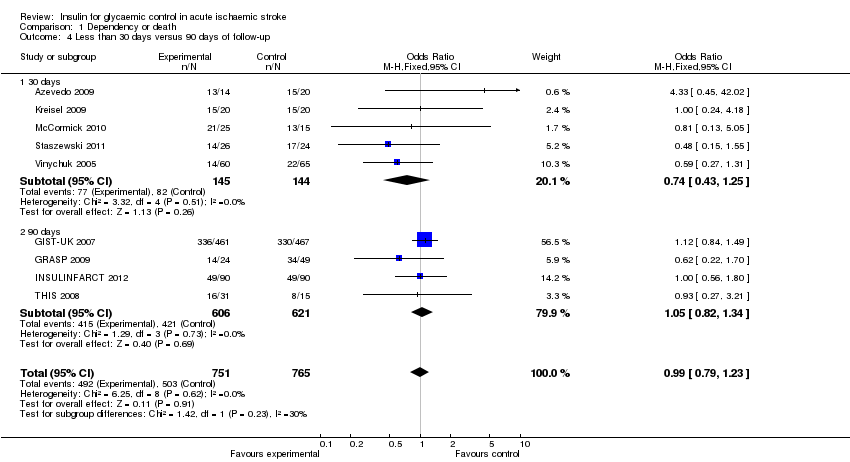
For the outcome of dependency or death, we compared the studies with the outcome measured earlier than 30 days versus 90 days. The studies with 30 days of follow‐up were: Azevedo 2009, Kreisel 2009, McCormick 2010, Staszewski 2011, Vinychuk 2005, Vriesendorp 2009, and Walters 2006. However, Staszewski 2011 and Walters 2006 did not report this outcome. The studies with 90 days of follow‐up were GIST‐UK 2007, GRASP 2009, INSULINFARCT 2012, and THIS 2008. Meta‐analysis of the comparisons found no significant difference between the treatment and control groups when stratified by follow‐up, with an OR of 0.74 (95% CI 0.43 to 1.25) for 30 days and an OR of 1.05 (95% CI 0.82 to 1.34) for 90 days (Analysis 1.4).
For the outcome of final neurological deficit, we found a statistically significant difference between 30 days and 90 days of follow‐up, in favour of the intensive glucose control group, with a SMD of ‐0.47 (95% CI ‐0.72 to ‐0.23) for 30 days and 0.00 (95% CI ‐0.12 to 0.11) for 90 days of follow‐up (Analysis 2.4).
Sensitivity analyses
-
Excluding the studies with a presumed diagnosis of ischaemic stroke (GIST‐UK 2007; Vriesendorp 2009): the OR for death or dependency (primary outcome) was 0.82 (95% CI 0.58 to 1.17).
-
Excluding studies where the controls received insulin: in all the studies except Walters 2006 the control group received insulin. The range of glycaemia was different in the different studies. The study by Vinychuk 2005 did not report the intervention in the control group.
-
Excluding studies with inadequate allocation concealment (Azevedo 2009; Kreisel 2009; McCormick 2010; Staszewski 2011; Vriesendorp 2009 ). The outcome of dependency or death had an OR of 1.0 (95% CI 0.79 to 1.26).
-
Excluding the largest study: this was the GIST‐UK 2007 study because the results were the same as above with an OR of 0.82 (95% CI 0.58 to 1.17).
Discussion
Our updated systematic review and meta‐analyses found similar results to those published two years ago and suggest that the administration of intravenous insulin in an attempt to maintain serum glucose within a specific normal range in the first hours of acute ischaemic stroke does not provide benefit in terms of functional outcome or deaths at 30 days or 90 days, or improvement in final neurological deficit.
While there was no difference in net benefit noted between the treatment and control groups, there was a significant difference between the groups with regard to the adverse event of hypoglycaemia. Specifically, those participants who were maintained within a more tight range of glycaemia with intravenous insulin experienced a greater risk of symptomatic and asymptomatic hypoglycaemia than those in the control group.
When examining the endpoint of dependency or death, subgroup analyses showed that there was no difference between participants with DM and those without, and there was no difference when looking at the outcome at 30 days or 90 days.
For the endpoint of final neurological deficit, we found no difference in the mean NIHSS or ESS scores between the intervention and control groups. In the subgroup analyses there was no statistically significant difference between the DM and non‐DM cohorts. This means that the treatment did not appear to be more effective in one or the other group of participants.
For the subgroup analyses of neurological deficit at 30 days versus 90 days, the effect of the intervention was favourable in those studies that reported the outcome at 30 days but not at 90 days; this result is difficult to interpret because the natural history of ischaemic stroke is that the outcomes improve and stabilize by three months, which is likely to be why this time point is more common and reliable in studies of ischaemic stroke. Another possible explanation for this result is better quality of the studies that reported the outcomes at 90 days; as these studies were bigger and accounted for 81% of the total number of participants included in the review; two of the three studies were blinded to the allocation group when evaluating the neurological and functional outcomes. In comparison, for the 30‐day outcome only one of the five studies was blinded for the neurological and functional outcome assessments.
When plotting the results in a two by two table we found that the number needed to treat (NNT) or to harm (NNH) for the outcome of death was 91, meaning that one in every 91 patients could be harmed by the treatment, with an absolute risk increase of 1.10% in the treatment group (95% CI ‐3.3 to 5.5%). Because the confidence interval includes positive and negative numbers, the NNT or NNH was not significant between the treatment and control groups for this outcome.
The NNT for the outcome of dependency or death was 419, meaning that one in every 419 patients could benefit from the treatment, with an absolute risk reduction of 0.24% % in the treatment group (95% CI ‐4.5% to 5.0%). Because the confidence interval includes positive and negative numbers, the NNT was not significant between the treatment and control groups for this outcome.
The NNH for the outcome of symptomatic hypoglycaemia was nine, meaning that one in every nine patients will have a symptomatic hypoglycaemic event with an absolute risk increase of 11.5%% in the treatment group (95% CI 9.1 to 13.9%). This is statistically significant. The 95% CI for the NNT ranges from 7.2 to 11.0.
Remaining questions include how tight the control must be to obtain the most benefit without increasing the risk for severe hypoglycaemia, and whether an acuity level exists in which this benefit is not clearly visualized (Bochicchio 2008). The extent to which intensive insulin therapy and tight control of blood glucose improve the outcome after ischaemic neurological insults remains unclear. The benefit of such treatment regimes may be negated by the hypoglycaemic episodes, which may aggravate neurological injury (Prakash 2008). Although it seems sensible to control hyperglycaemia in people with neurological injury the treatment must account for potential hypoglycaemic episodes, which can be detrimental. Therefore, it seems prudent that we accept slightly less tight blood glucose control than in critically ill people without neurological injury.
Summary of main results
Our review suggests that the administration of intravenous insulin in an attempt to maintain serum glucose within a specific normal range in the first hours of acute ischaemic stroke does not provide benefit in terms of functional outcome, disability, improvement in final neurological deficit, or death at 30 or 90 days, and confers a greater risk of symptomatic and asymptomatic hypoglycaemia.
Overall completeness and applicability of evidence
The studies identified in this review are sufficient to address the objectives of the review, and the population that is included allows for good generalization of the results and external validity. The studies include more than 1000 participants from different countries overall. These results discourage the maintenance of a tight glycaemic control.
Quality of the evidence
We included 11 trials involving 1583 participants (791 intervention and 792 controls). There was an intermediate risk of bias overall. The allocation concealment was adequate in most of the studies, but most of the studies were not blinded. The heterogeneity across the studies was adequate.
Potential biases in the review process
The results of this systematic review and meta‐analysis should be interpreted with caution for several reasons. First, only 11 studies were available for inclusion in the analyses. Second, the studies were performed in a stroke unit and not in the general ward. Specialised units for the management of people with stroke have been shown to improve the outcomes of those people presenting with haemorrhagic and ischaemic strokes, and should be the preferred setting (Langhorne 1993).
For the meta‐analyses we decided to use the fixed‐effect method instead of the random‐effects method because of a suspected acceptable level of heterogeneity across the studies (Cook 1995). The random‐effects method assumes that the different studies are estimating different, yet related, treatment effects (DerSimonian 1986). The random and inverse variance methods will give similar results when there is no heterogeneity among the studies. Where there is heterogeneity, confidence intervals for the average treatment effect will be wider if the random‐effects model rather than a fixed‐effect model is used, and corresponding claims of statistical significance of the treatment effect will be more conservative. It is also possible that the central estimate will change if there are relationships between the observed treatment effects and sample sizes. The fixed‐effect model is based on the mathematical assumption that a single common effect underlies every study in the meta‐analysis; this assumes that there is low heterogeneity among the studies.
When evaluating heterogeneity the readers must be cautious in interpreting the I2 statistic because of the moderate number of studies included and the small number of participants in each study. Therefore, tests that do not reject the null hypothesis do not necessarily indicate absence of heterogeneity (Montori 2003). However, we decided that it was sensible to pool the results. Heterogeneity comes from clinical differences. For instance, the biggest study (GIST‐UK 2007) included 16% of participants without an ischaemic stroke, contributing to some degree to heterogeneity. Another source of heterogeneity is differences in the treatment effects secondary to a different methodological approach (Montori 2003); for instance, few studies were blinded to the allocation group when assessing the outcome. To explore heterogeneity we performed subgroup analyses. One particular problem with the GIST‐UK 2007, the biggest included study, is that there might be confounding that is secondary to lower blood pressure levels in the intervention group. This study found that the overall mean plasma glucose level and mean systolic blood pressure were significantly lower in the glucose‐insulin‐potassium group (MD in glucose 0.57 mmol/L, P < 0.001; MD in blood pressure 9.0 mm Hg, P < 0.0001).
For the secondary outcome of final neurological deficit, we used ordinal scales (NIHSS and ESS) as continuous outcomes, and we made the assumption that they followed a normal distribution for the purposes of the meta‐analyses, but we acknowledge that in clinical practice most of the functional scales have a skewed distribution in favour of better scores. We are aware that the methods for meta‐analysis of continuous data assume that the outcomes have a normal distribution in each treatment arm in each study. This assumption may not always be met, although this is less important in large studies.
For the final neurological deficit, we used the SMD approach instead of the MD because the scales were different (NIHSS and ESS). In this case, the standard deviation was used to standardise the MDs to a single scale as well as in the computation of study weights. It is assumed that a variation between standard deviations reflects only differences in measurement scales and not differences in the reliability of the outcome measures or variability among trial populations. These limitations of the methods should be borne in mind where an unexpected variation of standard deviations across studies is observed.
Sensitivity analyses test the robustness of the results relative to features of the primary studies and to key assumptions and decisions (Cook 1995), and they test for bias due to the retrospective nature of systematic reviews. Sensitivity analyses in meta‐analysis allow more appropriate and reliable conclusions when problems such as unavailable estimates are present (Riley 2004). We were able to perform only a minor percentage of the previously proposed sensitivity analyses due to the fact that, for the primary outcome, some studies did not report enough data.
Reviewing research for systematic reviews implies a retrospective nature and therefore is subject to random and systematic error (Montori 2003). In order to decrease this error, we wrote a protocol before the search was made and two review authors worked independently in the extraction of the information, with substantial agreement in the decisions on which studies should be included.
Publication bias could affect our review despite our extensive search procedure. More than 10 studies (ideally more than 30 studies) should be included in order to provide a funnel plot (Lau 2006). We did not contact pharmaceutical companies manufacturing insulin. Our meta‐analysis included only RCTs and we found only one unpublished study in the previous version of the review that was subsequently published in 2011. We contacted the authors for clarification in regards to study information when appropriate.
Agreements and disagreements with other studies or reviews
Clinical trials that investigated the role of intensive glycaemic control on critically ill people have produced controversial results. Studies in favour of tight glucose control include Van den Berghe 2001, which showed that insulin therapy decreases mortality in people with DM and those undergoing surgery. Another study reported beneficial outcomes with strict blood glucose control after cardiac surgery (Ingels 2006). A study by Lazar et al found that tight glycaemic control in people with DM undergoing coronary artery bypass graft (CABG) improved perioperative outcomes, enhanced survival, and decreased the incidence of ischaemic events and wound complications (Lazar 2004). A study by Vriesendorp et al, on people undergoing surgery for oesophageal cancer, reported an association between postoperative glucose levels and an increased length of hospital stay, but not an increase in infectious complications (Vriesendorp 2004).
Our results are in keeping with other more recent trials of tight glycaemic control. In a study of 400 people after cardiac surgery, there was an increased incidence of death and stroke in the intensive insulin treatment group (Gandhi 2007). In a later study, Van den Berghe et al studied 1200 people and showed that there was no change in mortality among people in medical intensive care units (ICU) (Van den Berghe 2006). Brunkhorst et al studied 537 people with sepsis and found no significant difference between the intensive and conventional therapy groups in the rate of death or mean score for organ failure (Brunkhorst 2008). The CREATE‐ECLA 2005 study compared glucose‐insulin‐potassium infusion with usual care in 20,000 people presenting with ST‐segment elevation myocardial infarction and found a lack of benefit on mortality, cardiac arrest, and cardiogenic shock. The multicentre Normoglycaemia in Intensive Care Evaluation and Survival Using Glucose Algorithm Regulation (NICE‐SUGAR) study had a mixed ICU population with 6104 people. This study provided evidence that intensive insulin treatment was associated with increased mortality and increased hypoglycaemia without significant differences in critical care unit or hospital length of stay, number of days of mechanical ventilation, or need for renal replacement therapy. In a meta‐analysis of 29 RCTs involving 8432 participants (Wiener 2008) there was no difference in hospital mortality between tight and usual glucose control (21.6% versus 23.3%).
Risk of bias summary: review authors' judgements about each risk of bias item for each included study.

Comparison 1 Dependency or death, Outcome 1 Dependency or death at the end of the follow‐up.

Comparison 1 Dependency or death, Outcome 2 Death.

Comparison 1 Dependency or death, Outcome 3 Diabetes mellitus versus no diabetes mellitus.
Comparison 1 Dependency or death, Outcome 4 Less than 30 days versus 90 days of follow‐up.

Comparison 2 Functional neurological outcome, Outcome 1 NIHSS or ESS at the end of the follow‐up.
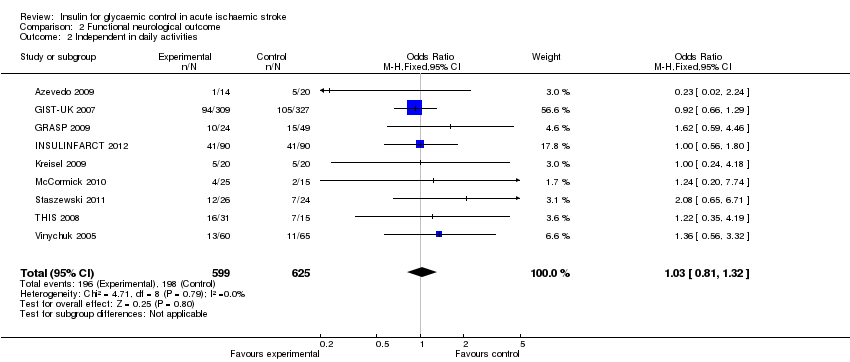
Comparison 2 Functional neurological outcome, Outcome 2 Independent in daily activities.
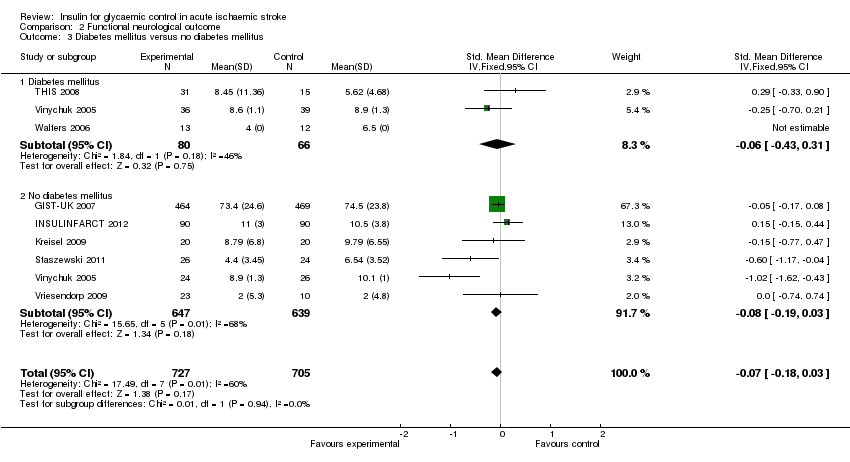
Comparison 2 Functional neurological outcome, Outcome 3 Diabetes mellitus versus no diabetes mellitus.
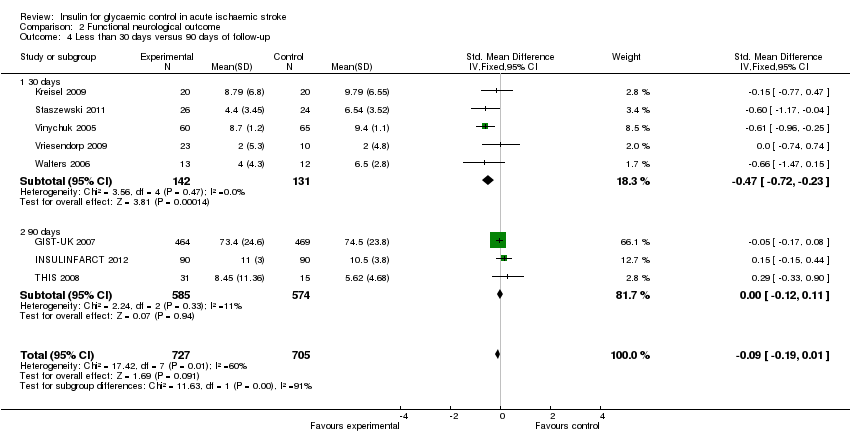
Comparison 2 Functional neurological outcome, Outcome 4 Less than 30 days versus 90 days of follow‐up.

Comparison 3 Hypoglycaemia, Outcome 1 Symptomatic hypoglycaemia.
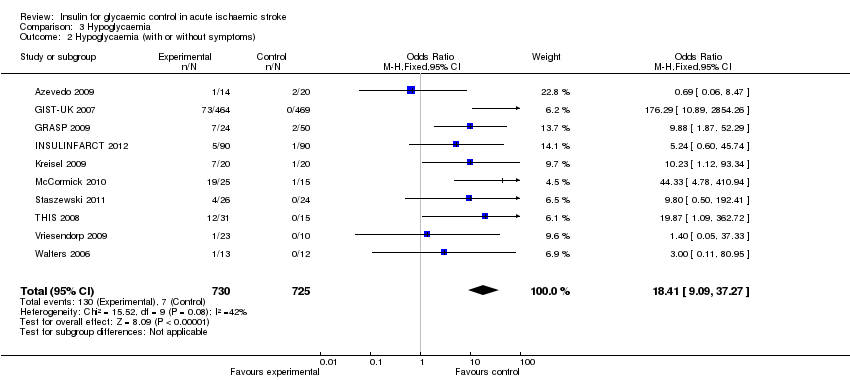
Comparison 3 Hypoglycaemia, Outcome 2 Hypoglycaemia (with or without symptoms).
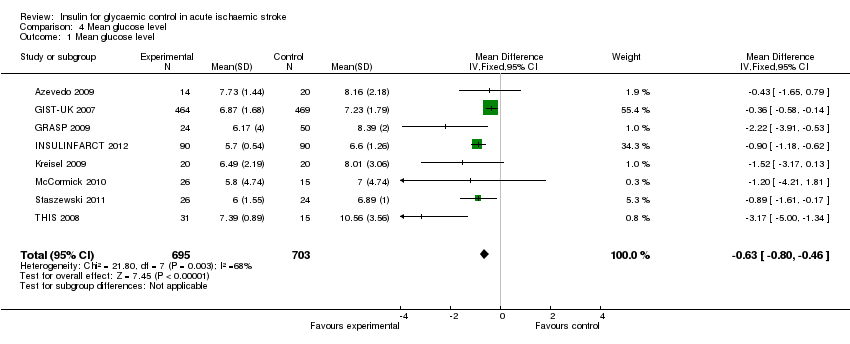
Comparison 4 Mean glucose level, Outcome 1 Mean glucose level.
| Study | Generation of randomisation | Allocation concealment | Blinding: participants and physicians | Blinding: outcome to allocation group | Lost to follow‐up (%) |
| Low risk | Low risk | High risk | High risk | 0 | |
| Low risk | Low risk | High risk | Low risk | 7.4 | |
| Low risk | High risk | High risk | Low risk | 0 | |
| Low risk | Low risk | High risk | Low risk | 0 | |
| Low risk | Low risk | High risk | High risk | 0 | |
| Low risk | Low risk | High risk | Low risk | 1.4 | |
| Low risk | Unclear risk | High risk | High risk | 10 | |
| Low risk | Unclear risk | Unclear risk | High risk | Not reported | |
| Low risk | Low risk | High risk | High risk | 2.2 | |
| High risk | High risk | High risk | High risk | 15.2 | |
| Low risk | Unclear risk | High risk | High risk | Not reported |
| Outcome or subgroup title | No. of studies | No. of participants | Statistical method | Effect size |
| 1 Dependency or death at the end of the follow‐up Show forest plot | 9 | 1516 | Odds Ratio (M‐H, Fixed, 95% CI) | 0.99 [0.79, 1.23] |
| 2 Death Show forest plot | 9 | 1422 | Odds Ratio (M‐H, Fixed, 95% CI) | 1.09 [0.85, 1.41] |
| 3 Diabetes mellitus versus no diabetes mellitus Show forest plot | 8 | 1482 | Odds Ratio (M‐H, Fixed, 95% CI) | 0.97 [0.77, 1.21] |
| 3.1 Diabetes mellitus | 3 | 194 | Odds Ratio (M‐H, Fixed, 95% CI) | 0.66 [0.35, 1.24] |
| 3.2 No diabetes mellitus | 6 | 1288 | Odds Ratio (M‐H, Fixed, 95% CI) | 1.02 [0.81, 1.30] |
| 4 Less than 30 days versus 90 days of follow‐up Show forest plot | 9 | 1516 | Odds Ratio (M‐H, Fixed, 95% CI) | 0.99 [0.79, 1.23] |
| 4.1 30 days | 5 | 289 | Odds Ratio (M‐H, Fixed, 95% CI) | 0.74 [0.43, 1.25] |
| 4.2 90 days | 4 | 1227 | Odds Ratio (M‐H, Fixed, 95% CI) | 1.05 [0.82, 1.34] |
| Outcome or subgroup title | No. of studies | No. of participants | Statistical method | Effect size |
| 1 NIHSS or ESS at the end of the follow‐up Show forest plot | 8 | 1432 | Std. Mean Difference (IV, Fixed, 95% CI) | ‐0.09 [‐0.19, 0.01] |
| 2 Independent in daily activities Show forest plot | 9 | 1224 | Odds Ratio (M‐H, Fixed, 95% CI) | 1.03 [0.81, 1.32] |
| 3 Diabetes mellitus versus no diabetes mellitus Show forest plot | 8 | 1432 | Std. Mean Difference (IV, Fixed, 95% CI) | ‐0.07 [‐0.18, 0.03] |
| 3.1 Diabetes mellitus | 3 | 146 | Std. Mean Difference (IV, Fixed, 95% CI) | ‐0.06 [‐0.43, 0.31] |
| 3.2 No diabetes mellitus | 6 | 1286 | Std. Mean Difference (IV, Fixed, 95% CI) | ‐0.08 [‐0.19, 0.03] |
| 4 Less than 30 days versus 90 days of follow‐up Show forest plot | 8 | 1432 | Std. Mean Difference (IV, Fixed, 95% CI) | ‐0.09 [‐0.19, 0.01] |
| 4.1 30 days | 5 | 273 | Std. Mean Difference (IV, Fixed, 95% CI) | ‐0.47 [‐0.72, ‐0.23] |
| 4.2 90 days | 3 | 1159 | Std. Mean Difference (IV, Fixed, 95% CI) | ‐0.00 [‐0.12, 0.11] |
| Outcome or subgroup title | No. of studies | No. of participants | Statistical method | Effect size |
| 1 Symptomatic hypoglycaemia Show forest plot | 10 | 1455 | Odds Ratio (M‐H, Fixed, 95% CI) | 14.60 [6.62, 32.21] |
| 2 Hypoglycaemia (with or without symptoms) Show forest plot | 10 | 1455 | Odds Ratio (M‐H, Fixed, 95% CI) | 18.41 [9.09, 37.27] |
| Outcome or subgroup title | No. of studies | No. of participants | Statistical method | Effect size |
| 1 Mean glucose level Show forest plot | 8 | 1398 | Mean Difference (IV, Fixed, 95% CI) | ‐0.63 [‐0.80, ‐0.46] |