Intervenciones psicosociales para el trastorno de conversión
Referencias
References to studies included in this review
References to studies excluded from this review
Additional references
Characteristics of studies
Characteristics of included studies [ordered by study ID]
Ir a:
| Methods | Allocation: randomised by computer | |
| Participants | Diagnosis: Pseudoseizures using DSM IV criteria | |
| Interventions | 1. Inpatient treatment in psychiatric ward using PI. 2 sessions a day for 3 weeks. N=15 | |
| Outcomes | Mental state: HRSA at 6 weeks | |
| Notes | ||
| Risk of bias | ||
| Bias | Authors' judgement | Support for judgement |
| Allocation concealment? | Unclear risk | B ‐ Unclear |
| Methods | Allocation: block randomisation | |
| Participants | Diagnosis: conversion disorder, motor type or somatization disorder with motor conversion symptoms according to DSMIIIR. | |
| Interventions | 1. Inpatient treatment programme (groups, individual physiotherapy, exercise and bed rest) + hypnosis (therapy manual) introductory session and Ihr a week for 8 weeks. Also encouraged to practice self hypnosis for 1/2hr/ day with audiotape to help. N=26 | |
| Outcomes | Leaving the study early Unable to use: | |
| Notes | ||
| Risk of bias | ||
| Bias | Authors' judgement | Support for judgement |
| Allocation concealment? | Unclear risk | B ‐ Unclear |
| Methods | Allocation: block randomisation | |
| Participants | Diagnosis: conversion disorder, motor type or somatization disorder with motor conversion symptoms according to DSMIIIR. | |
| Interventions | 1. Introductory 1 hr session explaining the rationale for using hypnosis then hypnosis for 1hr a week for 10 weeks. Used a treatment manual. Encouraged to practice self hypnosis for 1/2hr/ day with audiotape to help. N=24 | |
| Outcomes | Leaving the study early Unable to use: | |
| Notes | ||
| Risk of bias | ||
| Bias | Authors' judgement | Support for judgement |
| Allocation concealment? | Unclear risk | B ‐ Unclear |
HRSA = Hamilton Rating Scale for Anxiety
SHCS = Stanford Hypnotic Clinical Scale for Adults
SCL‐90 = Symptom Checklist
VRMC = Video rating scale for motor conversion symptoms
ICIDH = International classification of impairments, disabilities and handicaps
SRSS = NAtional Institute of Mental Health Self‐ Rating Symptom Scale
f = female
m = male
PI = paradoxical intention therapy
Characteristics of excluded studies [ordered by study ID]
Ir a:
| Study | Reason for exclusion |
| Allocation: no control group | |
| Allocation: no control group | |
| Allocation: no control group | |
| Allocation: no control group | |
| Allocation: no control group | |
| Allocation: no control group | |
| Allocation: no control group | |
| Allocation: randomised | |
| Allocation: no control group | |
| Allocation: no control group | |
| Allocation: no control group | |
| Allocation: no control group | |
| Allocation: not randomised just 3 groups matched for age, sex, per capita income, duration of illness and type of illness. | |
| Allocation: no control group | |
| Allocation: no control group | |
| Allocation: no control group | |
| Allocation: no control group | |
| Allocation: no control group | |
| Allocation: no control group | |
| Allocation: no control group | |
| Allocation: no control group. | |
| Allocation: no control group | |
| Allocation: no control group | |
| Allocation: no control group | |
| Allocation: no control group | |
| Allocation: randomised | |
| Allocation: no control group | |
| Allocation: randomised | |
| Allocation: no control group | |
| Allocation: no control group | |
| Allocation: Matched according to age, race, marital status and baseline clinical status then randomly assigned to 3 groups. | |
| Allocation: No control group | |
| Allocation: No control group | |
| Allocation: No control group | |
| Allocation: No control group | |
| Allocation: no control group | |
| Allocation: no control group | |
| Allocation: no control group | |
| Allocation: no control group | |
| Allocation: no control group |
Data and analyses
| Outcome or subgroup title | No. of studies | No. of participants | Statistical method | Effect size |
| 1 Physical signs (any attacks in last 2 weeks, high=poor, short term) Show forest plot | 1 | 30 | Risk Ratio (M‐H, Fixed, 95% CI) | 0.17 [0.02, 1.22] |
| Analysis 1.1  Comparison 1 INPATIENT PARADOXICAL INTENTION THERAPY (PI) versus OUTPATIENT DIAZEPAM, Outcome 1 Physical signs (any attacks in last 2 weeks, high=poor, short term). | ||||
| 2 Mental state (endpoint data, short term, HRSA, high=poor) Show forest plot | 1 | 30 | Mean Difference (IV, Fixed, 95% CI) | ‐3.73 [‐6.96, ‐0.50] |
| Analysis 1.2  Comparison 1 INPATIENT PARADOXICAL INTENTION THERAPY (PI) versus OUTPATIENT DIAZEPAM, Outcome 2 Mental state (endpoint data, short term, HRSA, high=poor). | ||||
| 3 Leaving the study early (endpoint data, short term) Show forest plot | 1 | 30 | Risk Ratio (M‐H, Fixed, 95% CI) | 0.0 [0.0, 0.0] |
| Analysis 1.3  Comparison 1 INPATIENT PARADOXICAL INTENTION THERAPY (PI) versus OUTPATIENT DIAZEPAM, Outcome 3 Leaving the study early (endpoint data, short term). | ||||
| Outcome or subgroup title | No. of studies | No. of participants | Statistical method | Effect size |
| 1 Leaving the study early ‐ short term Show forest plot | 1 | 49 | Risk Ratio (M‐H, Fixed, 95% CI) | 0.88 [0.14, 5.79] |
| Analysis 2.1  Comparison 2 INPATIENT TREATMENT PROGRAMME + HYPNOSIS versus INPATIENT TREATMENT PROGRAMME + INDIVIDUAL SESSIONS, Outcome 1 Leaving the study early ‐ short term. | ||||
| Outcome or subgroup title | No. of studies | No. of participants | Statistical method | Effect size | ||||||||||||||||||||||||||||||
| 1 Physical signs (endpoint data, short term, high=poor) Show forest plot | 1 | 43 | Mean Difference (IV, Fixed, 95% CI) | 2.10 [1.29, 2.91] | ||||||||||||||||||||||||||||||
| Analysis 3.1  Comparison 3 OUTPATIENT HYPNOSIS versus WAITING LIST, Outcome 1 Physical signs (endpoint data, short term, high=poor). | ||||||||||||||||||||||||||||||||||
| 1.1 Observation (VRMC, high =good) | 1 | 43 | Mean Difference (IV, Fixed, 95% CI) | 2.10 [1.29, 2.91] | ||||||||||||||||||||||||||||||
| 2 Mental state (endpoint data, short term, SCL‐90, high =poor) Show forest plot | 1 | 43 | Mean Difference (IV, Fixed, 95% CI) | ‐12.30 [‐44.28, 19.68] | ||||||||||||||||||||||||||||||
| Analysis 3.2  Comparison 3 OUTPATIENT HYPNOSIS versus WAITING LIST, Outcome 2 Mental state (endpoint data, short term, SCL‐90, high =poor). | ||||||||||||||||||||||||||||||||||
| 3 Physical disability Show forest plot | Other data | No numeric data | ||||||||||||||||||||||||||||||||
| Analysis 3.3
Comparison 3 OUTPATIENT HYPNOSIS versus WAITING LIST, Outcome 3 Physical disability. | ||||||||||||||||||||||||||||||||||
| 3.1 Interview data (ICIDH, high=poor) | Other data | No numeric data | ||||||||||||||||||||||||||||||||
| 4 Leaving the study early ‐ short term Show forest plot | 1 | 49 | Risk Ratio (M‐H, Fixed, 95% CI) | 2.08 [0.42, 10.34] | ||||||||||||||||||||||||||||||
| Analysis 3.4  Comparison 3 OUTPATIENT HYPNOSIS versus WAITING LIST, Outcome 4 Leaving the study early ‐ short term. | ||||||||||||||||||||||||||||||||||
| 5 Hypnotisability (baseline, SHCS, high =good) Show forest plot | 1 | 43 | Mean Difference (IV, Fixed, 95% CI) | ‐0.10 [‐1.09, 0.89] | ||||||||||||||||||||||||||||||
| Analysis 3.5  Comparison 3 OUTPATIENT HYPNOSIS versus WAITING LIST, Outcome 5 Hypnotisability (baseline, SHCS, high =good). | ||||||||||||||||||||||||||||||||||

Comparison 1 INPATIENT PARADOXICAL INTENTION THERAPY (PI) versus OUTPATIENT DIAZEPAM, Outcome 1 Physical signs (any attacks in last 2 weeks, high=poor, short term).

Comparison 1 INPATIENT PARADOXICAL INTENTION THERAPY (PI) versus OUTPATIENT DIAZEPAM, Outcome 2 Mental state (endpoint data, short term, HRSA, high=poor).
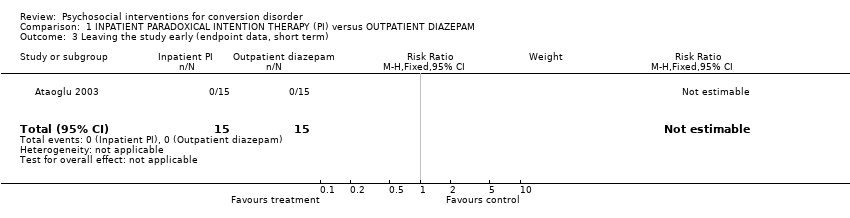
Comparison 1 INPATIENT PARADOXICAL INTENTION THERAPY (PI) versus OUTPATIENT DIAZEPAM, Outcome 3 Leaving the study early (endpoint data, short term).

Comparison 2 INPATIENT TREATMENT PROGRAMME + HYPNOSIS versus INPATIENT TREATMENT PROGRAMME + INDIVIDUAL SESSIONS, Outcome 1 Leaving the study early ‐ short term.

Comparison 3 OUTPATIENT HYPNOSIS versus WAITING LIST, Outcome 1 Physical signs (endpoint data, short term, high=poor).
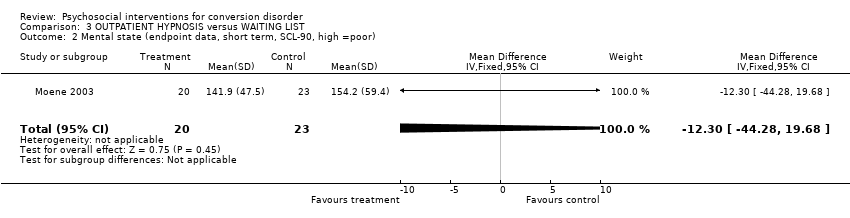
Comparison 3 OUTPATIENT HYPNOSIS versus WAITING LIST, Outcome 2 Mental state (endpoint data, short term, SCL‐90, high =poor).
| Study | Intervention | Mean | sd | N | Notes |
| Interview data (ICIDH, high=poor) | |||||
| Moene 2003 | Hypnosis | 13.2 | 10.6 | 20 | |
| Moene 2003 | Controls | 16.6 | 11.7 | 23 | |
Comparison 3 OUTPATIENT HYPNOSIS versus WAITING LIST, Outcome 3 Physical disability.

Comparison 3 OUTPATIENT HYPNOSIS versus WAITING LIST, Outcome 4 Leaving the study early ‐ short term.

Comparison 3 OUTPATIENT HYPNOSIS versus WAITING LIST, Outcome 5 Hypnotisability (baseline, SHCS, high =good).
| Outcome or subgroup title | No. of studies | No. of participants | Statistical method | Effect size |
| 1 Physical signs (any attacks in last 2 weeks, high=poor, short term) Show forest plot | 1 | 30 | Risk Ratio (M‐H, Fixed, 95% CI) | 0.17 [0.02, 1.22] |
| 2 Mental state (endpoint data, short term, HRSA, high=poor) Show forest plot | 1 | 30 | Mean Difference (IV, Fixed, 95% CI) | ‐3.73 [‐6.96, ‐0.50] |
| 3 Leaving the study early (endpoint data, short term) Show forest plot | 1 | 30 | Risk Ratio (M‐H, Fixed, 95% CI) | 0.0 [0.0, 0.0] |
| Outcome or subgroup title | No. of studies | No. of participants | Statistical method | Effect size |
| 1 Leaving the study early ‐ short term Show forest plot | 1 | 49 | Risk Ratio (M‐H, Fixed, 95% CI) | 0.88 [0.14, 5.79] |
| Outcome or subgroup title | No. of studies | No. of participants | Statistical method | Effect size |
| 1 Physical signs (endpoint data, short term, high=poor) Show forest plot | 1 | 43 | Mean Difference (IV, Fixed, 95% CI) | 2.10 [1.29, 2.91] |
| 1.1 Observation (VRMC, high =good) | 1 | 43 | Mean Difference (IV, Fixed, 95% CI) | 2.10 [1.29, 2.91] |
| 2 Mental state (endpoint data, short term, SCL‐90, high =poor) Show forest plot | 1 | 43 | Mean Difference (IV, Fixed, 95% CI) | ‐12.30 [‐44.28, 19.68] |
| 3 Physical disability Show forest plot | Other data | No numeric data | ||
| 3.1 Interview data (ICIDH, high=poor) | Other data | No numeric data | ||
| 4 Leaving the study early ‐ short term Show forest plot | 1 | 49 | Risk Ratio (M‐H, Fixed, 95% CI) | 2.08 [0.42, 10.34] |
| 5 Hypnotisability (baseline, SHCS, high =good) Show forest plot | 1 | 43 | Mean Difference (IV, Fixed, 95% CI) | ‐0.10 [‐1.09, 0.89] |