Corticosteroides intraarticulares para la artrosis de rodilla
Información
- DOI:
- https://doi.org/10.1002/14651858.CD005328.pub3Copiar DOI

- Base de datos:
-
- Cochrane Database of Systematic Reviews
- Versión publicada:
-
- 22 octubre 2015see what's new
- Tipo:
-
- Intervention
- Etapa:
-
- Review
- Grupo Editorial Cochrane:
-
Grupo Cochrane de Salud musculoesquelética
- Copyright:
-
- Copyright © 2015 The Cochrane Collaboration. Published by John Wiley & Sons, Ltd.
Cifras del artículo
Altmetric:
Citado por:
Autores
Contributions of authors
Protocol completion: Jüni, Rutjes, Reichenbach, da Costa.
Acquisition of data: Hari, Rutjes, Fischer, Silletta, da Costa.
Analysis and interpretation of data: Jüni, Hari, Reichenbach, da Costa.
Manuscript preparation: Jüni, Hari, da Costa.
Statistical analysis: Jüni, da Costa.
Sources of support
Internal sources
-
No sources of support supplied
External sources
-
NIHR Cochrane Direct Commmission Incentive Award, UK.
This review was supported by a grant from the NIHR, UK (NIHR Cochrane Direct Commmission Incentive Award)
Declarations of interest
Peter Jüni: none
Roman Hari: none
Anne WS Rutjes: none
Roland Fischer: none
Maria G Silletta: none
Stephan Reichenbach: none
Bruno R da Costa: none
Acknowledgements
We acknowledge Dr. med. Marcello Di Nisio for his contribution with reference screening. We are grateful to Dr. Janne Estill and Elena Jüni for their translation of the Popov 1989 trial. We would also like to acknowledge the authors of the original version of this review: Nicholas Bellamy, Jane Campbell, Vivian Welch, Travis L Gee, Robert Bourne, and George A Wells.
Version history
| Published | Title | Stage | Authors | Version |
| 2015 Oct 22 | Intra‐articular corticosteroid for knee osteoarthritis | Review | Peter Jüni, Roman Hari, Anne WS Rutjes, Roland Fischer, Maria G Silletta, Stephan Reichenbach, Bruno R da Costa | |
| 2006 Apr 19 | Intraarticular corticosteroid for treatment of osteoarthritis of the knee | Review | Nicholas Bellamy, Jane Campbell, Vivian Welch, Travis L Gee, Robert Bourne, George A Wells | |
| 2005 Apr 20 | Intraarticular corticosteroid for treatment of osteoarthritis of the knee | Review | Nicholas Bellamy, Jane Campbell, Vivian A Robinson, T Gee, Robert Bourne, George Wells | |
Differences between protocol and review
Types of studies
In the previous version of this Cochrane Review, only RCTs were eligible for inclusion, while in the present review update both RCTs and quasi‐RCTs were eligible.
Types of interventions
In the previous review version, control interventions were both sham intra‐articular corticosteroid and active interventions (joint lavage, intra‐articular hyaluronan/hylan, and other intra‐articular corticosteroids). In the present review update, the prespecified control interventions were sham intra‐articular corticosteroid and no intervention.
Types of outcome measures
In the previous review version there were eight outcomes: pain, physical function, patient global assessment, joint imaging, adverse reaction caused by procedure, adverse reaction caused by corticosteroid, adverse reaction caused by toxicity‐related withdrawals, total number of withdrawals and dropouts. In the review update, there were two prespecified primary outcomes and six prespecified secondary outcomes. Primary outcomes were pain and physical function, and secondary outcomes were quality of life, joint imaging, and the number of participants who experienced any adverse event, withdrew because of adverse events, and experienced any serious adverse events.
Search methods for identification of studies
In the previous review version, the following four databases were searched: Cochrane Central Register of Controlled Trials (CENTRAL), MEDLINE (including PreMEDLINE), EMBASE, and Current Contents. The electronic searches were supplemented by handsearches of bibliographic references and abstracts published in conference proceedings or in special issues of specialised journals, and industry representatives were contacted to request additional studies of their product that could meet eligibility criteria. In the present review update, we searched the following three databases: Cochrane Central Register of Controlled Trials (CENTRAL), MEDLINE Ovid and PubMed platforms, and EMBASE. The electronic searches were supplemented by handsearches of bibliographic references, abstracts published in conference proceedings, and search of clinical trial registers to identify ongoing or recently concluded trials.
Keywords
MeSH
Medical Subject Headings (MeSH) Keywords
- Adrenal Cortex Hormones [*administration & dosage, adverse effects];
- Arthralgia [*drug therapy, etiology];
- Hyaluronic Acid [administration & dosage, adverse effects, analogs & derivatives, therapeutic use];
- Injections, Intra‐Articular;
- Osteoarthritis, Knee [*drug therapy, therapy];
- Pain Measurement;
- Randomized Controlled Trials as Topic;
- Therapeutic Irrigation [methods];
Medical Subject Headings Check Words
Humans;
PICO
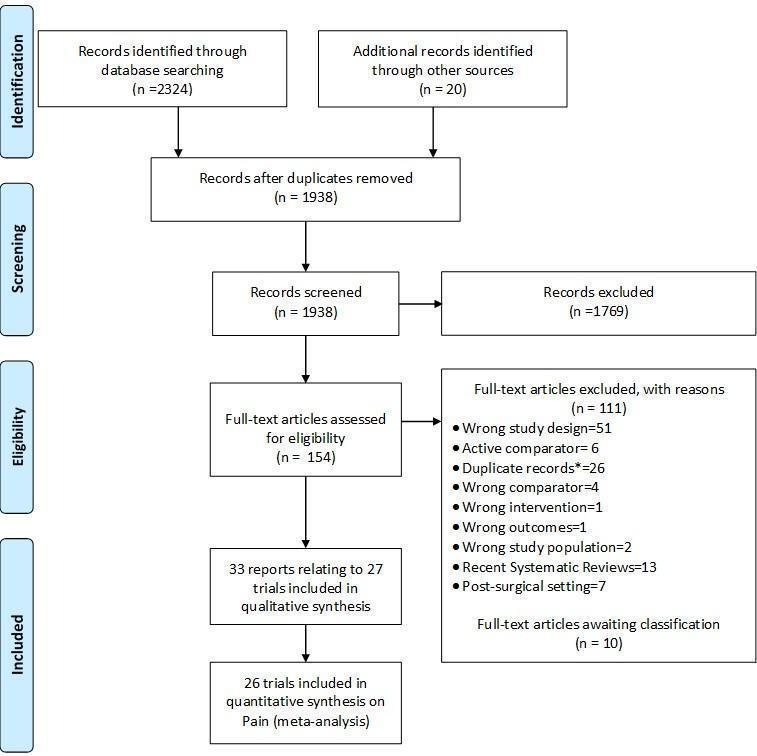
Study flow chart. *records with the exact same bibliographic information of another already‐screened record.
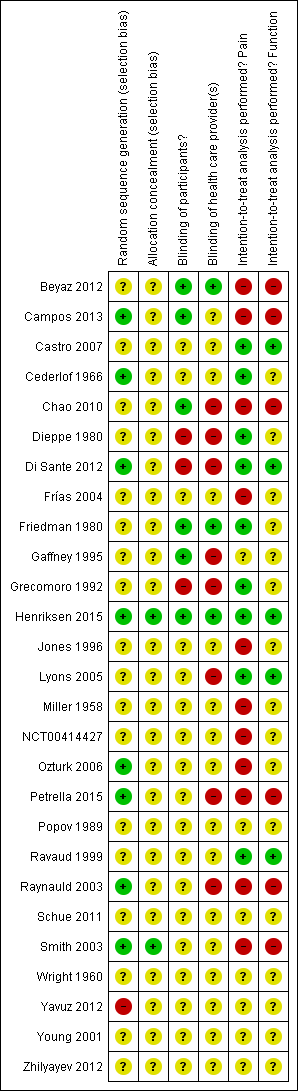
Risk of bias summary: review authors' judgements about each risk of bias item for each included study.
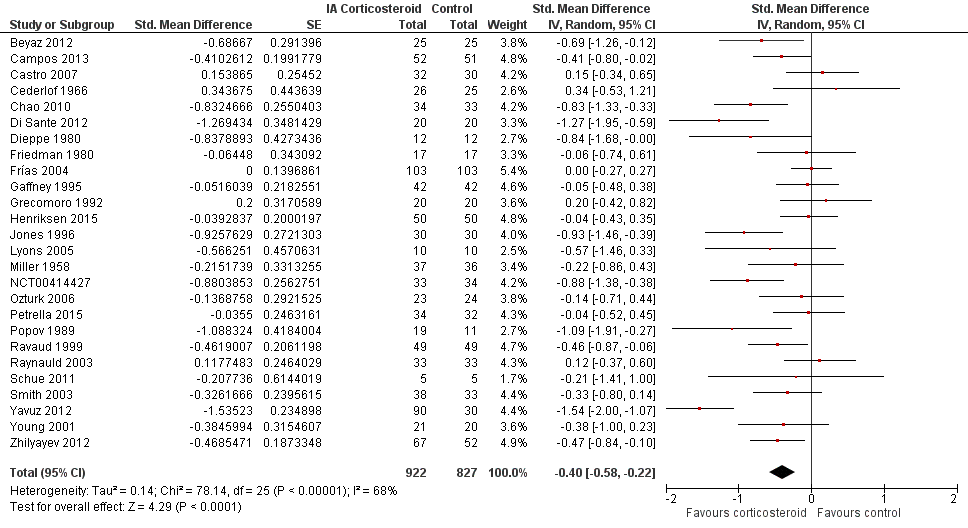
Forest plot of comparison: 1 Pain, outcome: 1.1 Pain ‐ Main.

Contour‐enhanced funnel plot for effects on knee pain. Numbers on x axis refer to standardised mean differences (SMDs), on y axis to standard errors of SMDs
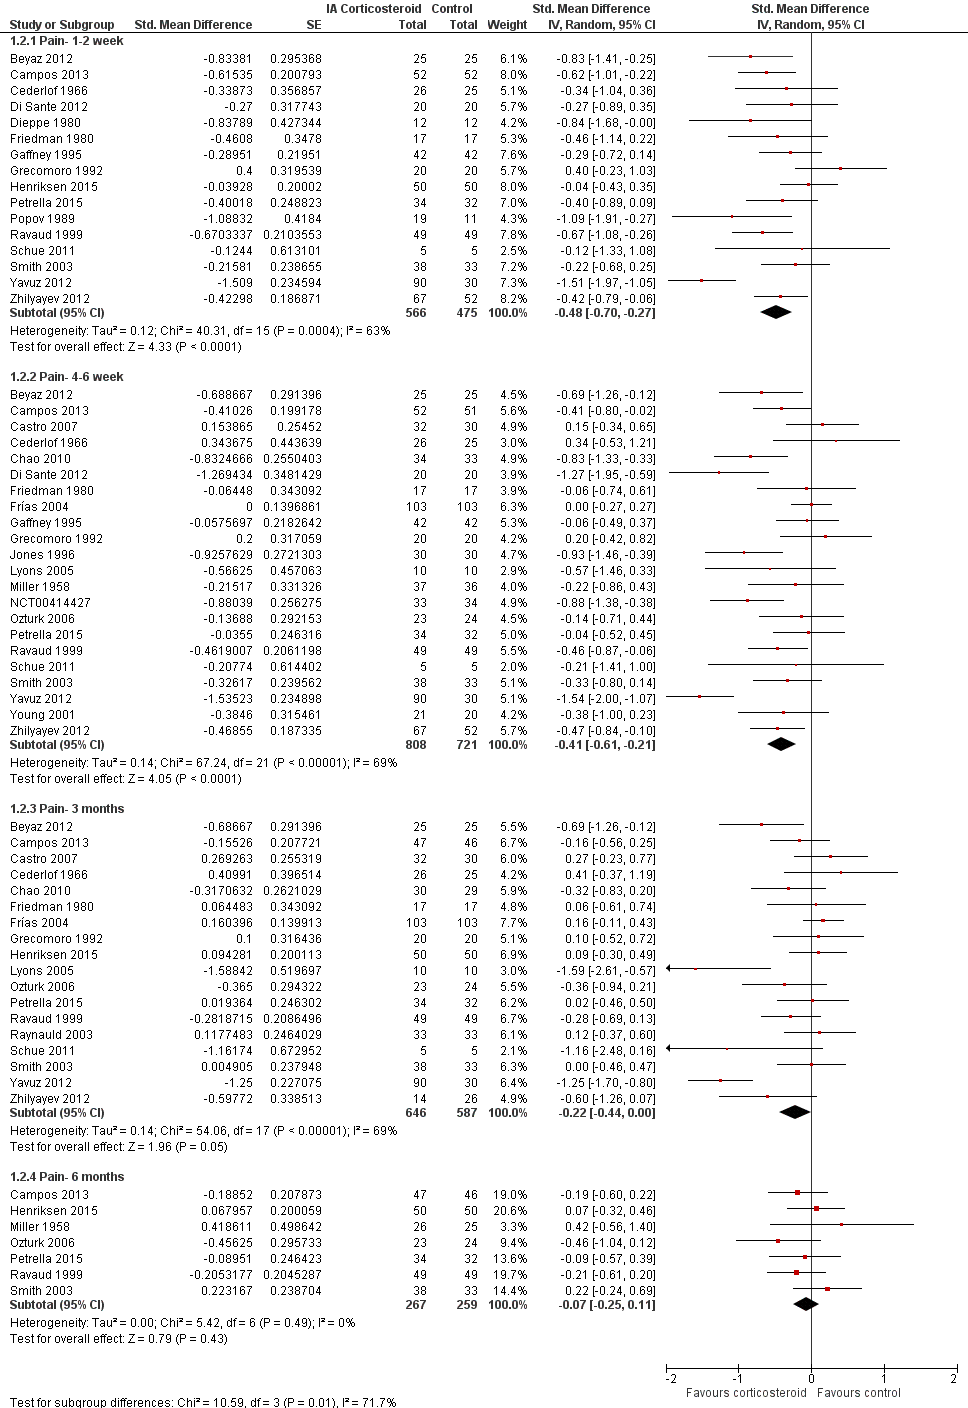
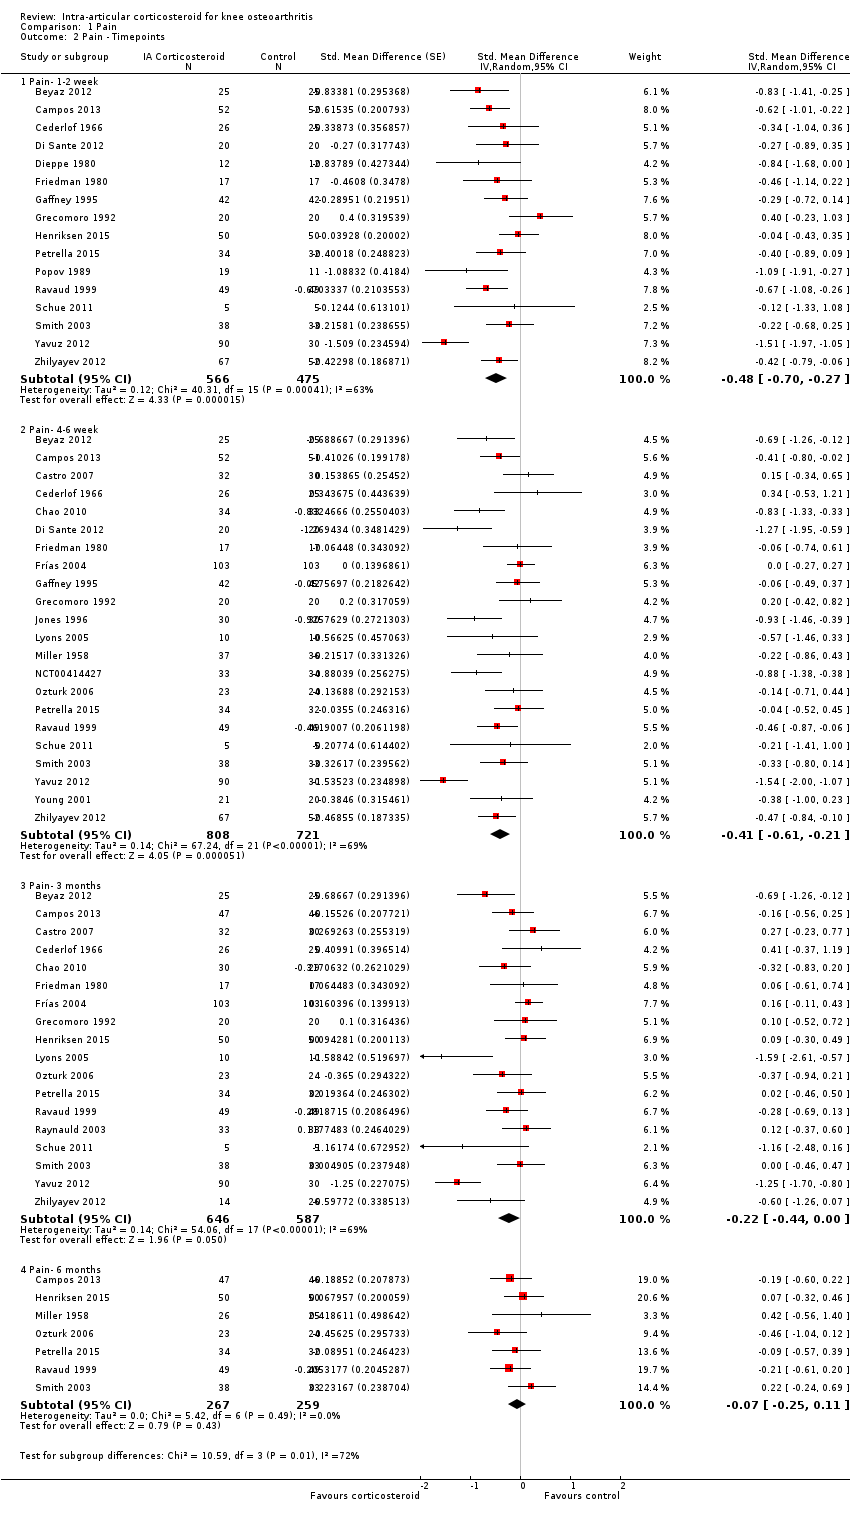
Forest plot of comparison: 1 Pain, outcome: 1.2 Pain ‐ Time points. P for trend = 0.001
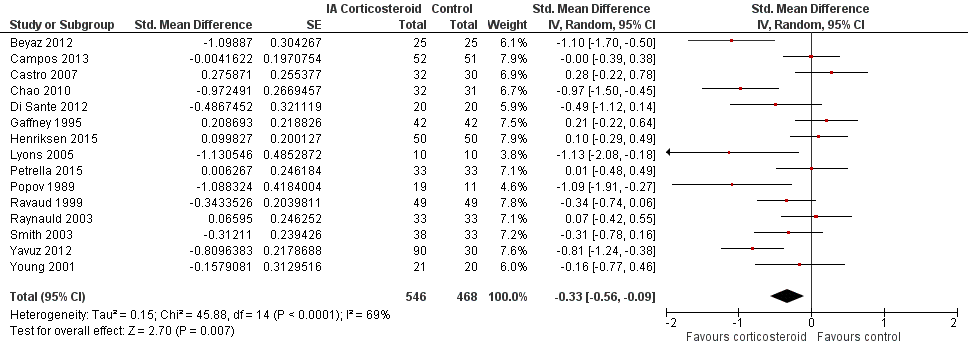
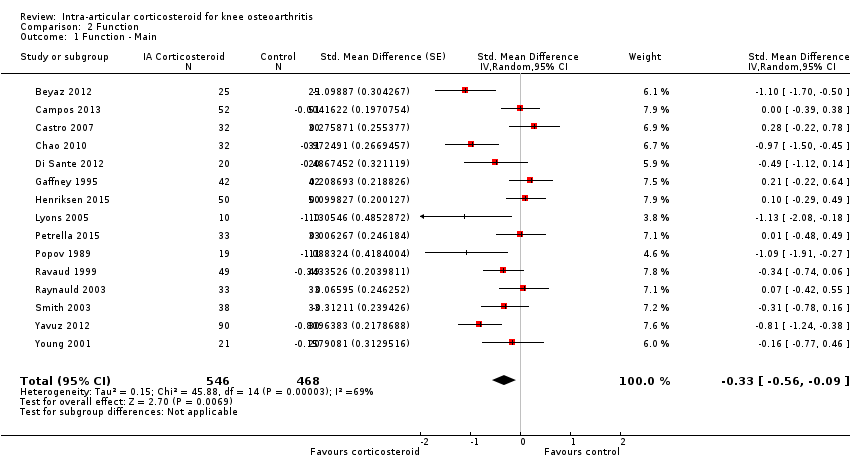
Forest plot of comparison: 2 Function, outcome: 2.1 Function ‐ Main.

Contour‐enhanced funnel plot for effects on knee function. Numbers on x axis refer to standardised mean differences (SMDs), on y axis to standard errors of SMDs
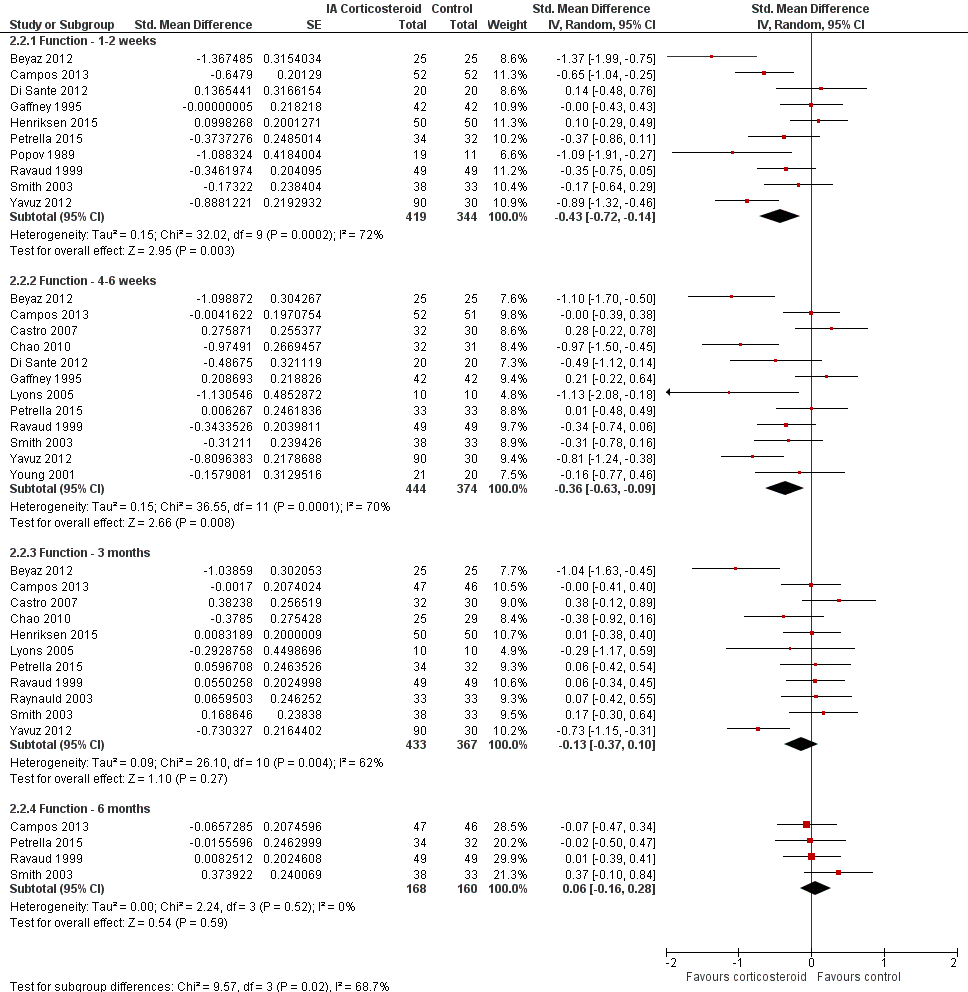
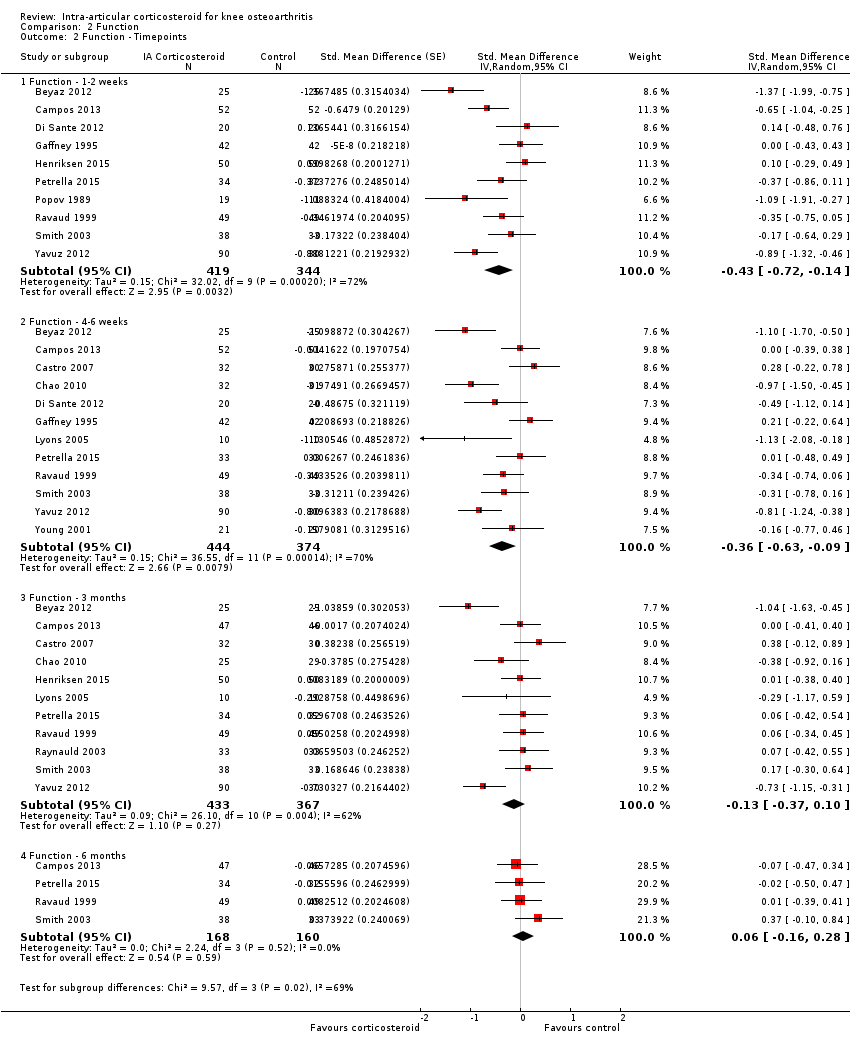
Forest plot of comparison: 2 Function, outcome: 2.2 Function ‐ Time points. P for trend = 0.011
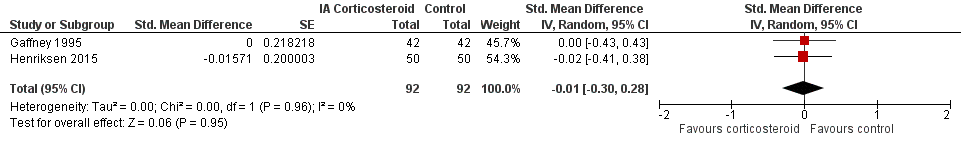
Forest plot of comparison: 3 Quality of life, outcome: 3.1 Quality of life ‐ Main.

Forest plot of comparison: 7 Joint space narrowing, outcome: 7.1 Joint space narrowing ‐ Main.

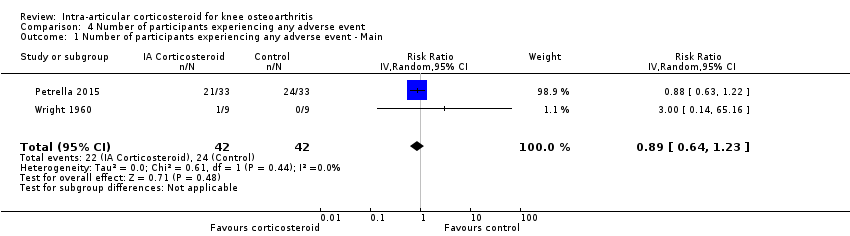
Forest plot of comparison: 4 Number of participants experiencing any adverse event, outcome: 4.1 Number of participants experiencing any adverse event ‐ Main.

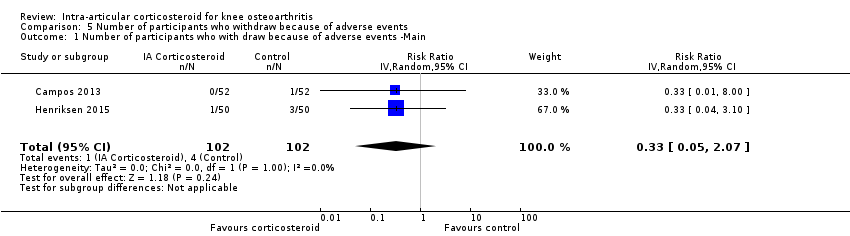
Forest plot of comparison: 5 Number of participants who withdraw because of adverse events, outcome: 5.1 Number of participants who withdraw because of adverse events ‐Main.

Forest plot of comparison: 6 Number of participants experiencing any serious adverse event, outcome: 6.1 Number of participants experiencing any serious adverse event ‐ Main.

Comparison 1 Pain, Outcome 1 Pain ‐ Main.
Comparison 1 Pain, Outcome 2 Pain ‐ Timepoints.
Comparison 2 Function, Outcome 1 Function ‐ Main.
Comparison 2 Function, Outcome 2 Function ‐ Timepoints.

Comparison 3 Quality of life, Outcome 1 Quality of life ‐ Main.
Comparison 4 Number of participants experiencing any adverse event, Outcome 1 Number of participants experiencing any adverse event ‐ Main.
Comparison 5 Number of participants who withdraw because of adverse events, Outcome 1 Number of participants who with draw because of adverse events ‐Main.
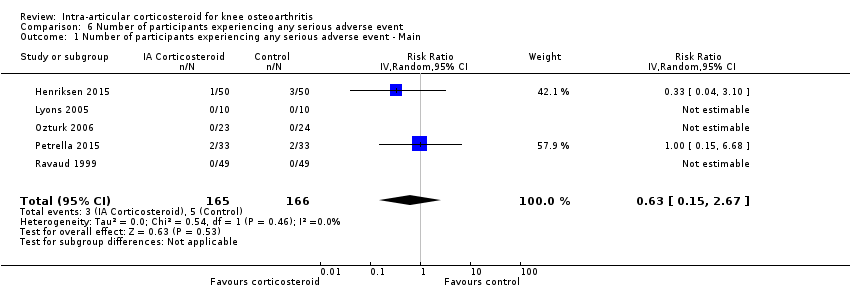
Comparison 6 Number of participants experiencing any serious adverse event, Outcome 1 Number of participants experiencing any serious adverse event ‐ Main.
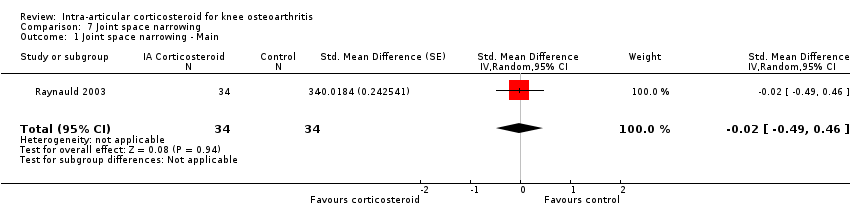
Comparison 7 Joint space narrowing, Outcome 1 Joint space narrowing ‐ Main.
| Intra‐articular corticosteroid compared with sham injection for osteoarthritis of the knee | ||||||
| Patient or population: participants with osteoarthritis of the knee Settings: various orthopaedic or rheumatology clinics Intervention: intra‐articular corticosteroid Comparison: sham injection | ||||||
| Outcomes | Illustrative comparative risks* (95% CI) | Relative effect | No of Participants | Quality of the evidence | Comments | |
| Assumed risk | Corresponding risk | |||||
| Sham injection | Intra‐articular corticosteroid | |||||
| Pain intensity Various pain scales. (median follow‐up: 12 weeks) | ‐1.8 cm change on 10‐cm VAS1 | ‐2.8 cm change 46% improvement | SMD ‐0.40 (‐0.58 to ‐0.22) Predictive interval (‐1.20 to 0.40) | 1749 (26) | ⊕⊕⊝⊝ | NNTB 8 (95% CI 6 to 13)4 |
| Function Various function scales. (median follow‐up: 12 weeks) | ‐1.2 units on WOMAC (range 0 to 10)1 | ‐1.9 units on WOMAC 34% improvement | SMD ‐0.33 (‐0.56 to ‐0.09) Predictive interval (‐1.19 to 0.54) | 1014 (15) | ⊕⊕⊝⊝ | NNTB 10 (95% CI 7 to 33)7 |
| Number of participants experiencing any adverse event (median follow‐up: 17 weeks) | 150 per 1000 participant‐years8 | 134 per 1000 participant‐years | RR 0.89 (0.64 to 1.23) | 84 (2) | ⊕⊕⊝⊝ | Little evidence of harmful effect (NNTB not statistically significant) |
| Number of participants who withdraw because of adverse events (median follow‐up: 25 weeks) | 17 per 1000 participant‐years8 | 6 per 1000 participant‐years | RR 0.33 (0.05 to 2.07) | 204 (2) | ⊕⊕⊝⊝ | Little evidence of harmful effect (NNTB not statistically significant) |
| Number of participants experiencing any serious adverse event (median follow‐up: 26 weeks) | 4 per 1000 participant‐years8 | 3 per 1000 participant‐years | RR 0.63 (0.15 to 2.67) | 331 (5) | ⊕⊕⊝⊝ | Little evidence of harmful effect (NNTB not statistically significant) |
| *The basis for the assumed risk (e.g. the median control group risk across studies) is provided in footnotes. The corresponding risk (and its 95% confidence interval) is based on the assumed risk in the comparison group and the relative effect of the intervention (and its 95% CI). | ||||||
| GRADE Working Group grades of evidence 1 Median reduction as observed across placebo groups in large osteoarthritis trials (see methods section, Nüesch 2009). 5 SMDs were back‐transformed onto a standardised Western Ontario and McMaster Universities Arthritis Index (WOMAC) disability score ranging from 0 to 10 on the basis of a typical pooled SD of 2.1 in trials that assessed function using WOMAC disability scores and expressed as change based on an assumed standardised reduction of 0.58 SD units in the control group. 9 Downgraded (2 levels) because: Most studies that reported this outcome are of high or unclear risk of bias, and statistical heterogeneity is large. 10 Downgraded (3 levels) because: 50% or more of the studies that reported this outcome are of high or unclear risk of bias, and the confidence interval of the pooled estimate is wide and includes the null effect. | ||||||
| Variable | Number of studies | N of participants corticosteroids | N of participants control | Pain intensity SMD (95% CI) | Heterogeneity I2 (%) | P value* |
| All trials | 26 | 922 | 827 | ‐0.40 (‐0.58 to ‐0.22) | 68% | |
| Allocation concealment | 0.15 | |||||
| Adequate | 2 | 88 | 83 | ‐0.16 (‐0.46 to 0.14) | 0% | |
| Inadequate or unclear | 24 | 834 | 744 | ‐0.42 (‐0.62 to ‐0.22) | 69% | |
| Blinding of participants | 0.64 | |||||
| Adequate | 6 | 220 | 218 | ‐0.34 (‐0.61 to ‐0.06) | 49% | |
| Inadequate or unclear | 20 | 702 | 609 | ‐0.42 (‐0.65 to ‐0.19) | 72% | |
| Blinding of therapists | 0.45 | |||||
| Adequate | 3 | 92 | 92 | ‐0.24 (‐0.66 to 0.17) | 44% | |
| Inadequate or unclear | 23 | 830 | 735 | ‐0.42 (‐0.62 to ‐0.22) | 70% | |
| Intention‐to‐treat analysis | 0.29 | |||||
| Yes | 9 | 236 | 233 | ‐0.26 (‐0.57 to 0.06) | 59% | |
| No or unclear | 17 | 686 | 594 | ‐0.47 (‐0.69 to ‐0.24) | 71% | |
| Type of control intervention | 0.08 | |||||
| Sham injection | 19 | 614 | 526 | ‐0.50 (‐0.72 to ‐0.28) | 65% | |
| No intervention | 7 | 284 | 280 | ‐0.18 (‐0.47 to 0.11) | 63% | |
| Funding independent of industry | 0.80 | |||||
| Yes | 11 | 341 | 333 | ‐0.37 (‐0.55 to ‐0.18) | 26% | |
| No or unclear | 15 | 581 | 494 | ‐0.41 (‐0.70 to ‐0.12) | 78% | |
| Trial size | 0.05 | |||||
| ≥ 50 per trial group | 3 | 205 | 204 | ‐0.13 (‐0.37 to 0.12) | 34% | |
| < 50 per trial group | 23 | 717 | 623 | ‐0.44 (‐0.65 to ‐0.24) | 67% | |
| Trial size | 0.013 | |||||
| ≥ 100 per trial group | 1 | 103 | 103 | 0.00 (‐0.27 to 0.27) | N/A | |
| < 100 per trial group | 25 | 819 | 724 | ‐0.42 (‐0.61 to ‐0.23) | 66% | |
| Publication type | 0.93 | |||||
| Full journal article | 22 | 785 | 706 | ‐0.40 (‐0.61 to ‐0.20) | 70% | |
| Other type or unpublished material | 4 | 137 | 121 | ‐0.38 (‐0.84 to ‐0.08) | 65% | |
| Ultrasound guidance of injections | 0.71 | |||||
| Yes | 2 | 70 | 70 | ‐0.62 (‐1.83 to 0.58) | 89% | |
| No or unclear | 24 | 852 | 757 | ‐0.39 (‐0.57 to ‐0.20) | 67% | |
| Use of local anaesthetic | 0.41 | |||||
| Yes | 5 | 172 | 157 | ‐0.55 (‐0.93 to ‐0.16) | 62% | |
| No or unclear | 21 | 750 | 670 | ‐0.36 (‐0.57 to ‐0.15) | 70% | |
| Concomitant viscosupplementation | 0.08 | |||||
| Yes | 4 | 129 | 127 | ‐0.16 (‐0.42 to 0.09) | 4% | |
| No or unclear | 22 | 793 | 700 | ‐0.46 (‐0.67 to ‐0.25) | 71% | |
| Concomitant joint lavage | ≤ 0.001 | |||||
| Yes | 4 | 197 | 187 | ‐0.06 (‐0.26 to 0.15) | 0% | |
| No or unclear | 26 | 725 | 640 | ‐0.57 (‐0.78 to ‐0.35) | 72% | |
| Use of crystalline preparation | 0.82 | |||||
| Yes | 18 | 623 | 562 | ‐0.47 (‐0.69 to ‐0.24) | 72% | |
| No or unclear | 12 | 299 | 265 | ‐0.52 (‐0.90 to ‐0.14) | 76% | |
| Prednisolone equivalence dose | 0.53 | |||||
| ≥ 50 mg | 17 | 520 | 470 | ‐0.55 (‐0.85 to ‐0.25) | 80% | |
| < 50 mg | 13 | 402 | 357 | ‐0.43 (‐0.66 to ‐0.20) | 56% | |
| Number of randomised comparisons are shown in "number of studies" for stratified analyses according to use of lavage as co‐intervention, crystalline preparation, prednisolone equivalence. *P value for interaction. N/A: not available. CI: confidence interval | ||||||
| Variable | Number of studies | N of participants corticosteroids | N of participants control | Function SMD (95% CI) | Heterogeneity I2 (%) | P value* |
| All trials | 15 | 546 | 468 | ‐0.33 (‐0.56 to ‐0.09) | 69% | |
| Allocation concealment | 0.25 | |||||
| Adequate | 2 | 88 | 83 | ‐0.09 (‐0.49 to 0.32) | 43% | |
| Inadequate or unclear | 13 | 458 | 385 | ‐0.37 (‐0.64 to ‐0.10) | 72% | |
| Blinding of participants | 0.97 | |||||
| Adequate | 5 | 201 | 199 | ‐0.32 (‐0.82 to 0.18) | 83% | |
| Inadequate or unclear | 10 | 345 | 269 | ‐0.33 (‐0.59 to ‐0.07) | 58% | |
| Blinding of therapists | 0.78 | |||||
| Adequate | 2 | 75 | 75 | ‐0.48 (‐1.65 to 0.70) | 91% | |
| Inadequate or unclear | 13 | 471 | 393 | ‐0.31 (‐0.55 to ‐0.06) | 66% | |
| Intention‐to‐treat analysis | 0.49 | |||||
| Yes | 5 | 161 | 159 | ‐0.21 (‐0.59 to 0.17) | 62% | |
| No or unclear | 10 | 385 | 309 | ‐0.38 (‐0.69 to ‐0.07) | 73% | |
| Type of control intervention | 0.031 | |||||
| Sham injection | 11 | 409 | 334 | ‐0.45 (‐0.74 to ‐0.15) | 73% | |
| No intervention | 4 | 137 | 134 | ‐0.01 (‐0.27 to 0.25) | 13% | |
| Funding independent of industry | 0.73 | |||||
| Yes | 9 | 310 | 302 | ‐0.36 (‐0.66 to ‐0.07) | 68% | |
| No or unclear | 6 | 236 | 166 | ‐0.27 (‐0.71 to 0.16) | 76% | |
| Trial size | 0.023 | |||||
| ≥ 50 per trial group | 2 | 102 | 101 | 0.05 (‐0.23 to 0.32) | 0% | |
| < 50 per trial group | 13 | 444 | 367 | ‐0.40 (‐0.67 to ‐0.13) | 70% | |
| Trial size | N/A | |||||
| ≥ 100 per trial group | 0 | 0 | 0 | N/A | N/A | |
| < 100 per trial group | 15 | 546 | 468 | ‐0.33 (‐0.56 to ‐0.09) | 69% | |
| Publication type | 0.023 | |||||
| Full journal article | 14 | 514 | 438 | ‐0.37 (‐0.61 to ‐0.13) | 68% | |
| Other type or unpublished material | 1 | 32 | 30 | 0.28 (‐0.22 to 0.78) | N/A | |
| Ultrasound guidance of injections | 0.49 | |||||
| Yes | 2 | 70 | 70 | ‐0.14 (‐0.70 to 0.43) | 58% | |
| No or unclear | 13 | 476 | 398 | ‐0.36 (‐0.62 to ‐0.09) | 71% | |
| Use of local anaesthetic | 0.34 | |||||
| Yes | 4 | 105 | 105 | ‐0.60 (‐1.25 to 0.05) | 78% | |
| No or unclear | 11 | 441 | 363 | ‐0.25 (‐0.51 to 0.00) | 68% | |
| Concomitant viscosupplementation | 0.06 | |||||
| Yes | 2 | 85 | 84 | ‐0.00 (‐0.30 to 0.30) | 0% | |
| No or unclear | 13 | 461 | 384 | ‐0.39 (‐0.66 to ‐0.12) | 72% | |
| Concomitant joint lavage | 0.18 | |||||
| Yes | 3 | 94 | 84 | ‐0.13 (‐0.55 to 0.28) | 48% | |
| No or unclear | 16 | 452 | 384 | ‐0.46 (‐0.71 to ‐0.21) | 70% | |
| Use of crystalline preparation | 0.66 | |||||
| Yes | 12 | 365 | 319 | ‐0.37 (‐0.66 to ‐0.08) | 73% | |
| No or unclear | 7 | 181 | 149 | ‐0.47 (‐0.83 to ‐0.11) | 61% | |
| Prednisolone equivalence dose | 0.16 | |||||
| ≥ 50 mg | 12 | 328 | 277 | ‐0.52 (‐0.83 to ‐0.20) | 74% | |
| < 50 mg | 7 | 218 | 191 | ‐0.22 (‐0.48 to 0.05) | 47% | |
| Number of randomised comparisons are shown in "number of studies" for stratified analyses according to use of lavage as co‐intervention, crystalline preparation, prednisolone equivalence. *P value for interaction. N/A: not available. CI: confidence interval | ||||||
| Outcome or subgroup title | No. of studies | No. of participants | Statistical method | Effect size |
| 1 Pain ‐ Main Show forest plot | 26 | 1749 | Std. Mean Difference (Random, 95% CI) | ‐0.40 [‐0.58, ‐0.22] |
| 2 Pain ‐ Timepoints Show forest plot | 26 | Std. Mean Difference (Random, 95% CI) | Subtotals only | |
| 2.1 Pain‐ 1‐2 week | 16 | 1041 | Std. Mean Difference (Random, 95% CI) | ‐0.48 [‐0.70, ‐0.27] |
| 2.2 Pain‐ 4‐6 week | 22 | 1529 | Std. Mean Difference (Random, 95% CI) | ‐0.41 [‐0.61, ‐0.21] |
| 2.3 Pain‐ 3 months | 18 | 1233 | Std. Mean Difference (Random, 95% CI) | ‐0.22 [‐0.44, 0.00] |
| 2.4 Pain‐ 6 months | 7 | 526 | Std. Mean Difference (Random, 95% CI) | ‐0.07 [‐0.25, 0.11] |
| Outcome or subgroup title | No. of studies | No. of participants | Statistical method | Effect size |
| 1 Function ‐ Main Show forest plot | 15 | 1014 | Std. Mean Difference (Random, 95% CI) | ‐0.33 [‐0.56, ‐0.09] |
| 2 Function ‐ Timepoints Show forest plot | 15 | Std. Mean Difference (Random, 95% CI) | Subtotals only | |
| 2.1 Function ‐ 1‐2 weeks | 10 | 763 | Std. Mean Difference (Random, 95% CI) | ‐0.43 [‐0.72, ‐0.14] |
| 2.2 Function ‐ 4‐6 weeks | 12 | 818 | Std. Mean Difference (Random, 95% CI) | ‐0.36 [‐0.63, ‐0.09] |
| 2.3 Function ‐ 3 months | 11 | 800 | Std. Mean Difference (Random, 95% CI) | ‐0.13 [‐0.37, 0.10] |
| 2.4 Function ‐ 6 months | 4 | 328 | Std. Mean Difference (Random, 95% CI) | 0.06 [‐0.16, 0.28] |
| Outcome or subgroup title | No. of studies | No. of participants | Statistical method | Effect size |
| 1 Quality of life ‐ Main Show forest plot | 2 | 184 | Std. Mean Difference (Random, 95% CI) | ‐0.01 [‐0.30, 0.28] |
| Outcome or subgroup title | No. of studies | No. of participants | Statistical method | Effect size |
| 1 Number of participants experiencing any adverse event ‐ Main Show forest plot | 2 | 84 | Risk Ratio (IV, Random, 95% CI) | 0.89 [0.64, 1.23] |
| Outcome or subgroup title | No. of studies | No. of participants | Statistical method | Effect size |
| 1 Number of participants who with draw because of adverse events ‐Main Show forest plot | 2 | 204 | Risk Ratio (IV, Random, 95% CI) | 0.33 [0.05, 2.07] |
| Outcome or subgroup title | No. of studies | No. of participants | Statistical method | Effect size |
| 1 Number of participants experiencing any serious adverse event ‐ Main Show forest plot | 5 | 331 | Risk Ratio (IV, Random, 95% CI) | 0.63 [0.15, 2.67] |
| Outcome or subgroup title | No. of studies | No. of participants | Statistical method | Effect size |
| 1 Joint space narrowing ‐ Main Show forest plot | 1 | 68 | Std. Mean Difference (Random, 95% CI) | ‐0.02 [‐0.49, 0.46] |