| Intra‐articular corticosteroid compared with sham injection for osteoarthritis of the knee |
| Patient or population: participants with osteoarthritis of the knee Settings: various orthopaedic or rheumatology clinics Intervention: intra‐articular corticosteroid Comparison: sham injection |
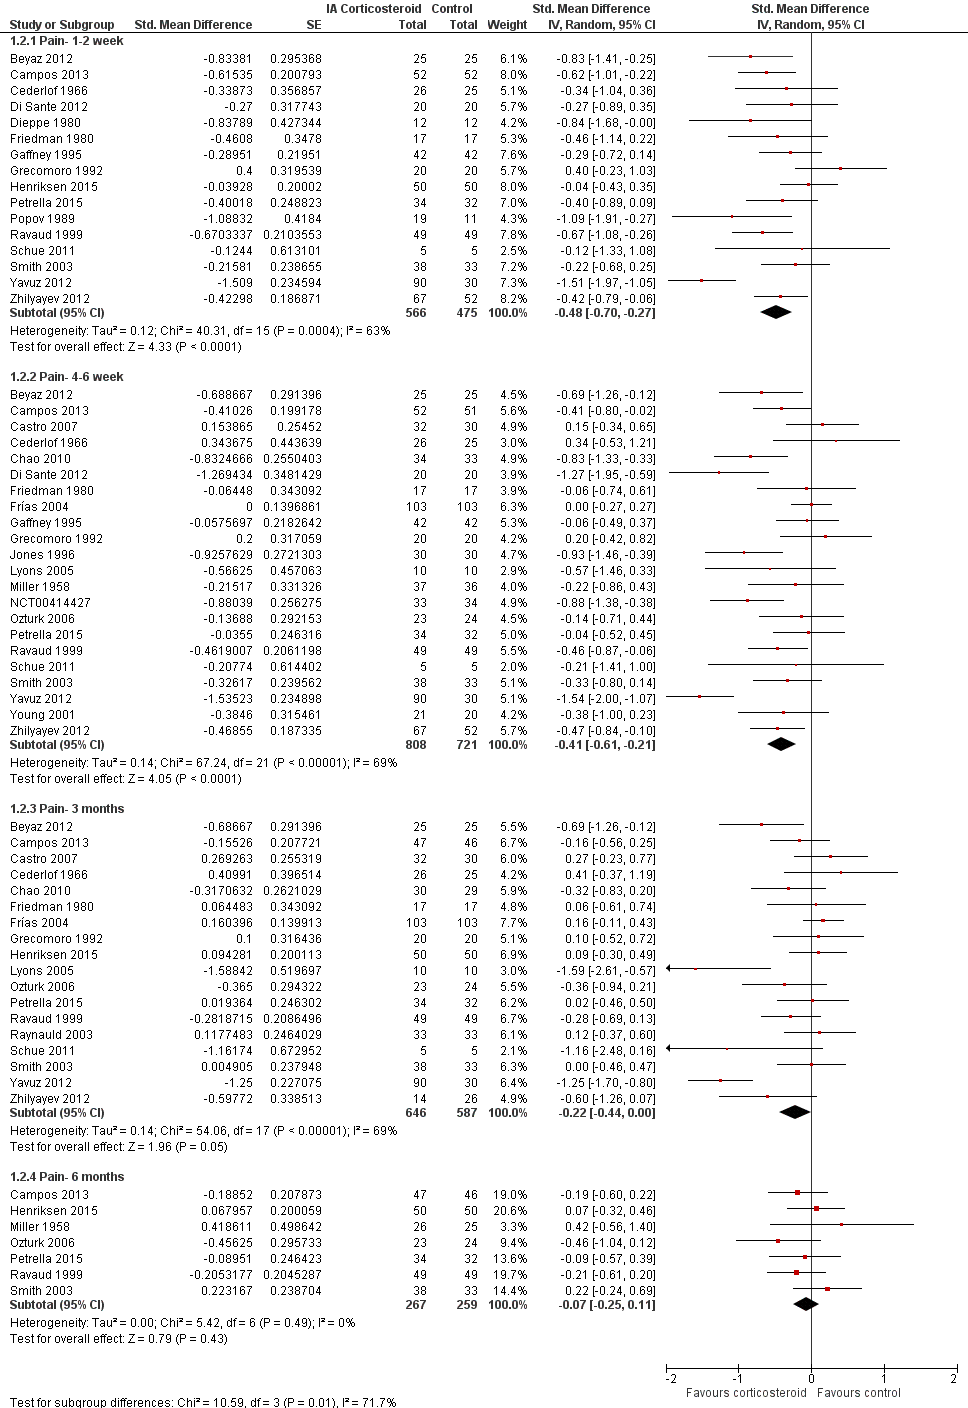
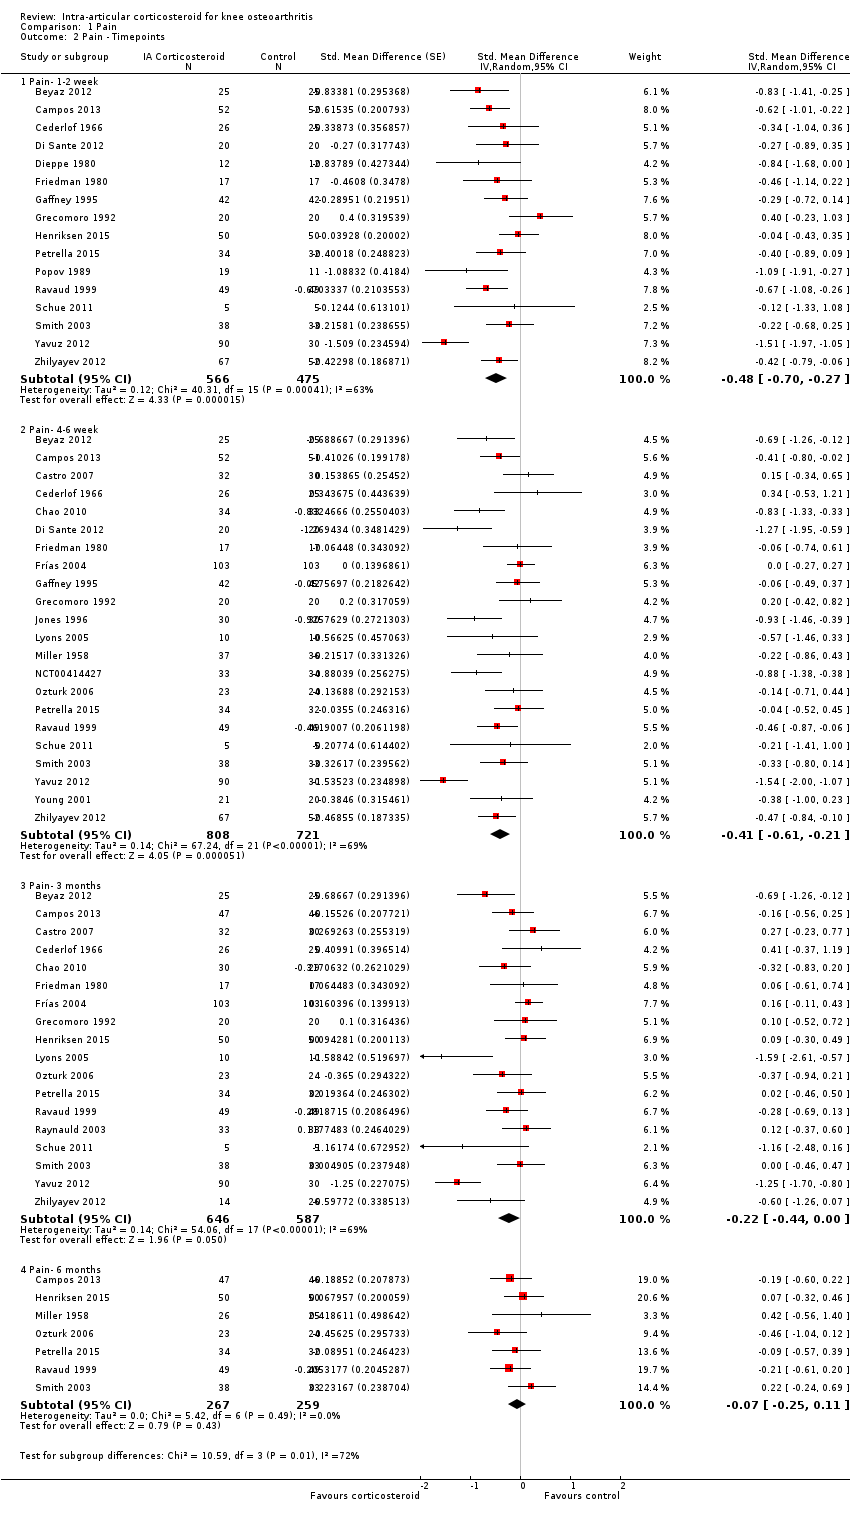
| Pain intensity Various pain scales. (median follow‐up: 12 weeks) | ‐1.8 cm change on 10‐cm VAS1
29% improvement | ‐2.8 cm change
(Δ ‐1.0 cm, ‐1.5 to ‐0.6)2 46% improvement
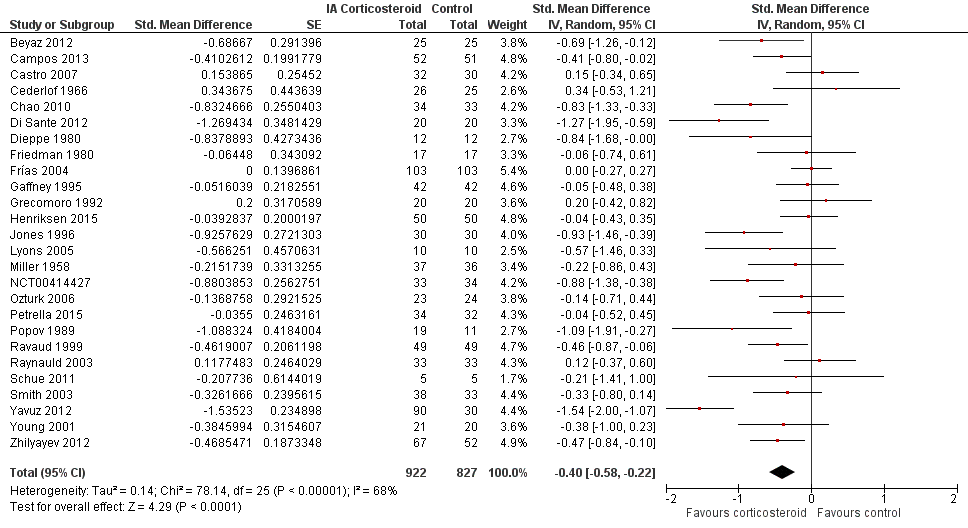
(Δ 17%, 10% to 25%)3 | SMD ‐0.40 (‐0.58 to ‐0.22) Predictive interval (‐1.20 to 0.40) | 1749 (26) | ⊕⊕⊝⊝
low9 | NNTB 8 (95% CI 6 to 13)4 |
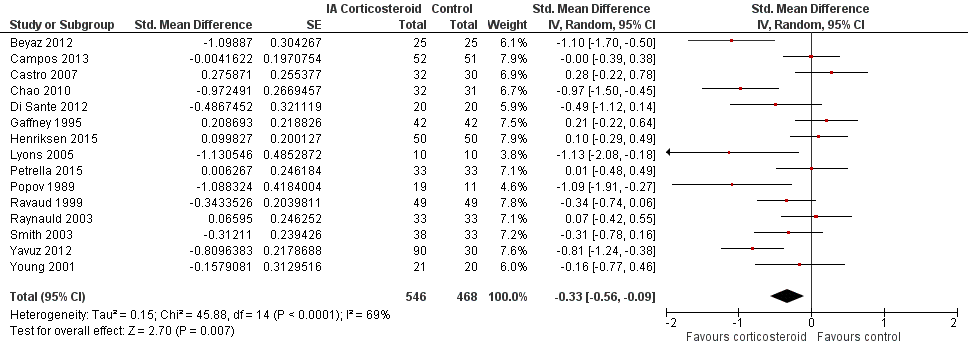
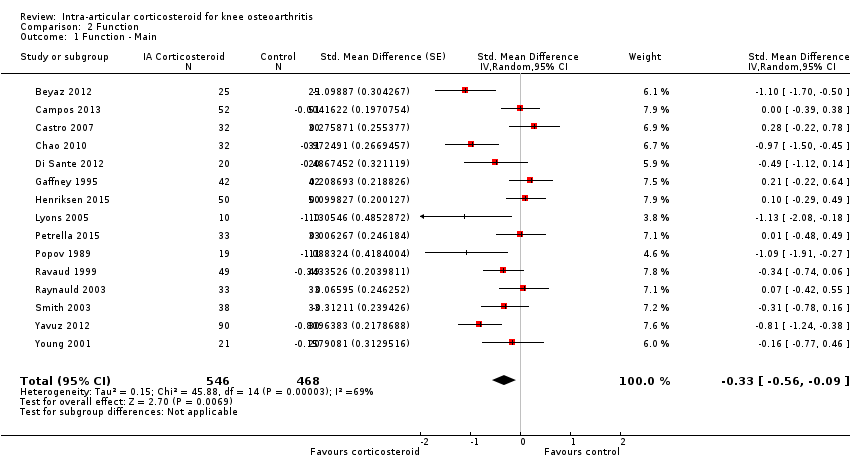
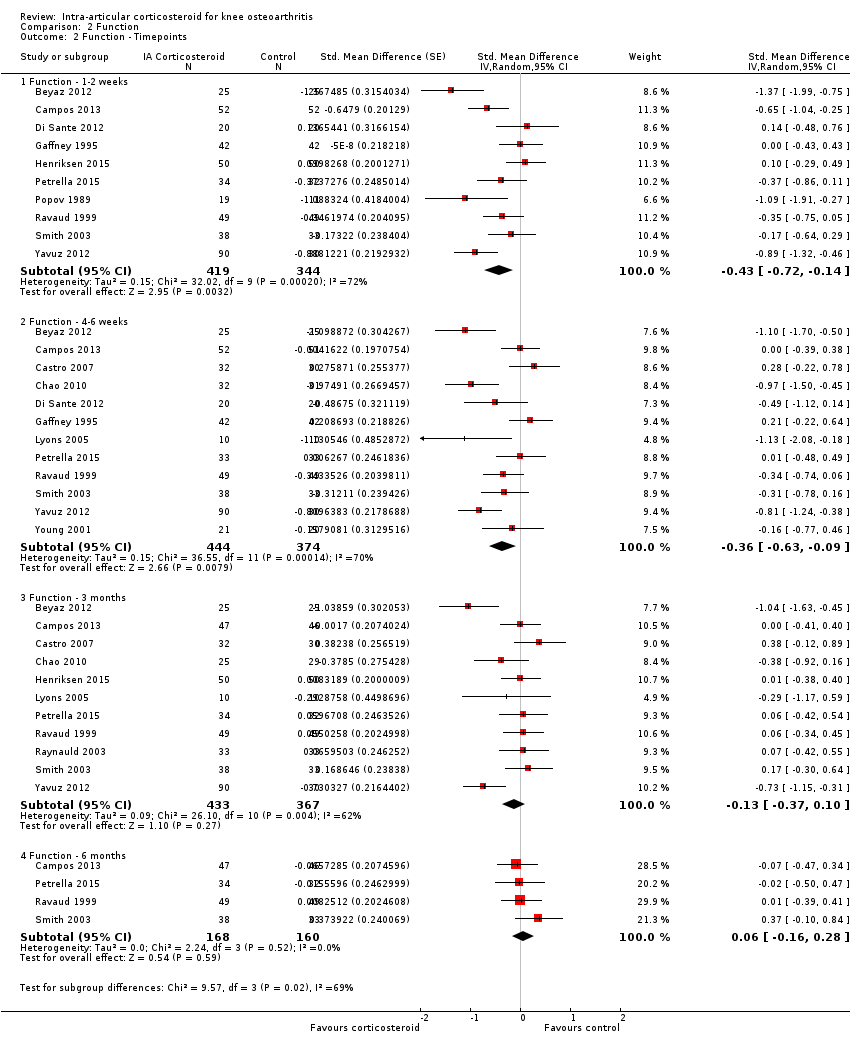
| Function Various function scales. (median follow‐up: 12 weeks) | ‐1.2 units on WOMAC (range 0 to 10)1
21% improvement | ‐1.9 units on WOMAC
(Δ ‐0.7, ‐1.2 to ‐0.2)5 34% improvement
(Δ 13%, 4% to 22%)6 | SMD ‐0.33 (‐0.56 to ‐0.09) Predictive interval (‐1.19 to 0.54) | 1014 (15) | ⊕⊕⊝⊝
low9 | NNTB 10 (95% CI 7 to 33)7 |
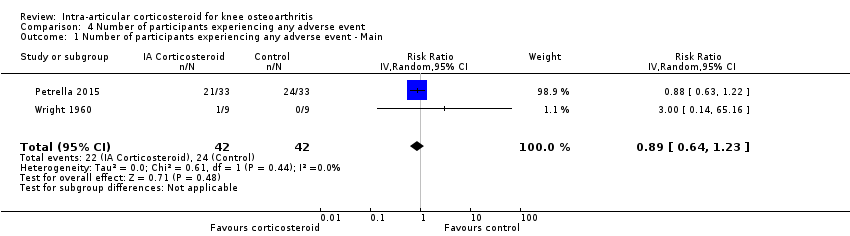
| Number of participants experiencing any adverse event (median follow‐up: 17 weeks) | 150 per 1000 participant‐years8 | 134 per 1000 participant‐years
(96 to 185) | RR 0.89 (0.64 to 1.23) | 84 (2) | ⊕⊕⊝⊝
low10 | Little evidence of harmful effect (NNTB not statistically significant) |
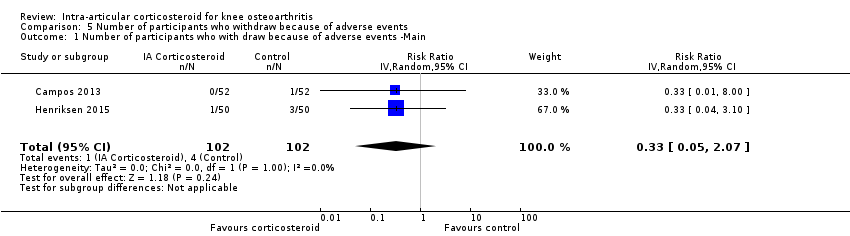
| Number of participants who withdraw because of adverse events (median follow‐up: 25 weeks) | 17 per 1000 participant‐years8 | 6 per 1000 participant‐years
(1 to 35) | RR 0.33 (0.05 to 2.07) | 204 (2) | ⊕⊕⊝⊝
low10 | Little evidence of harmful effect (NNTB not statistically significant) |
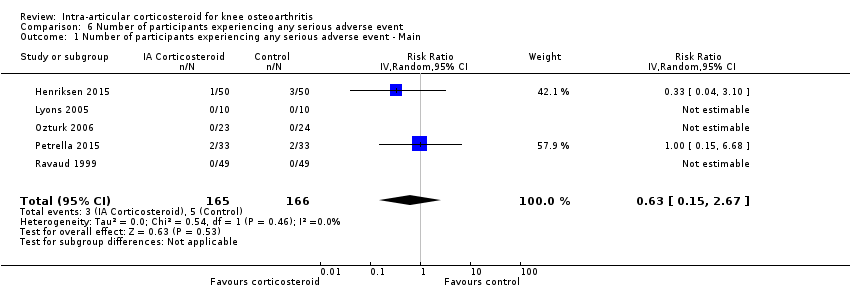
| Number of participants experiencing any serious adverse event (median follow‐up: 26 weeks) | 4 per 1000 participant‐years8 | 3 per 1000 participant‐years
(1 to 11) | RR 0.63 (0.15 to 2.67) | 331 (5) | ⊕⊕⊝⊝
low10 | Little evidence of harmful effect (NNTB not statistically significant) |
| *The basis for the assumed risk (e.g. the median control group risk across studies) is provided in footnotes. The corresponding risk (and its 95% confidence interval) is based on the assumed risk in the comparison group and the relative effect of the intervention (and its 95% CI).
CI: confidence interval; NNTB: number needed to treat for an additional beneficial outcome; RR: risk ratio; SMD: standardised mean difference; VAS: visual analogue scale; WOMAC: Western Ontario and McMaster Universities Arthritis Index |
| GRADE Working Group grades of evidence
High quality: Further research is very unlikely to change our confidence in the estimate of effect.
Moderate quality: Further research is likely to have an important impact on our confidence in the estimate of effect and may change the estimate.
Low quality: Further research is very likely to have an important impact on our confidence in the estimate of effect and is likely to change the estimate.
Very low quality: We are very uncertain about the estimate. 1 Median reduction as observed across placebo groups in large osteoarthritis trials (see methods section, Nüesch 2009).
2 SMDs were back‐transformed onto a 10‐cm visual analogue scale (VAS) on the basis of a typical pooled standard deviation (SD) of 2.5 cm in large trials that assessed pain using a VAS and expressed as change based on an assumed standardised reduction of 0.72 SD units in the control group.
3 Percentage of improvement was calculated based on median observed pain at baseline across control groups of large osteoarthritis trials of 6.1 cm on 10‐cm VAS (Nüesch 2009).
4 Absolute response risks for pain in the control groups were assumed 31% (see methods section). 5 SMDs were back‐transformed onto a standardised Western Ontario and McMaster Universities Arthritis Index (WOMAC) disability score ranging from 0 to 10 on the basis of a typical pooled SD of 2.1 in trials that assessed function using WOMAC disability scores and expressed as change based on an assumed standardised reduction of 0.58 SD units in the control group.
6 Percentage of improvement was calculated based on median observed WOMAC function scores at baseline across control groups of large osteoarthritis trials of 5.6 units (Nüesch 2009).
7 Absolute response risks for function in the control groups were assumed 26% (see methods section).
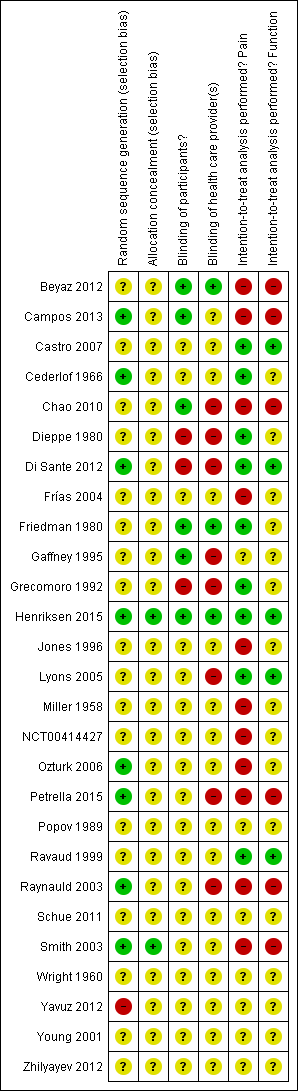
8 Median control risk across placebo groups in large osteoarthritis trials (see methods section, Nüesch 2009). 9 Downgraded (2 levels) because: Most studies that reported this outcome are of high or unclear risk of bias, and statistical heterogeneity is large. 10 Downgraded (3 levels) because: 50% or more of the studies that reported this outcome are of high or unclear risk of bias, and the confidence interval of the pooled estimate is wide and includes the null effect. |