| Study ID | BMD | BMC | Incident fractures | Vertebral Morph |
| Henderson 2002 | Between‐Groups Comparisons
Distal femur (region 1) BMD raw score percent change from baseline to end of study was significantly different between treatment and placebo groups, P=0.01. Upon reanalysis, the P‐value was found to be essentially unchanged.
Distal femur (region 1) BMD mean Z‐score change from baseline to end of study was significantly different between treatment and placebo groups, P=0.01. For the distal portion of the femoral diaphysis (region 3), the authors report that the difference between the placebo group and the bisphosphonate group is not statistically significant (P=0.1). Upon reanalysis, the P‐value remained non‐significant (P=0.2). For the transition region between regions 1 and 3 (region 2), the authors report a statistically significant difference between the placebo group and the bisphosphonate group (P=0.01). Upon reanalysis, the P‐value remained significant although it was slightly larger (P=0.02).
LS BMD raw score percent change from baseline to end of study was significantly different between treatment and placebo groups, P=0.01. This was no longer significant when an appropriate (paired) analysis is used (P=0.08).
LS BMD mean Z‐score change from baseline to end of study was not significant between treatment and placebo groups, P=0.06
Within‐Groups Comparisons:
Distal femur (region 1) BMD raw score increased 89 +/‐ 21%; P=0.009 from baseline to end of study in treatment group compared with 9 +/‐ 6%; P=0.2 in placebo group
Distal femur (region 1) BMD mean Z‐score changed 2.1 +/‐ 0.6; P=0.01 from baseline to end of study in the treatment group and did not significantly change in the placebo group, 0.2 +/‐ 0.2; P=0.6
LS BMD raw score increased 33 +/‐ 3 %; P=0.0004 from baseline to end of study in the treatment group and increased 15 +/‐ 5 %; P=0.03 in the placebo group
LS BMD mean Z‐Score change from baseline to end of study increased 1.2 +/‐ 0.2; P=0.005 and 0.4 +/‐ 0.3; P=0.2 in the placebo group | N/A | 3/6 control and 0/6 treatment | N/A |
| El‐Husseini 2004 | Between‐Groups Comparisons: A statistical test comparing the mean change in LS BMD T‐score between the control and alendronate groups was calculated (P<0.001 favoring the alendronate group).
Within‐Groups Comparisons:
L1‐4 BMD T‐score: Group 1 (control) had a significantly lower L2‐4 BMD at the end of treatment than other 3 groups (P < 0.001 ), group 3 (alendronate) had increased L2‐4 aBMD t‐score from pre‐ to post‐treatment (‐2.3 +/‐ 2.1 to ‐1.9 +/‐ 1.8) however, group 2 (alfacalcidol) had the greatest improvement in aBMD t‐score ( ‐2.3 +/‐ 2.1 to ‐0.5 +/‐0.7) pre‐ to post‐treatment. TB BMD t‐score: Group 1 (control) had a significantly lower TB BMD at the end of treatment than other 3 groups (P < 0.001 ), group 3 (alendronate) had increased TB BMD t‐score from pre‐ to post‐treatment (‐1.4 +/‐ 1.4 to ‐0.9 +/‐ 0.7) however, group 2 (alfacalcidol) had the greatest improvement in BMD t‐score ( ‐1.3 +/‐ 1.2 to +0.3 +/‐0.2) pre‐ to post‐treatment | Between‐Groups Comparisons:
No significant differences pre‐ and post‐ treatment in total body BMC (g) (exact P‐value not reported however) | 1/15 control and 0/16 treatment | NA |
| Rudge 2005 | Between‐Groups Comparisons: A between‐groups statistical test comparing the mean change in areal bone mineral density Z‐score was calculated and a non‐significant difference was found (P=0.16).
Within‐Groups Comparisons:
Lumbar spine BMC absolute value change (g) significantly increased in treatment group (P=0.012), compared to the placebo group (P=0.062). | Between‐Groups Comparisons:
Not reported
Within‐Groups Comparisons:
Lumbar spine BMC absolute value change (g) significantly increased in treatment group (P=0.012), compared to the placebo group (P=0.062) | 1/11 control and 0/11 treatment | NA |
| Acott 2005 | Between‐Groups Comparisons: aBMD Z‐score increased significantly relative to baseline [treatment vs control: at 6 months (0.27+/‐0.14 vs ‐0.82 +/‐0.31), 12 months (0.63+/‐ 0.17 vs 0.17 +/‐ 0.27), 18 months (0.55 +/‐ 0.32 vs 0.17 +/‐ 0.27), 24 months (0.15 +/‐ 0.21 vs ‐0.23) +/‐ 0.22, 36 months (0.77 +/‐ 0.71 vs ‐0.68 +/‐ 0.25) with repeated measures ANOVA (P=0.0057). | N/A | 0/17 control and 1/17 treatment | N/A |
| Lepore 1991 | Between‐Groups Comparisons:
Not reported
Within‐Groups Comparisons:
D12, L1‐3 lumbar spine BMD: 8% increase in treatment group and 7% decrease in control group, at 12 months compared with baseline (statistical significance not stated) | N/A | N/A | N/A |
| Bianchi 2000 | Between‐Groups Comparisons:
Not reported
Within‐Groups Comparisons: L2‐4 aBMD (g/cm2) percent change significantly increased in treatment group from baseline to 12 months (14.9+/‐ 9.8%; P<0.002) while the BMD was 2.6 +/‐ 5%; control group when compared with baseline (not a statistically significant difference). | NA | Control not reported, 0/38 treatment | N/A |
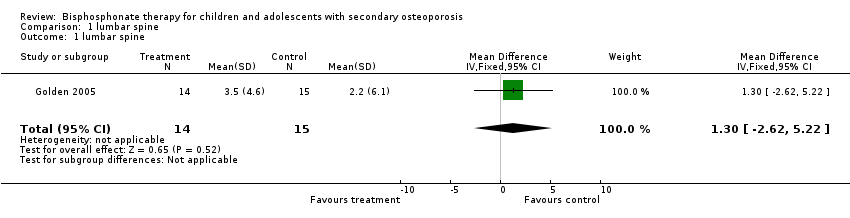
| Golden 2005 | Between‐Group Comparisons:
L1‐4 aBMD (g/cm2) % change: Increased 3.5 +/‐ 4.6 % in treatment group compared with 2.2 +/‐ 6.1% in the placebo group, P=0.53 (not significant between groups)
Femoral neck aBMD (g/cm2) % change: Increased 4.4 +/‐ 6.4 % in treatment group and 2.3 +/‐ 6.9% in the placebo group, P=0.41 (not significant between groups)
Femoral neck vBMD (g/cm3) from baseline to follow‐up of the femoral neck was significantly higher in alendronate group compared to the placebo group (0.184+/‐0.005 vs. 0.151 +/‐0.003; P=0.004)
Femoral neck vBMD (g/cm3) absolute change was significantly greater in those receiving alendronate (P<0.05).
Within‐Group Comparisons:
L1‐4 aBMD (g/cm2) increased significantly from baseline to follow‐up in the treatment group (P=0.02) and non‐significantly from baseline to follow‐up in the control group (P=0.18)
Femoral neck BMD (g/cm2) increased significantly from baseline to follow‐up in the treatment group (P=0.02) and non‐significantly from baseline to follow‐up in the control group (P=0.22). | Between‐Group Comparisons:
No significant differences in absolute value of BMC of the lumbar spine between the treatment and placebo groups | 1/15 control, 2/14 treatment | N/A |
| Klein 2005 | N/A | Between‐Groups Comparisons:
At time of discharge from hospital (˜2 months), LS BMC percent change from baseline was significant (P<0.005) between the treatment and placebo groups, however TB BMC was not statistically different between the two groups
Significant increase in TB BMC percent change and LS BMC percent change from baseline to 6‐month follow‐up between treatment group and placebo (P<0.005)
(Exact percentages not reported) | N/A | N/A |
| Kim 2006 | Between‐Groups Comparisons:
Not reported
Within‐Groups Comparisons:
LS BMD decreased significantly from 0.654+/‐0.069 (g/cm2) to 0.631+/‐0.070 (g/cm2) in the control group (P=0.0017). LS BMD was not reduced in the control group from 0.644+/‐0.189 (g/cm2) to 0.647+/‐0.214 (g/cm2) (P‐value not reported). | N/A | N/A | N/A |