Tratamiento de la enfermedad periodontal para la prevención de resultados adversos durante el parto en embarazadas
Información
- DOI:
- https://doi.org/10.1002/14651858.CD005297.pub3Copiar DOI

- Base de datos:
-
- Cochrane Database of Systematic Reviews
- Versión publicada:
-
- 12 junio 2017see what's new
- Tipo:
-
- Intervention
- Etapa:
-
- Review
- Grupo Editorial Cochrane:
-
Grupo Cochrane de Salud oral
- Copyright:
-
- Copyright © 2017 The Cochrane Collaboration. Published by John Wiley & Sons, Ltd.
Cifras del artículo
Altmetric:
Citado por:
Autores
Contributions of authors
All authors contributed to all aspects of this review.
Sources of support
Internal sources
-
Department of Obstetrics and Gynaecology, The University of Adelaide, Australia.
-
Australian Department of Health and Ageing, Australia.
-
The Sahlgrenska Academy at Göteborg University, Sweden.
-
The University of Manchester, Manchester Academic Health Sciences Centre (MAHSC), NIHR Manchester Biomedical Research Centre, UK.
External sources
-
Swedish Medical Research Council (9495), Sweden.
-
National Institute for Health Research (NIHR), UK.
This project was supported by the NIHR, via Cochrane Infrastructure funding to Cochrane Oral Health. The views and opinions expressed herein are those of the review authors and do not necessarily reflect those of the Systematic Reviews Programme, the NIHR, the NHS or the Department of Health.
-
Cochrane Oral Health Global Alliance, Other.
The production of Cochrane Oral Health reviews has been supported financially by our Global Alliance since 2011 (oralhealth.cochrane.org/partnerships‐alliances). Contributors over the past year have been the American Association of Public Health Dentistry, USA; the British Association for the Study of Community Dentistry, UK; the British Society of Paediatric Dentistry, UK; the Canadian Dental Hygienists Association, Canada; the Centre for Dental Education and Research at All India Institute of Medical Sciences, India; the National Center for Dental Hygiene Research & Practice, USA; New York University College of Dentistry, USA; and NHS Education for Scotland, UK.
Declarations of interest
Zipporah Iheozor‐Ejiofor: no interests to declare. Zipporah is an Editor with Cochrane Oral Health.
Philippa Middleton: no interests to declare.
Marco Esposito: no interests to declare. Marco is an Editor with Cochrane Oral Health.
Anne‐Marie Glenny: no interests to declare. Anne‐Marie is Deputy Co‐ordinating Editor of Cochrane Oral Health.
Acknowledgements
The review authors would like to thank all members of the Cochrane Oral Health editorial base for their assistance. The authors would also like to thank Natalie Thomas and Caroline Crowther for their contributions to earlier versions of the protocol for this review, and the following referees for their comments: Dr Alison Cooke, Dr Mia Geisinger, and Professor Juan Blanco Carrion.
Version history
| Published | Title | Stage | Authors | Version |
| 2017 Jun 12 | Treating periodontal disease for preventing adverse birth outcomes in pregnant women | Review | Zipporah Iheozor‐Ejiofor, Philippa Middleton, Marco Esposito, Anne‐Marie Glenny | |
| 2015 Dec 23 | Treating periodontal disease for preventing adverse birth outcomes in pregnant women | Protocol | Philippa Middleton, Marco Esposito, Zipporah Iheozor‐Ejiofor | |
| 2005 Apr 20 | Treating periodontal disease for preventing preterm birth in pregnant women | Protocol | Caroline A Crowther, Natalie Thomas, Philippa Middleton, Mei‐Chien Chua, Marco Esposito | |
Differences between protocol and review
Adverse effects of the therapy were previously considered a secondary outcome, however, due to their importance they were eventually listed as a primary outcome.
We planned to report different measures of gestational age and birth weight. Mean gestational age (weeks) and mean birth weight (grams/kilograms) were reported, however, the rarity of the outcomes and skewness of data precluded our pooling these data. We did not present these outcomes in the 'Summary of findings' tables.
We were unable to carry out any of the planned subgroup analyses due to insufficient data.
At protocol stage we stated our intention to generate 'Summary of findings' tables for each comparison. We decided to generate a 'Summary of findings' table for the main comparison alone (periodontal treatment versus no treatment).
We planned to report preterm birth < 34 weeks and < 28 weeks. Eventually we used the cut‐offs that were reported in the included studies (preterm birth < 35 and < 32 weeks).
Following editorial comments, we changed the 'Types of interventions' section to: "Treatment during pregnancy for periodontal disease, performed by a dentist, dental hygienist or therapist (including mechanical debridement using scaling and root planing, polishing, or surgery), either singly or in combination with counselling on oral hygiene, antiseptic oral agents, topical or systemic antimicrobial therapies compared with either placebo (for adjunctive treatment), no treatment or alternative treatments."
Keywords
MeSH
Medical Subject Headings (MeSH) Keywords
- Gingivitis [*therapy];
- Infant, Low Birth Weight;
- Infant, Small for Gestational Age;
- Perinatal Mortality;
- Periodontal Diseases [*therapy];
- Pre‐Eclampsia [epidemiology];
- Pregnancy Complications [*therapy];
- Pregnancy Outcome;
- Premature Birth [epidemiology, prevention & control];
- Randomized Controlled Trials as Topic;
Medical Subject Headings Check Words
Female; Humans; Infant, Newborn; Pregnancy;
PICO
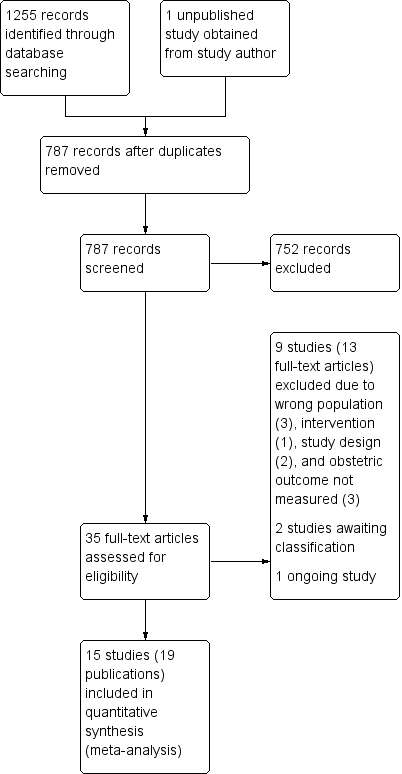
Study flow diagram.

Risk of bias graph: review authors' judgements about each risk of bias item presented as percentages across all included studies.
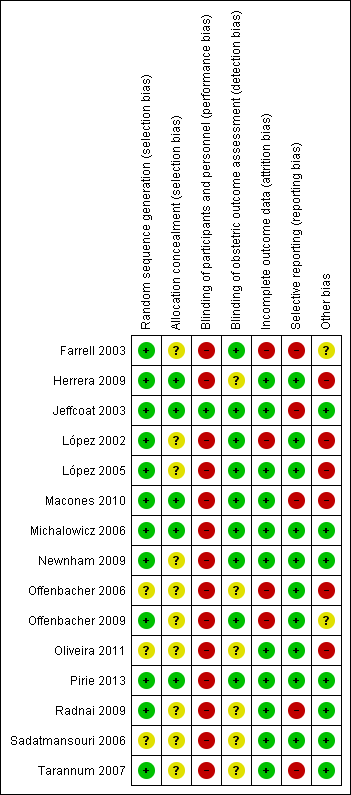
Risk of bias summary: review authors' judgements about each risk of bias item for each included study.
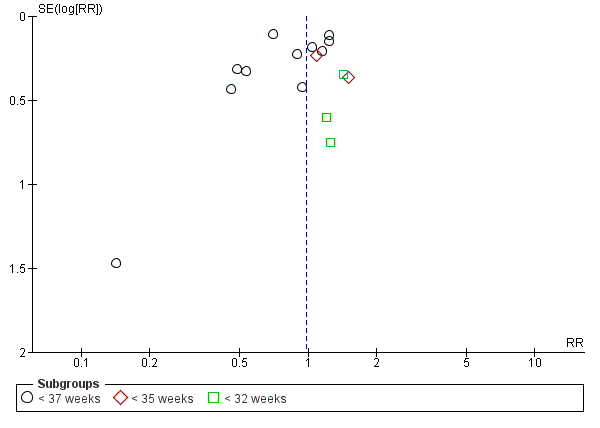
Funnel plot of Comparison 1 Periodontal treatment versus no treatment, Outcome 1.1 Gestational age (preterm birth).
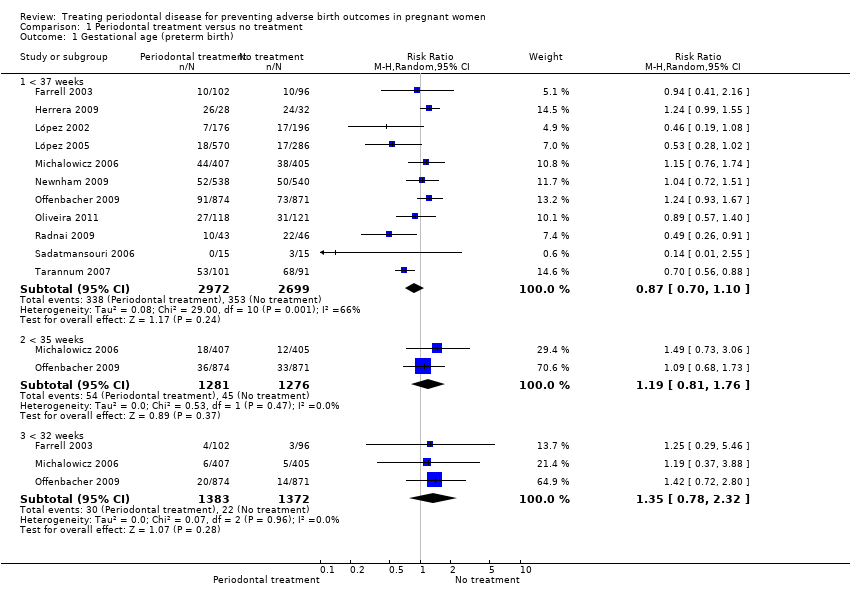
Comparison 1 Periodontal treatment versus no treatment, Outcome 1 Gestational age (preterm birth).

Comparison 1 Periodontal treatment versus no treatment, Outcome 2 Birth weight (low birth weight).

Comparison 1 Periodontal treatment versus no treatment, Outcome 3 Small for gestational age.
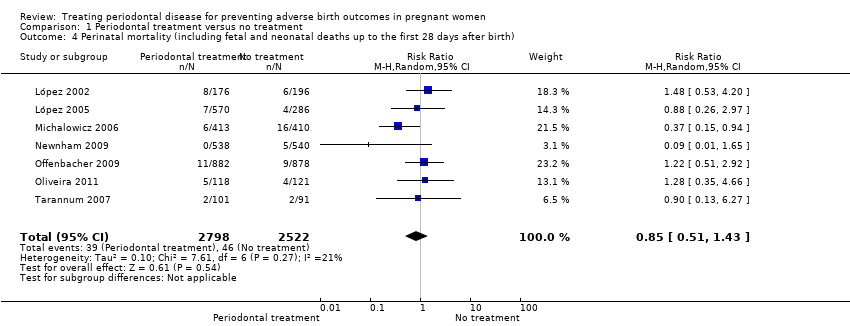
Comparison 1 Periodontal treatment versus no treatment, Outcome 4 Perinatal mortality (including fetal and neonatal deaths up to the first 28 days after birth).

Comparison 1 Periodontal treatment versus no treatment, Outcome 5 Pre‐eclampsia.

Comparison 1 Periodontal treatment versus no treatment, Outcome 6 Probing depth.
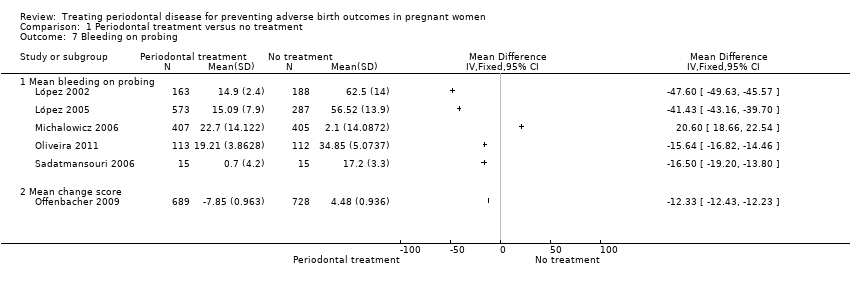
Comparison 1 Periodontal treatment versus no treatment, Outcome 7 Bleeding on probing.

Comparison 1 Periodontal treatment versus no treatment, Outcome 8 Plaque index.

Comparison 1 Periodontal treatment versus no treatment, Outcome 9 Clinical attachment level.

Comparison 2 Periodontal treatment versus alternative periodontal treatment, Outcome 1 Gestational age (preterm birth < 37 weeks).
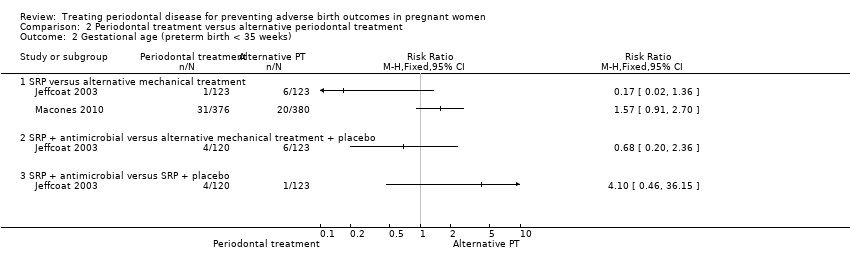
Comparison 2 Periodontal treatment versus alternative periodontal treatment, Outcome 2 Gestational age (preterm birth < 35 weeks).

Comparison 2 Periodontal treatment versus alternative periodontal treatment, Outcome 3 Birth weight (low birth weight).
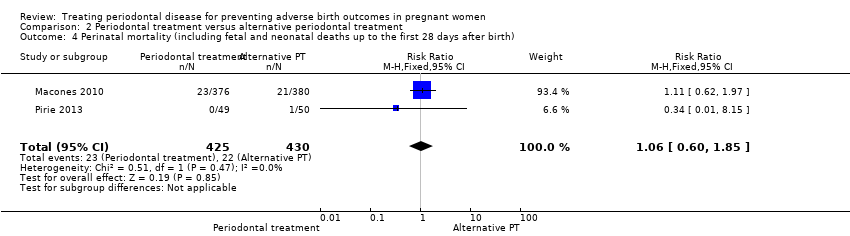
Comparison 2 Periodontal treatment versus alternative periodontal treatment, Outcome 4 Perinatal mortality (including fetal and neonatal deaths up to the first 28 days after birth).
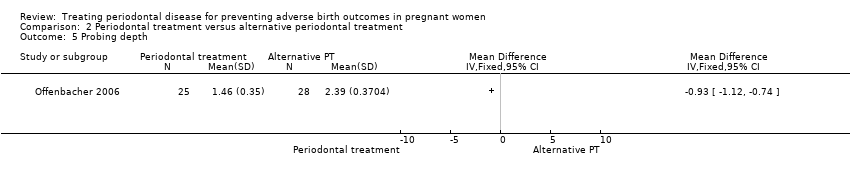
Comparison 2 Periodontal treatment versus alternative periodontal treatment, Outcome 5 Probing depth.

Comparison 2 Periodontal treatment versus alternative periodontal treatment, Outcome 6 Clinical attachment level.

Comparison 2 Periodontal treatment versus alternative periodontal treatment, Outcome 7 Bleeding on probing.

Comparison 2 Periodontal treatment versus alternative periodontal treatment, Outcome 8 Gingival index.
| Periodontal treatment compared to no treatment for preventing adverse birth outcomes in pregnant women | ||||||
| Patient or population: pregnant women considered to have periodontal disease after dental examination | ||||||
| Outcomes | Illustrative comparative risks* (95% CI) | Relative effect | Number of participants | Quality of the evidence | Comments | |
| Assumed risk | Corresponding risk | |||||
| No treatment | Periodontal treatment | |||||
| Gestational age (preterm birth < 37 weeks) | Study population | RR 0.87 | 5671 | ⊕⊕⊝⊝ | Preterm birth < 35 weeks and < 32 weeks were also reported. There was no evidence of a difference in preterm birth < 35 weeks (RR 1.19 (0.81 to 1.76), 2 studies; 2557 participants) and < 32 weeks (RR 1.35 (0.78 to 2.32), 3 studies; 2755 participants) (VERY LOW2 quality evidence) | |
| 131 per 1000 | 114 per 1000 | |||||
| Birth weight (low birth weight < 2500 g) | Study population | RR 0.67 | 3470 | ⊕⊕⊝⊝ | Low birth weight < 1500 g was reported in 2 studies. There was no evidence of a difference in low birth weight < 1500 g (RR 0.80 (0.38 to 1.70); 2550 participants) (VERY LOW2 quality evidence) | |
| 126 per 1000 | 84 per 1000 | |||||
| Small for gestational age | Study population | RR 0.97 (0.81 to 1.16) | 3610 | ⊕⊕⊝⊝ | ||
| 115 per 1000 | 111 per 1000 | |||||
| Perinatal mortality (including fetal and neonatal deaths up to the first 28 days after birth) | Study population | RR 0.85 (0.51 to 1.43) | 5320 | ⊕⊝⊝⊝ | ||
| 18 per 1000 | 16 per 1000 (9 to 26) | |||||
| Maternal mortality | 0% in both groups | Not estimated | 2134 (4 RCTs) | ‐ | ||
| Pre‐eclampsia | Study population | RR 1.10 | 2946 | ⊕⊝⊝⊝ | ||
| 64 per 1000 | 70 per 1000 | |||||
| Adverse effects of therapy | 0% in both groups | Not estimated | 2389 (4 RCTs) | ‐ | ||
| *The basis for the assumed risk (e.g. the median control group risk across studies) is provided in footnotes. The corresponding risk (and its 95% CI) is based on the assumed risk in the comparison group and the relative effect of the intervention (and its 95% CI). | ||||||
| GRADE Working Group grades of evidence | ||||||
| 1Downgraded 2 levels: serious limitation ‐ high risk of bias due to other bias (imbalance in baseline characteristics); serious inconsistency ‐ substantial heterogeneity (I2 = 66%). | ||||||
| Outcome | Study ID |
| Birth weight ≥ 2500 g | |
| Small for gestational age (10th percentile) | |
| Preterm/low birth weight | López 2002; López 2005; Oliveira 2011; Radnai 2009; Sadatmansouri 2006; Pirie 2013 |
| Birth length | Michalowicz 2006; Newnham 2009; Offenbacher 2009; Pirie 2013 |
| Head circumference | |
| Amniotic fluid index (< 5 cm, > 25 cm) | |
| Umbilical artery S/D ratios | |
| Umbilical cord artery/vein blood (number, pH, PCO2, PO2, base excess) | |
| Meconium in amniotic fluid | |
| Decision on delivery based on electronic fetal heart rate monitoring | |
| Scalp pH measured in labour | |
| Nonreassuring fetal heart rate pattern | |
| Caesarean delivery for nonreassuring fetal heart rate | |
| Electronic fetal heart rate monitoring in labour | |
| Ventilation | |
| Continuous Positive Airway Pressure (CPAP) | |
| Oxygen | |
| Special care nursery admission | |
| 1‐min Apgar score | |
| 5‐min Apgar score (0‐3, 4‐7, 8‐10) | |
| Apgar score (< 7 at 1 min, < 7 at 5 min) | |
| Admission to neonatal intensive care unit (number admitted, length of stay > 2 days, discharged alive) | |
| Sepsis necessitating antibiotics | |
| Composite neonatal morbidity/mortality | |
| HELLP syndrome, severe pre‐eclampsia | |
| Prenatal visits | |
| Onset of labour (spontaneous, induced, augmented, no labour) | |
| Mode of delivery (spontaneous vaginal, assisted vaginal, elective caesarean, emergency caesarean) | |
| Fever > 37o C in labour | |
| Postpartum haemorrhage (> 1000 mL) | |
| Retained placenta | |
| Fraction of expected birth weight | |
| Urinary tract infection | |
| Vaginosis, underweight, onset prenatal care after 20 weeks of gestation | |
| S/D = systolic/diastolic ratio. | |
| Study ID | Case definition |
| ≥ 3 sites with CAL ≥ 3 mm | |
| ≥ 4 teeth with ≥ 1 sites with PD ≥ 4 mm and with CAL ≥ 3 mm | |
| ≥ 6 sites with ≥ 5 mm probing depth and ≥ 3 sites with ≥ 3 mm loss of periodontal attachment | |
| AAP criteria ‐ PPD up to 6 mm with CAL up to 4 mm | |
| Gingival inflammation with over ≥ 25% of sites with BOP and no sites with CAL > 2 mm | |
| Attachment loss ≥ 3 mm on ≥ 3 teeth | |
| ≥ 4 teeth with ≥ 1 sites with PD ≥ 4 mm and with CAL ≥ 2 mm | |
| PPD ≥ 4 mm at ≥ 12 probing sites in fully erupted teeth | |
| ≥ 2 sites measuring ≥ 5 mm probing depths plus periodontal attachment loss of 1‐2 mm at ≥ 1 sites with probing depths ≥ 5 mm | |
| ≥ 4 sites with PD ≥ 4 mm and ≥ 4 sites with CAL ≥ 4 mm | |
| Chronic: ≥ 4 mm probing depth, at least 1 site, and BOP for ≥ 50% of teeth | |
| ≥ 2 mm attachment loss at ≥ 50% of examined sites | |
| AAP = American Academy of Periodontology; BOP = bleeding on probing; CAL = clinical attachment level; PD = pocket depth; PPD = periodontal pocket depth. | |
| Study | Number of visits | When | Intervention | Comparator | |
| Periodontal treatment versus no treatment | |||||
| 5 visits | 12 weeks | Plaque assessment Oral hygiene instruction | None | ||
| 1 session lasting 1‐2 hours | Supragingival and subgingival cleaning | None | |||
| Maintenance therapy every 2‐3 weeks till delivery | Plaque control instruction | None | |||
| Maintenance therapy every 2‐3 weeks till delivery | Plaque control instruction | None | |||
| Up to 4 visits | SRP | None | |||
| 3 treatments over 3 weeks | 20 weeks | Nonsurgical debridement of subgingival and supragingival plaque | None | ||
| Up to 4 sessions (mean 1.3 ± 0.4) | Supragingival and subgingival SRP | None | |||
| Maintenance therapy every 3 weeks till delivery | Dental prophylaxis | Tooth cleaning kit | |||
| Not stated | 32 weeks | Supragingival and subgingival scaling and polishing | None | ||
| Not reported | 28 weeks | SRP | None | ||
| 4‐5 sessions with a 1‐week interval between each appointment | Unclear | SRP | Plaque control instruction (toothbrushing) | ||
| Periodontal treatment versus alternative periodontal treatment | |||||
| Antibiotics 3 times daily for 1 week | SRP | SRP | Dental prophylaxis | ||
| Not stated | SRP | Superficial tooth cleaning | |||
| 4‐6 weeks follow‐up visit | SRP | Supragingival debridement | |||
| Performed over 2 1‐hour sessions | Completed by end of 24 weeks | Supragingival and subgingival SRP | Supragingival cleaning | ||
| CHX = chlorhexidine; SRP = scaling and root planing. | |||||
| Mean gestational age (weeks) | ||||||
| Periodontal treatment | No periodontal treatment | |||||
| Study ID | Mean | SD | Participants | Mean | SD | Participants |
| 39.6 | 1.2 | 163 | 39 | 2 | 188 | |
| 39.26 | 1.5 | 560 | 38.9 | 1.7 | 283 | |
| 39.1 | 2.1 | 538 | 39.2 | 2.1 | 540 | |
| 37.5 | 1.7 | 41 | 36.1 | 2.8 | 42 | |
| 38.5 | 0.8 | 15 | 37.9 | 1.3 | 15 | |
| 33.8 | 2.8 | 99 | 32.7 | 2.8 | 89 | |
| Mean birth weight (grams) | ||||||
| Periodontal treatment | No periodontal treatment | |||||
| Study ID | Mean | SD | Participants | Mean | SD | Participants |
| 3501 | 429 | 163 | 3344 | 598 | 188 | |
| 3426 | 477 | 560 | 3325 | 535 | 283 | |
| 3239 | 586 | 406 | 3258 | 575 | 403 | |
| 3370.6 | 613.4 | 538 | 3423.4 | 597.3 | 540 | |
| 3227 | 612 | 872 | 3241 | 590 | 866 | |
| 3079 | 592.3 | 41 | 2602.4 | 668.3 | 42 | |
| 3371 | 394.2 | 15 | 3059 | 389 | 15 | |
| 2565.3 | 331.2 | 99 | 2459.6 | 380.7 | 89 | |
| SD = standard deviation. | ||||||
| Study ID | Outcome | Periodontal treatment | Number of participants | Alternative periodontal/no treatment | Number of participants | P value |
| % sites with PD 4‐6 mm (mean ± SD) | 2.9 ± 3.9 | 163 | 27 ± 14 | 188 | 0.001 | |
| % sites with CAL ≥ 3 mm (mean ± SD) | 6.1 ± 7.8 | 163 | 25.4 ± 17.2 | 188 | 0.001 | |
| % sites with PD > 4 mm (mean ± SD) | 1.8 ± 2.9 | 573 | 14.5 ± 2.8 | 287 | 0.0001 | |
| Change PD at sites initially 4‐6 mm (mean ± SE) | 0.38 ± 0.02 | 405 | 0.88 ± 0.02 | 407 | < 0.001 | |
| Change PD at sites initially ≥ 7 mm (mean ± SE) | 1.07 ± 0.14 | 405 | 1.84 ± 0.14 | 407 | < 0.001 | |
| Change % sites with CAL ≥ 2 mm (mean ± SD) | 0.84 ± 0.85 | 405 | 9.72 ± 0.87 | 407 | < 0.001 | |
| % sites with PD > 4 mm (median (IQR)) | 3.3 (1.2‐7) | 354 | Not reported | Not reported | < 0.001 | |
| % sites BOP (median (IQR)) | 28.7 (17.9‐42.5) | 354 | Not reported | Not reported | < 0.001 | |
| Extent of PD ≥ 4 mm (mean ± SE) | 13.7 ± 1.5 | 25 | 10.5 ± 1.2 | 28 | < 0.0001 | |
| PI ≥ 1 (mean ± SE) | 67.8 ± 5.6 | 25 | 87 ± 5.3 | 28 | 0.02 | |
| Change PD at sites initially ≥ 4 mm (mean ± SD) | 1.47 ± 0.574 | 689 | 7.81 ± 0.559 | 728 | Not reported | |
| Sites with PD ≥ 4 mm (% (95% CI)) | 1.19 (1‐1.39) | 113 | 6.36 (5.92‐6.81) | 112 | < 0.0001 | |
| Sites with CAL ≥ 3 mm (% (95% CI)) | 5.72 (5.3‐6.14) | 113 | 6.58 (6.13‐7.03) | 112 | 0.0069 | |
| Number of sites PD ≥ 4 mm (median (IQR)) | 10 (6‐22) | 45 | Not reported | 45 | Not reported | |
| Number of sites PD ≥ 5 mm (median (IQR)) | 1 (0‐4) | 45 | Not reported | 45 | Not reported | |
| Number of sites AL ≥ 4 mm (median (IQR)) | 10 (5‐19) | 45 | Not reported | 45 | Not reported | |
| Number of sites AL ≥ 5 mm (median (IQR)) | 0 (0‐2) | 45 | Not reported | 45 | Not reported | |
| Number of sites plaque present (median (IQR)) | 57 (40‐82.5) | 45 | Not reported | 45 | Not reported | |
| Number of sites BOP present (median (IQR)) | 78 (63.5‐90) | 45 | Not reported | 45 | Not reported | |
| % of sites plaque present | 37 (28‐54.8) | 45 | Not reported | 45 | Not reported | |
| % of sites BOP present | 50 (42.9‐54.1) | 45 | Not reported | 45 | Not reported | |
| % of sites PD ≥ 4 mm | 78 (63.5‐90) | 45 | Not reported | 45 | Not reported | |
| % sites with PD 4 mm (mean ± SD) | 53.31 ± 18.5 | 15 | 68.6 ± 20.2 | 15 | 0.04 | |
| % sites with CAL 3 mm (mean ± SD) | 41.4 ± 18.4 | 15 | 67.1 ± 15.6 | 15 | 0.000 | |
| AL = attachment loss; BOP = bleeding on probing; CAL = clinical attachment level; IQR = interquartile range; PD = probing depth; PPD = periodontal pocket depth; SD = standard deviation; SE = standard error. | ||||||
| Mean gestational age (weeks) | ||||||
| Periodontal treatment | Alternative periodontal treatment | |||||
| Study ID | Mean | SD | Participants | Mean | SD | Participants |
| 38.6 | 2.8 | 376 | 38.8 | 2.3 | 380 | |
| 39.4 | 2.3 | 49 | 40 | 2.5 | 50 | |
| Mean birth weight (grams) | ||||||
| 3076.1 | Not reported | 376 | 3143.8 | Not reported | 380 | |
| 3510 | 650 | 49 | 3580 | 630 | 50 | |
| SD = standard deviation. | ||||||
| Outcome or subgroup title | No. of studies | No. of participants | Statistical method | Effect size |
| 1 Gestational age (preterm birth) Show forest plot | 11 | Risk Ratio (M‐H, Random, 95% CI) | Subtotals only | |
| 1.1 < 37 weeks | 11 | 5671 | Risk Ratio (M‐H, Random, 95% CI) | 0.87 [0.70, 1.10] |
| 1.2 < 35 weeks | 2 | 2557 | Risk Ratio (M‐H, Random, 95% CI) | 1.19 [0.81, 1.76] |
| 1.3 < 32 weeks | 3 | 2755 | Risk Ratio (M‐H, Random, 95% CI) | 1.35 [0.78, 2.32] |
| 2 Birth weight (low birth weight) Show forest plot | 7 | Risk Ratio (M‐H, Random, 95% CI) | Subtotals only | |
| 2.1 < 2500 g | 7 | 3470 | Risk Ratio (M‐H, Random, 95% CI) | 0.67 [0.48, 0.95] |
| 2.2 < 1500 g | 2 | 2550 | Risk Ratio (M‐H, Random, 95% CI) | 0.80 [0.38, 1.70] |
| 3 Small for gestational age Show forest plot | 3 | 3610 | Risk Ratio (M‐H, Fixed, 95% CI) | 0.97 [0.81, 1.16] |
| 4 Perinatal mortality (including fetal and neonatal deaths up to the first 28 days after birth) Show forest plot | 7 | 5320 | Risk Ratio (M‐H, Random, 95% CI) | 0.85 [0.51, 1.43] |
| 5 Pre‐eclampsia Show forest plot | 3 | 2946 | Risk Ratio (M‐H, Random, 95% CI) | 1.10 [0.74, 1.62] |
| 6 Probing depth Show forest plot | 4 | Mean Difference (IV, Fixed, 95% CI) | Totals not selected | |
| 6.1 Mean probing depth | 3 | Mean Difference (IV, Fixed, 95% CI) | 0.0 [0.0, 0.0] | |
| 6.2 Mean change score | 1 | Mean Difference (IV, Fixed, 95% CI) | 0.0 [0.0, 0.0] | |
| 7 Bleeding on probing Show forest plot | 6 | Mean Difference (IV, Fixed, 95% CI) | Totals not selected | |
| 7.1 Mean bleeding on probing | 5 | Mean Difference (IV, Fixed, 95% CI) | 0.0 [0.0, 0.0] | |
| 7.2 Mean change score | 1 | Mean Difference (IV, Fixed, 95% CI) | 0.0 [0.0, 0.0] | |
| 8 Plaque index Show forest plot | 2 | Mean Difference (IV, Fixed, 95% CI) | Totals not selected | |
| 9 Clinical attachment level Show forest plot | 4 | Mean Difference (IV, Fixed, 95% CI) | Totals not selected | |
| 9.1 Mean clinical attachment level | 3 | Mean Difference (IV, Fixed, 95% CI) | 0.0 [0.0, 0.0] | |
| 9.2 Mean change score | 1 | Mean Difference (IV, Fixed, 95% CI) | 0.0 [0.0, 0.0] | |
| Outcome or subgroup title | No. of studies | No. of participants | Statistical method | Effect size |
| 1 Gestational age (preterm birth < 37 weeks) Show forest plot | 4 | Risk Ratio (M‐H, Random, 95% CI) | Subtotals only | |
| 1.1 SRP versus alternative mechanical treatment | 4 | 1168 | Risk Ratio (M‐H, Random, 95% CI) | 0.87 [0.46, 1.67] |
| 1.2 SRP + antimicrobial versus alternative mechanical treatment + placebo | 1 | 243 | Risk Ratio (M‐H, Random, 95% CI) | 1.40 [0.67, 2.92] |
| 1.3 SRP + antimicrobial versus SRP + placebo | 1 | 243 | Risk Ratio (M‐H, Random, 95% CI) | 3.08 [1.15, 8.20] |
| 2 Gestational age (preterm birth < 35 weeks) Show forest plot | 2 | Risk Ratio (M‐H, Fixed, 95% CI) | Totals not selected | |
| 2.1 SRP versus alternative mechanical treatment | 2 | Risk Ratio (M‐H, Fixed, 95% CI) | 0.0 [0.0, 0.0] | |
| 2.2 SRP + antimicrobial versus alternative mechanical treatment + placebo | 1 | Risk Ratio (M‐H, Fixed, 95% CI) | 0.0 [0.0, 0.0] | |
| 2.3 SRP + antimicrobial versus SRP + placebo | 1 | Risk Ratio (M‐H, Fixed, 95% CI) | 0.0 [0.0, 0.0] | |
| 3 Birth weight (low birth weight) Show forest plot | 1 | Risk Ratio (M‐H, Fixed, 95% CI) | Totals not selected | |
| 3.1 < 2500 g | 1 | Risk Ratio (M‐H, Fixed, 95% CI) | 0.0 [0.0, 0.0] | |
| 3.2 < 1500 g | 1 | Risk Ratio (M‐H, Fixed, 95% CI) | 0.0 [0.0, 0.0] | |
| 4 Perinatal mortality (including fetal and neonatal deaths up to the first 28 days after birth) Show forest plot | 2 | 855 | Risk Ratio (M‐H, Fixed, 95% CI) | 1.06 [0.60, 1.85] |
| 5 Probing depth Show forest plot | 1 | Mean Difference (IV, Fixed, 95% CI) | Totals not selected | |
| 6 Clinical attachment level Show forest plot | 1 | Mean Difference (IV, Fixed, 95% CI) | Totals not selected | |
| 7 Bleeding on probing Show forest plot | 1 | Mean Difference (IV, Fixed, 95% CI) | Totals not selected | |
| 8 Gingival index Show forest plot | 1 | Mean Difference (IV, Fixed, 95% CI) | Totals not selected | |