Plantillas para la prevención y el tratamiento del dolor de espalda
Referencias
References to studies included in this review
References to studies excluded from this review
Additional references
Characteristics of studies
Characteristics of included studies [ordered by study ID]
Ir a:
| Methods | RCT ‐ cross‐over | |
| Participants | United States | |
| Interventions | Non Customized insoles Control intervention: No treatment | |
| Outcomes | Self reported incidence, pain intensity ‐ visual analogue scale (VAS) ‐ maximum pain relief ‐ 4.8 | |
| Notes | adverse affects ‐ 25 refused to participate because feeling unpleasant and too tight . 1/38 ‐ pain increased. Methodological quality: low ( 2/11 criteria) | |
| Risk of bias | ||
| Bias | Authors' judgement | Support for judgement |
| Adequate sequence generation? | Low risk | |
| Allocation concealment? | High risk | C ‐ Inadequate |
| Blinding? | High risk | |
| Blinding? | High risk | |
| Blinding? | Unclear risk | Unclear from text |
| Incomplete outcome data addressed? | High risk | Drop‐outs ‐ 32/96 (33%) |
| Incomplete outcome data addressed? | High risk | |
| Similarity of baseline characteristics? | Unclear risk | Unclear from text |
| Co‐interventions avoided or similar? | Low risk | |
| Compliance acceptable? | High risk | |
| Timing outcome assessments similar? | High risk | |
| Methods | RCT | |
| Participants | Denmark | |
| Interventions | Customized insoles Control intervention: No intervention | |
| Outcomes | self reported incidence and number of days off‐duty | |
| Notes | Military setting Methodological quality: high (8/11) | |
| Risk of bias | ||
| Bias | Authors' judgement | Support for judgement |
| Adequate sequence generation? | Low risk | |
| Allocation concealment? | Low risk | A ‐ Adequate |
| Blinding? | High risk | |
| Blinding? | Low risk | |
| Blinding? | Unclear risk | Unclear from text |
| Incomplete outcome data addressed? | Low risk | Drop‐outs ‐ Intervention ‐ 10/77 + 9/77 non‐compliant and Control ‐ 6/69 |
| Incomplete outcome data addressed? | Low risk | |
| Similarity of baseline characteristics? | Unclear risk | Unclear from text |
| Co‐interventions avoided or similar? | Low risk | |
| Compliance acceptable? | Low risk | |
| Timing outcome assessments similar? | Low risk | |
| Methods | RCT | |
| Participants | Israel | |
| Interventions | Customized insoles Control intervention: Simple shoe inserts without supportive or shock absorbing qualities | |
| Outcomes | Review by the senior author every two weeks ‐ questions about back pain + physical examination + monitoring for compliance | |
| Notes | Military setting Methodological quality: high ( 6/11 criteria) | |
| Risk of bias | ||
| Bias | Authors' judgement | Support for judgement |
| Adequate sequence generation? | Low risk | |
| Allocation concealment? | High risk | C ‐ Inadequate |
| Blinding? | High risk | |
| Blinding? | High risk | |
| Blinding? | Low risk | |
| Incomplete outcome data addressed? | High risk | Drop‐outs ‐ group 1 ‐ 78/129, group 2 ‐ 51/126, group 3 ‐ 73/126 |
| Incomplete outcome data addressed? | Low risk | |
| Similarity of baseline characteristics? | Low risk | |
| Co‐interventions avoided or similar? | Low risk | |
| Compliance acceptable? | High risk | |
| Timing outcome assessments similar? | Low risk | |
| Methods | RCT, | |
| Participants | South Africa | |
| Interventions | Non Customized insoles Control intervention: No treatment | |
| Outcomes | Physician diagnosis after first complaint by participant Main outcome ‐ injuries leading to self referral for medical care and confirmed by standardized medical diagnosis. | |
| Notes | Military setting Methodological quality: middle (5/11 criteria). | |
| Risk of bias | ||
| Bias | Authors' judgement | Support for judgement |
| Adequate sequence generation? | Unclear risk | Unclear from text |
| Allocation concealment? | Unclear risk | B ‐ Unclear |
| Blinding? | High risk | |
| Blinding? | High risk | |
| Blinding? | Unclear risk | Unclear from text |
| Incomplete outcome data addressed? | Low risk | Drop‐outs ‐ 13/250 and 109/1260 (due to transfers to other units) |
| Incomplete outcome data addressed? | High risk | |
| Similarity of baseline characteristics? | Low risk | |
| Co‐interventions avoided or similar? | Low risk | |
| Compliance acceptable? | Low risk | |
| Timing outcome assessments similar? | Low risk | |
| Methods | RCT ‐ cross over | |
| Participants | Israel | |
| Interventions | Customized insoles Control intervention: Placebo non‐customized insoles | |
| Outcomes | MILLION questionnaire for evaluation of low back pain + 10‐point pain scale | |
| Notes | We were not able to extract the numbers of patients with or without back pain after each intervention period. The required data were not available. Methodological quality: high ( 6/11 criteria) | |
| Risk of bias | ||
| Bias | Authors' judgement | Support for judgement |
| Adequate sequence generation? | High risk | |
| Allocation concealment? | Unclear risk | B ‐ Unclear |
| Blinding? | Low risk | |
| Blinding? | Low risk | |
| Blinding? | Low risk | |
| Incomplete outcome data addressed? | Low risk | Drop‐outs ‐ 15 did not agree to participate. 2/60 dropped from follow up |
| Incomplete outcome data addressed? | High risk | |
| Similarity of baseline characteristics? | Low risk | |
| Co‐interventions avoided or similar? | Unclear risk | Unclear from text |
| Compliance acceptable? | Low risk | |
| Timing outcome assessments similar? | High risk | |
| Methods | RCT | |
| Participants | United States | |
| Interventions | Non Customized insoles Control intervention: No intervention | |
| Outcomes | Self reported incidence, pain intensity ‐ visual analogue scale (VAS) | |
| Notes | Methodological quality: low ( 3/11 criteria) | |
| Risk of bias | ||
| Bias | Authors' judgement | Support for judgement |
| Adequate sequence generation? | Unclear risk | Unclear from text |
| Allocation concealment? | High risk | C ‐ Inadequate |
| Blinding? | High risk | |
| Blinding? | Unclear risk | Unclear from text |
| Blinding? | Unclear risk | Unclear from text |
| Incomplete outcome data addressed? | High risk | Drop‐outs ‐ 1/100 |
| Incomplete outcome data addressed? | High risk | |
| Similarity of baseline characteristics? | Low risk | |
| Co‐interventions avoided or similar? | Low risk | |
| Compliance acceptable? | High risk | |
| Timing outcome assessments similar? | Low risk | |
Characteristics of excluded studies [ordered by study ID]
Ir a:
| Study | Reason for exclusion |
| Not a RCT | |
| Not a RCT | |
| Retrospective report |
Data and analyses
| Outcome or subgroup title | No. of studies | No. of participants | Statistical method | Effect size |
| 1 Insoles vs placebo/No intervention Show forest plot | 3 | 1688 | Risk Ratio (M‐H, Random, 95% CI) | 0.73 [0.43, 1.22] |
| Analysis 1.1  Comparison 1 Prevention trials, Outcome 1 Insoles vs placebo/No intervention. | ||||
| Outcome or subgroup title | No. of studies | No. of participants | Statistical method | Effect size |
| 1 Insoles vs placebo/No intervention Show forest plot | 3 | 2061 | Risk Ratio (M‐H, Random, 95% CI) | 0.74 [0.43, 1.27] |
| Analysis 2.1  Comparison 2 Prevention trials ‐ ITT Assuming all dropouts did not have back pain, Outcome 1 Insoles vs placebo/No intervention. | ||||
| Outcome or subgroup title | No. of studies | No. of participants | Statistical method | Effect size |
| 1 Insoles vs placebo/No intervention Show forest plot | 3 | 2061 | Risk Ratio (M‐H, Random, 95% CI) | 0.85 [0.58, 1.23] |
| Analysis 3.1  Comparison 3 Prevention trials ‐ ITT Assuming dropouts were similar to controls, Outcome 1 Insoles vs placebo/No intervention. | ||||
| Outcome or subgroup title | No. of studies | No. of participants | Statistical method | Effect size |
| 1 Insoles vs placebo/No intervention Show forest plot | 2 | 300 | Risk Ratio (M‐H, Random, 95% CI) | 0.79 [0.46, 1.39] |
| Analysis 4.1  Comparison 4 Prevention trials ‐ High quality, Outcome 1 Insoles vs placebo/No intervention. | ||||
| Outcome or subgroup title | No. of studies | No. of participants | Statistical method | Effect size |
| 1 Insoles vs placebo/No intervention Show forest plot | 2 | 550 | Risk Ratio (M‐H, Random, 95% CI) | 0.81 [0.46, 1.45] |
| Analysis 5.1  Comparison 5 Prevention trials ‐ High quality ‐ ITT Assuming all dropout did not have back pain, Outcome 1 Insoles vs placebo/No intervention. | ||||
| Outcome or subgroup title | No. of studies | No. of participants | Statistical method | Effect size |
| 1 Insoles vs placebo/No intervention Show forest plot | 2 | 550 | Risk Ratio (M‐H, Random, 95% CI) | 0.90 [0.61, 1.32] |
| Analysis 6.1  Comparison 6 Prevention trials ‐ High Quality ‐ ITT Assuming dropouts were similar to controls, Outcome 1 Insoles vs placebo/No intervention. | ||||
| Outcome or subgroup title | No. of studies | No. of participants | Statistical method | Effect size |
| 1 Insoles vs placebo/No intervention Show forest plot | 2 | 249 | Risk Ratio (M‐H, Random, 95% CI) | 0.74 [0.34, 1.61] |
| Analysis 7.1  Comparison 7 Prevention trials ‐ Customized insoles, Outcome 1 Insoles vs placebo/No intervention. | ||||
| Outcome or subgroup title | No. of studies | No. of participants | Statistical method | Effect size |
| 1 Insoles vs placebo/No intervention Show forest plot | 2 | 414 | Risk Ratio (M‐H, Random, 95% CI) | 0.81 [0.43, 1.52] |
| Analysis 8.1  Comparison 8 Prevention trials ‐ Customized insoles ‐ ITT Assuming all dropout did not have back pain, Outcome 1 Insoles vs placebo/No intervention. | ||||
| Outcome or subgroup title | No. of studies | No. of participants | Statistical method | Effect size |
| 1 Insoles vs placebo/No intervention Show forest plot | 2 | 414 | Risk Ratio (M‐H, Random, 95% CI) | 0.83 [0.53, 1.31] |
| Analysis 9.1  Comparison 9 Prevention trials ‐ Customized insoles‐ ITT Assuming dropouts were similar to controls, Outcome 1 Insoles vs placebo/No intervention. | ||||
| Outcome or subgroup title | No. of studies | No. of participants | Statistical method | Effect size |
| 1 Insoles vs placebo/No intervention Show forest plot | 2 | 1492 | Risk Ratio (M‐H, Random, 95% CI) | 0.69 [0.33, 1.43] |
| Analysis 10.1  Comparison 10 Prevention trials ‐ Non customized insoles, Outcome 1 Insoles vs placebo/No intervention. | ||||
| Outcome or subgroup title | No. of studies | No. of participants | Statistical method | Effect size |
| 1 Insoles vs placebo/No intervention Show forest plot | 2 | 1782 | Risk Ratio (M‐H, Random, 95% CI) | 0.66 [0.31, 1.42] |
| Analysis 11.1  Comparison 11 Prevention trials ‐ Not Customized insoles‐ ITT Assuming all dropout did not have back pain, Outcome 1 Insoles vs placebo/No intervention. | ||||
| Outcome or subgroup title | No. of studies | No. of participants | Statistical method | Effect size |
| 1 Insoles vs placebo/No intervention Show forest plot | 2 | 1782 | Risk Ratio (M‐H, Random, 95% CI) | 0.78 [0.37, 1.65] |
| Analysis 12.1  Comparison 12 Prevention trials ‐ Not Customized insoles‐ ITT Assuming dropouts were similar to controls, Outcome 1 Insoles vs placebo/No intervention. | ||||

Summary of risks of bias

Comparison 1 Prevention trials, Outcome 1 Insoles vs placebo/No intervention.

Comparison 2 Prevention trials ‐ ITT Assuming all dropouts did not have back pain, Outcome 1 Insoles vs placebo/No intervention.

Comparison 3 Prevention trials ‐ ITT Assuming dropouts were similar to controls, Outcome 1 Insoles vs placebo/No intervention.

Comparison 4 Prevention trials ‐ High quality, Outcome 1 Insoles vs placebo/No intervention.

Comparison 5 Prevention trials ‐ High quality ‐ ITT Assuming all dropout did not have back pain, Outcome 1 Insoles vs placebo/No intervention.

Comparison 6 Prevention trials ‐ High Quality ‐ ITT Assuming dropouts were similar to controls, Outcome 1 Insoles vs placebo/No intervention.

Comparison 7 Prevention trials ‐ Customized insoles, Outcome 1 Insoles vs placebo/No intervention.
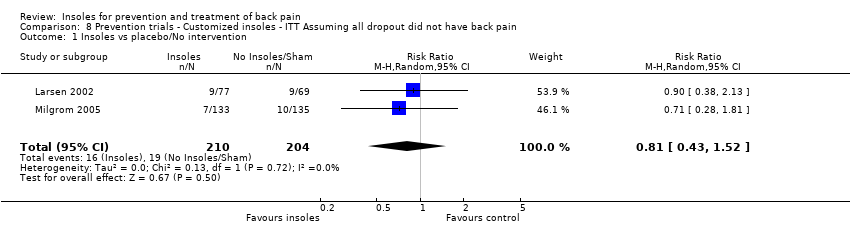
Comparison 8 Prevention trials ‐ Customized insoles ‐ ITT Assuming all dropout did not have back pain, Outcome 1 Insoles vs placebo/No intervention.

Comparison 9 Prevention trials ‐ Customized insoles‐ ITT Assuming dropouts were similar to controls, Outcome 1 Insoles vs placebo/No intervention.

Comparison 10 Prevention trials ‐ Non customized insoles, Outcome 1 Insoles vs placebo/No intervention.

Comparison 11 Prevention trials ‐ Not Customized insoles‐ ITT Assuming all dropout did not have back pain, Outcome 1 Insoles vs placebo/No intervention.

Comparison 12 Prevention trials ‐ Not Customized insoles‐ ITT Assuming dropouts were similar to controls, Outcome 1 Insoles vs placebo/No intervention.
| Outcome or subgroup title | No. of studies | No. of participants | Statistical method | Effect size |
| 1 Insoles vs placebo/No intervention Show forest plot | 3 | 1688 | Risk Ratio (M‐H, Random, 95% CI) | 0.73 [0.43, 1.22] |
| Outcome or subgroup title | No. of studies | No. of participants | Statistical method | Effect size |
| 1 Insoles vs placebo/No intervention Show forest plot | 3 | 2061 | Risk Ratio (M‐H, Random, 95% CI) | 0.74 [0.43, 1.27] |
| Outcome or subgroup title | No. of studies | No. of participants | Statistical method | Effect size |
| 1 Insoles vs placebo/No intervention Show forest plot | 3 | 2061 | Risk Ratio (M‐H, Random, 95% CI) | 0.85 [0.58, 1.23] |
| Outcome or subgroup title | No. of studies | No. of participants | Statistical method | Effect size |
| 1 Insoles vs placebo/No intervention Show forest plot | 2 | 300 | Risk Ratio (M‐H, Random, 95% CI) | 0.79 [0.46, 1.39] |
| Outcome or subgroup title | No. of studies | No. of participants | Statistical method | Effect size |
| 1 Insoles vs placebo/No intervention Show forest plot | 2 | 550 | Risk Ratio (M‐H, Random, 95% CI) | 0.81 [0.46, 1.45] |
| Outcome or subgroup title | No. of studies | No. of participants | Statistical method | Effect size |
| 1 Insoles vs placebo/No intervention Show forest plot | 2 | 550 | Risk Ratio (M‐H, Random, 95% CI) | 0.90 [0.61, 1.32] |
| Outcome or subgroup title | No. of studies | No. of participants | Statistical method | Effect size |
| 1 Insoles vs placebo/No intervention Show forest plot | 2 | 249 | Risk Ratio (M‐H, Random, 95% CI) | 0.74 [0.34, 1.61] |
| Outcome or subgroup title | No. of studies | No. of participants | Statistical method | Effect size |
| 1 Insoles vs placebo/No intervention Show forest plot | 2 | 414 | Risk Ratio (M‐H, Random, 95% CI) | 0.81 [0.43, 1.52] |
| Outcome or subgroup title | No. of studies | No. of participants | Statistical method | Effect size |
| 1 Insoles vs placebo/No intervention Show forest plot | 2 | 414 | Risk Ratio (M‐H, Random, 95% CI) | 0.83 [0.53, 1.31] |
| Outcome or subgroup title | No. of studies | No. of participants | Statistical method | Effect size |
| 1 Insoles vs placebo/No intervention Show forest plot | 2 | 1492 | Risk Ratio (M‐H, Random, 95% CI) | 0.69 [0.33, 1.43] |
| Outcome or subgroup title | No. of studies | No. of participants | Statistical method | Effect size |
| 1 Insoles vs placebo/No intervention Show forest plot | 2 | 1782 | Risk Ratio (M‐H, Random, 95% CI) | 0.66 [0.31, 1.42] |
| Outcome or subgroup title | No. of studies | No. of participants | Statistical method | Effect size |
| 1 Insoles vs placebo/No intervention Show forest plot | 2 | 1782 | Risk Ratio (M‐H, Random, 95% CI) | 0.78 [0.37, 1.65] |