Contenido relacionado
Revisiones y protocolos relacionados
Laureen M Lopez, Alissa Bernholc, Mario Chen, Elizabeth E. Tolley | 29 junio 2016
Aalaa Jawad, Issrah Jawad, Nisreen A Alwan | 1 marzo 2019
Rabeea'h W Aslam, Maggie Hendry, Ben Carter, Jane Noyes, Jo Rycroft Malone, Andrew Booth, Diana Pasterfield, Joanna Mary Charles, Noel Craine, Rhiannon Tudor Edwards, Lupetu Ives Ntambwe, Nefyn Williams, Rhiannon Whitaker | 29 enero 2015
Laureen M Lopez, Thomas W Grey, Mario Chen, Elizabeth E. Tolley, Laurie L Stockton | 23 noviembre 2016
Laureen M Lopez, Thomas W Grey, Mario Chen, Janet E Hiller | 27 noviembre 2014
Laureen M Lopez, Conrad Otterness, Mario Chen, Markus Steiner, Maria F Gallo | 26 octubre 2013
Laureen M Lopez, Alissa Bernholc, Yanwu Zeng, Rebecca H Allen, Deborah Bartz, Paul A O'Brien, David Hubacher | 29 julio 2015
Jo Power, Rebecca French, Frances M. Cowan | 18 julio 2007
David A Grimes, Laureen M Lopez, Kenneth F Schulz | 26 julio 1999
Lale Say, Dalia Brahmi, Regina Kulier, Aldo Campana, A Metin Gülmezoglu | 21 octubre 2002
Respuestas clínicas Cochrane
Demian Glujovsky | 21 julio 2016

![Comparison 1 Multiple interventions, Outcome 1 Unintended pregnancy [individually randomised trials].](/es/cdsr/doi/10.1002/14651858.CD005215.pub3/media/CDSR/CD005215/image_n/nCD005215-CMP-001-01.png)
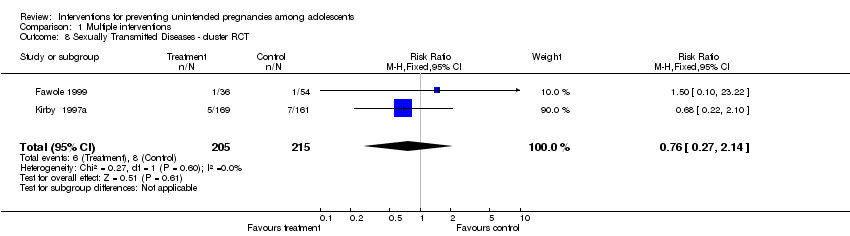
![Comparison 1 Multiple interventions, Outcome 2 Unintended pregnancy [cluster‐randomised trials].](/es/cdsr/doi/10.1002/14651858.CD005215.pub3/media/CDSR/CD005215/image_n/nCD005215-CMP-001-02.png)


![Comparison 2 Sensitivity analysis [Multiple interventions]: Unintended pregnancy, Outcome 1 Unintended pregnancy ‐ cluster‐randomi sed trials .](/es/cdsr/doi/10.1002/14651858.CD005215.pub3/media/CDSR/CD005215/image_n/nCD005215-CMP-002-01.png)
![Comparison 2 Sensitivity analysis [Multiple interventions]: Unintended pregnancy, Outcome 2 Unintended pregnancy ‐ individually‐randomi sed trials .](/es/cdsr/doi/10.1002/14651858.CD005215.pub3/media/CDSR/CD005215/image_n/nCD005215-CMP-002-02.png)
![Comparison 2 Sensitivity analysis [Multiple interventions]: Unintended pregnancy, Outcome 3 Unintended pregnancy ‐ cluster‐adjusted + individual .](/es/cdsr/doi/10.1002/14651858.CD005215.pub3/media/CDSR/CD005215/image_n/nCD005215-CMP-002-03.png)
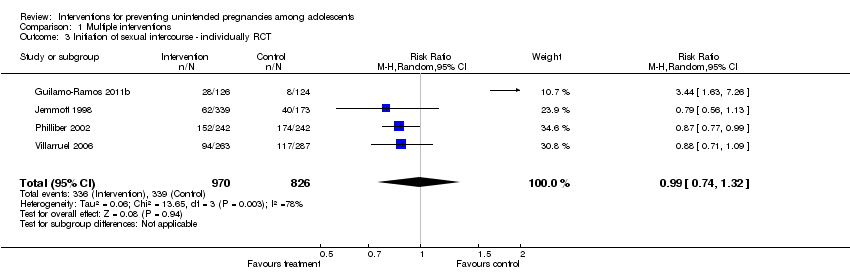
![Comparison 3 Sensitivity analysis [Multiple interventions]: Initiation of intercourse, Outcome 1 Initiation of sexual intercourse ‐ individually RCT.](/es/cdsr/doi/10.1002/14651858.CD005215.pub3/media/CDSR/CD005215/image_n/nCD005215-CMP-003-01.png)
![Comparison 3 Sensitivity analysis [Multiple interventions]: Initiation of intercourse, Outcome 2 Initiation of sexual intercourse ‐ cluster RCT.](/es/cdsr/doi/10.1002/14651858.CD005215.pub3/media/CDSR/CD005215/image_n/nCD005215-CMP-003-02.png)
![Comparison 3 Sensitivity analysis [Multiple interventions]: Initiation of intercourse, Outcome 3 Initiation of sexual intercourse ‐ cluster‐adjusted + individual.](/es/cdsr/doi/10.1002/14651858.CD005215.pub3/media/CDSR/CD005215/image_n/nCD005215-CMP-003-03.png)