Scolaris Content Display Scolaris Content Display

Risk of bias summary: review authors' judgments about each risk of bias item for each included study.
Figuras y tablas -
Figure 1

Risk of bias summary: review authors' judgments about each risk of bias item for each included study.

Comparison 1 Multiple interventions, Outcome 1 Unintended Pregnancy [individually randomized trials].
Figuras y tablas -
Analysis 1.1

Comparison 1 Multiple interventions, Outcome 1 Unintended Pregnancy [individually randomized trials].

Comparison 1 Multiple interventions, Outcome 2 Unintended Pregnancy [Cluster‐randomised trials].
Figuras y tablas -
Analysis 1.2

Comparison 1 Multiple interventions, Outcome 2 Unintended Pregnancy [Cluster‐randomised trials].

Comparison 1 Multiple interventions, Outcome 3 Initiation of sexual intercourse‐Individually RCT.
Figuras y tablas -
Analysis 1.3

Comparison 1 Multiple interventions, Outcome 3 Initiation of sexual intercourse‐Individually RCT.

Comparison 1 Multiple interventions, Outcome 4 Initiation of sexual intercourse‐Cluster RCT.
Figuras y tablas -
Analysis 1.4

Comparison 1 Multiple interventions, Outcome 4 Initiation of sexual intercourse‐Cluster RCT.

Comparison 1 Multiple interventions, Outcome 5 Use of birth control methods‐Cluster RCT.
Figuras y tablas -
Analysis 1.5

Comparison 1 Multiple interventions, Outcome 5 Use of birth control methods‐Cluster RCT.

Comparison 1 Multiple interventions, Outcome 6 Use of birth control methods‐Individually RCT.
Figuras y tablas -
Analysis 1.6

Comparison 1 Multiple interventions, Outcome 6 Use of birth control methods‐Individually RCT.

Comparison 1 Multiple interventions, Outcome 7 Sexually Transmitted Diseases‐Cluster RCT.
Figuras y tablas -
Analysis 1.7

Comparison 1 Multiple interventions, Outcome 7 Sexually Transmitted Diseases‐Cluster RCT.

Comparison 1 Multiple interventions, Outcome 8 Sexually Transmitted Diseases‐Individually RCT.
Figuras y tablas -
Analysis 1.8

Comparison 1 Multiple interventions, Outcome 8 Sexually Transmitted Diseases‐Individually RCT.

Comparison 1 Multiple interventions, Outcome 9 Childbirth‐Individually RCT.
Figuras y tablas -
Analysis 1.9

Comparison 1 Multiple interventions, Outcome 9 Childbirth‐Individually RCT.

Comparison 1 Multiple interventions, Outcome 10 Second unintended pregnancy‐Individually RCT.
Figuras y tablas -
Analysis 1.10

Comparison 1 Multiple interventions, Outcome 10 Second unintended pregnancy‐Individually RCT.

Comparison 2 Sensitivity analysis [Multiple intervention]: Unintended pregnancy, Outcome 1 Unintended Pregnancy [cluster‐randomized studies].
Figuras y tablas -
Analysis 2.1

Comparison 2 Sensitivity analysis [Multiple intervention]: Unintended pregnancy, Outcome 1 Unintended Pregnancy [cluster‐randomized studies].

Comparison 2 Sensitivity analysis [Multiple intervention]: Unintended pregnancy, Outcome 2 Unintended Pregnancy [cluster‐adjusted+individual].
Figuras y tablas -
Analysis 2.2

Comparison 2 Sensitivity analysis [Multiple intervention]: Unintended pregnancy, Outcome 2 Unintended Pregnancy [cluster‐adjusted+individual].

Comparison 3 Sensitivity analysis [Multiple intervention]: Initiation of intercourse, Outcome 1 Initiation of sexual intercourse‐Individually RCT.
Figuras y tablas -
Analysis 3.1

Comparison 3 Sensitivity analysis [Multiple intervention]: Initiation of intercourse, Outcome 1 Initiation of sexual intercourse‐Individually RCT.

Comparison 3 Sensitivity analysis [Multiple intervention]: Initiation of intercourse, Outcome 2 Initiation of sexual intercourse‐cluster RCT.
Figuras y tablas -
Analysis 3.2

Comparison 3 Sensitivity analysis [Multiple intervention]: Initiation of intercourse, Outcome 2 Initiation of sexual intercourse‐cluster RCT.

Comparison 3 Sensitivity analysis [Multiple intervention]: Initiation of intercourse, Outcome 3 Initiation of sexual intercourse‐cluster‐adjusted + individual).
Figuras y tablas -
Analysis 3.3

Comparison 3 Sensitivity analysis [Multiple intervention]: Initiation of intercourse, Outcome 3 Initiation of sexual intercourse‐cluster‐adjusted + individual).

Comparison 4 Educational intervention, Outcome 1 Initiation of Sexual Intercourse‐Cluster RCT.
Figuras y tablas -
Analysis 4.1

Comparison 4 Educational intervention, Outcome 1 Initiation of Sexual Intercourse‐Cluster RCT.

Comparison 4 Educational intervention, Outcome 2 Use of birth control methods‐Cluster RCT.
Figuras y tablas -
Analysis 4.2

Comparison 4 Educational intervention, Outcome 2 Use of birth control methods‐Cluster RCT.

Comparison 5 Contraceptive Intervention, Outcome 1 Unintended Pregnancy‐Individually RCT.
Figuras y tablas -
Analysis 5.1

Comparison 5 Contraceptive Intervention, Outcome 1 Unintended Pregnancy‐Individually RCT.

Comparison 5 Contraceptive Intervention, Outcome 2 Initiation of sexual intercourse‐Cluster RCT.
Figuras y tablas -
Analysis 5.2

Comparison 5 Contraceptive Intervention, Outcome 2 Initiation of sexual intercourse‐Cluster RCT.

Comparison 5 Contraceptive Intervention, Outcome 3 Use of birth control methods‐Cluster RCT.
Figuras y tablas -
Analysis 5.3

Comparison 5 Contraceptive Intervention, Outcome 3 Use of birth control methods‐Cluster RCT.

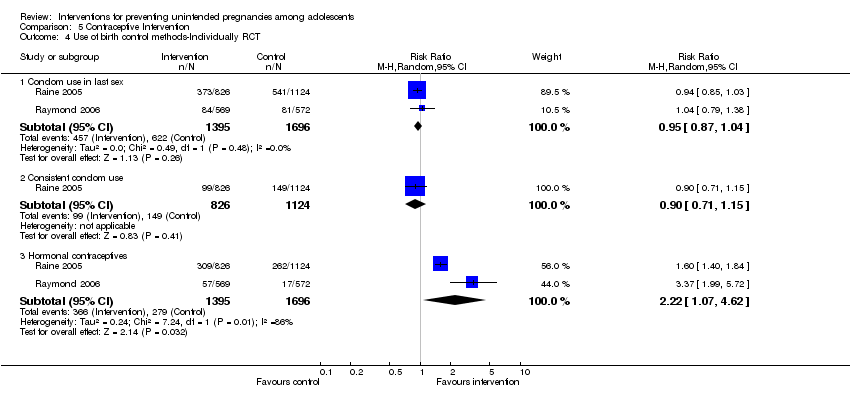
Comparison 5 Contraceptive Intervention, Outcome 4 Use of birth control methods‐Individually RCT.
Figuras y tablas -
Analysis 5.4

Comparison 5 Contraceptive Intervention, Outcome 4 Use of birth control methods‐Individually RCT.

Comparison 5 Contraceptive Intervention, Outcome 5 Sexually Transmitted Diseases‐Individually RCT.
Figuras y tablas -
Analysis 5.5

Comparison 5 Contraceptive Intervention, Outcome 5 Sexually Transmitted Diseases‐Individually RCT.

Table 1. Studies That Can Not Be Included in Meta Analysis

Intervention

Outcome

Study ID

Number Assessed

Case affected

Control affected

summary Of effects by authors

Test Statistics

95% CI

p‐value

Educational Intervention

Pregnancy

O'Donnell 2002

195

6.8%

18.5%

Favour intervention

Mitchell‐DiCenso 1997

1701

Favour intervention

OR: 0.97

0.98 to 1.0

0.04

Allen 1997

560

Favour intervention

OR: 0.41

Initiation of Intercourse

Clark 2005

156

No significant effect

Beta: 1.604 and SE: 1.00

< 0.11

O'Donnell 2002

195

40.1%

66.1%

Favour intervention

OR: 0.39

0.20 to 0.76

0.005

Use of birth control at last sex

Mitchell‐DiCenso 1997 (females)

109

42.2%

46.7%

No significant effect

OR: 1.03

1.00 to 1.07

0.03

Mitchell‐DiCenso 1997 (males)

214

39.3%

35.9%

No significant effect

OR: 1.06

1.02 to 1.77

0.005

Use of condom at last sex

Okonofua 2003

1896

39.1%

31.9%

Favour intervention

OR: 1.41

1.12 to 1.77

Multiple Intervention

Pregnancy

Coyle 2006

308

No significant effect

OR; 0.84

0.61

Diclemente 2004

460

No significant effect

OR: 0.53

0.27 to 1.03

0.06

Stephenson 2004

1172

2.3%

3.3%

No significant effect

0.07

Kirby 2004

2145

Favour Intervention

OR: 1.34

0.98 to 1.84

0.07

Coyle 2006

417

No significant effect

OR: 0.77

0.49 to 1.23

0.28

Smith 1994

95

Favour intervention

< 0.05

Initiation of sexual intercourse (Mixed gender)

Coyle 2006

94

No significant effect

OR: 1.23

0.51 to 2.97

0.65

Smith 1994

95

.Mean: 1.19

.Mean: 2.74

Favour intervention

Basen‐Engquist 2001

8326

No significant effect

OR: 1.03

0.88 to 1.21

0.69

Initiation of sexual intercourse (Males)

Coyle 2004

1412

19.3%

27.7%

Favour Intervention

model R2: 0.118

0.02

Kirby 2004

809

No significant effect

OR: 1.08

0.80 to 1.46

0.63

Stephenson 2004

8156

32.7%

31.1%

No significant effect

OR: 0.90

0.65 to 1.23

0.35

Eisen 1990

408

36%

44%

Favour Intervention

Initiation of intercourse (female)

Coyle 2004

1417

20.3%

22.1%

No significant effect

model R2: 0.145

0.53

Kirby 2004

1220

No significant effect

OR: 0.88

0.59 to 1.31

0.54

Stephenson 2004

8156

34.7%

40.8%

Favour intervention

OR: 0.80

0.66 to 0.97

0.008

Eisen 1990

480

27%

22%

No significant effect

Use of condoms at last sex

Kirby 2004

2145

Favour intervention

OR: 1.38

1.06 to 1.79

0.02

Coyle 2006

359

No significant effect

OR: 1.00

0.49 to 1.23

0.99

Diclemente 2004

460

Favour intervention

OR: 3.94

2.58 to 6.03

< .001

Downs 2004

258

No significant effect

OR: 2.13

0.15

Childbirth

Henderson 2007

4196

300/1000

274/1000

No significant effect

OR: 14.6

0.32

Abortion

Henderson 2007

4196

127/1000

112/1000

No significant effect

OR: 26.4

0.40

Figuras y tablas -
Table 1. Studies That Can Not Be Included in Meta Analysis
Comparison 1. Multiple interventions

Outcome or subgroup title

No. of studies

No. of participants

Statistical method

Effect size

1 Unintended Pregnancy [individually randomized trials] Show forest plot

2

858

Risk Ratio (M‐H, Fixed, 95% CI)

0.72 [0.51, 1.03]

2 Unintended Pregnancy [Cluster‐randomised trials] Show forest plot

5

3149

Risk Ratio (M‐H, Random, 95% CI)

0.50 [0.23, 1.09]

3 Initiation of sexual intercourse‐Individually RCT Show forest plot

3

1546

Risk Ratio (M‐H, Fixed, 95% CI)

0.86 [0.77, 0.96]

3.1 Gender mixed or not specified

3

1546

Risk Ratio (M‐H, Fixed, 95% CI)

0.86 [0.77, 0.96]

4 Initiation of sexual intercourse‐Cluster RCT Show forest plot

6

7954

Risk Ratio (M‐H, Random, 95% CI)

0.90 [0.77, 1.06]

4.1 Female

2

3499

Risk Ratio (M‐H, Random, 95% CI)

0.97 [0.87, 1.08]

4.2 Male

2

2969

Risk Ratio (M‐H, Random, 95% CI)

0.99 [0.87, 1.13]

4.3 Gender mixed or not specified

4

1486

Risk Ratio (M‐H, Random, 95% CI)

0.77 [0.47, 1.28]

5 Use of birth control methods‐Cluster RCT Show forest plot

5

Risk Ratio (M‐H, Random, 95% CI)

Subtotals only

5.1 condom use at last sex

3

1956

Risk Ratio (M‐H, Random, 95% CI)

1.01 [0.87, 1.16]

5.2 consistent condom use

2

296

Risk Ratio (M‐H, Random, 95% CI)

2.78 [0.98, 7.84]

5.3 Hormonal contraceptives

3

3987

Risk Ratio (M‐H, Random, 95% CI)

1.01 [0.72, 1.43]

6 Use of birth control methods‐Individually RCT Show forest plot

5

1332

Risk Ratio (M‐H, Random, 95% CI)

1.09 [0.89, 1.34]

6.1 Condom use in last sex

2

388

Risk Ratio (M‐H, Random, 95% CI)

1.03 [0.95, 1.13]

6.2 Consistent Condom use

3

944

Risk Ratio (M‐H, Random, 95% CI)

1.10 [0.74, 1.64]

7 Sexually Transmitted Diseases‐Cluster RCT Show forest plot

2

420

Risk Ratio (M‐H, Fixed, 95% CI)

0.76 [0.27, 2.14]

8 Sexually Transmitted Diseases‐Individually RCT Show forest plot

1

60

Risk Ratio (M‐H, Fixed, 95% CI)

0.45 [0.18, 1.15]

9 Childbirth‐Individually RCT Show forest plot

1

484

Risk Ratio (M‐H, Fixed, 95% CI)

0.67 [0.31, 1.45]

10 Second unintended pregnancy‐Individually RCT Show forest plot

1

149

Risk Ratio (M‐H, Fixed, 95% CI)

0.48 [0.22, 1.02]

Figuras y tablas -
Comparison 1. Multiple interventions
Comparison 2. Sensitivity analysis [Multiple intervention]: Unintended pregnancy

Outcome or subgroup title

No. of studies

No. of participants

Statistical method

Effect size

1 Unintended Pregnancy [cluster‐randomized studies] Show forest plot

2

497

Risk Ratio (M‐H, Random, 95% CI)

0.20 [0.10, 0.39]

2 Unintended Pregnancy [cluster‐adjusted+individual] Show forest plot

3

871

Risk Ratio (M‐H, Fixed, 95% CI)

0.49 [0.33, 0.74]

Figuras y tablas -
Comparison 2. Sensitivity analysis [Multiple intervention]: Unintended pregnancy
Comparison 3. Sensitivity analysis [Multiple intervention]: Initiation of intercourse

Outcome or subgroup title

No. of studies

No. of participants

Statistical method

Effect size

1 Initiation of sexual intercourse‐Individually RCT Show forest plot

1

550

Risk Ratio (M‐H, Fixed, 95% CI)

0.88 [0.71, 1.09]

1.1 Gender mixed or not specified

1

550

Risk Ratio (M‐H, Fixed, 95% CI)

0.88 [0.71, 1.09]

2 Initiation of sexual intercourse‐cluster RCT Show forest plot

3

1033

Risk Ratio (M‐H, Random, 95% CI)

0.92 [0.51, 1.65]

2.1 Gender mixed or not specified

3

1033

Risk Ratio (M‐H, Random, 95% CI)

0.92 [0.51, 1.65]

3 Initiation of sexual intercourse‐cluster‐adjusted + individual) Show forest plot

4

1583

Odds Ratio (M‐H, Fixed, 95% CI)

0.87 [0.70, 1.09]

3.1 Gender mixed or not specified

4

1583

Odds Ratio (M‐H, Fixed, 95% CI)

0.87 [0.70, 1.09]

Figuras y tablas -
Comparison 3. Sensitivity analysis [Multiple intervention]: Initiation of intercourse
Comparison 4. Educational intervention

Outcome or subgroup title

No. of studies

No. of participants

Statistical method

Effect size

1 Initiation of Sexual Intercourse‐Cluster RCT Show forest plot

1

525

Odds Ratio (M‐H, Fixed, 95% CI)

1.02 [0.67, 1.54]

1.1 Gender mixed or not specified

1

525

Odds Ratio (M‐H, Fixed, 95% CI)

1.02 [0.67, 1.54]

2 Use of birth control methods‐Cluster RCT Show forest plot

2

1431

Risk Ratio (M‐H, Random, 95% CI)

1.18 [1.06, 1.32]

2.1 condom use at last sex

2

1431

Risk Ratio (M‐H, Random, 95% CI)

1.18 [1.06, 1.32]

Figuras y tablas -
Comparison 4. Educational intervention
Comparison 5. Contraceptive Intervention

Outcome or subgroup title

No. of studies

No. of participants

Statistical method

Effect size

1 Unintended Pregnancy‐Individually RCT Show forest plot

2

3440

Risk Ratio (M‐H, Fixed, 95% CI)

1.01 [0.81, 1.26]

2 Initiation of sexual intercourse‐Cluster RCT Show forest plot

1

3006

Risk Ratio (M‐H, Fixed, 95% CI)

0.95 [0.85, 1.07]

2.1 Female

1

1446

Risk Ratio (M‐H, Fixed, 95% CI)

0.89 [0.76, 1.04]

2.2 Male

1

1560

Risk Ratio (M‐H, Fixed, 95% CI)

1.02 [0.87, 1.21]

3 Use of birth control methods‐Cluster RCT Show forest plot

1

415

Risk Ratio (M‐H, Fixed, 95% CI)

0.90 [0.69, 1.18]

3.1 Hormonal contraceptives

1

415

Risk Ratio (M‐H, Fixed, 95% CI)

0.90 [0.69, 1.18]

4 Use of birth control methods‐Individually RCT Show forest plot

2

Risk Ratio (M‐H, Random, 95% CI)

Subtotals only

4.1 Condom use in last sex

2

3091

Risk Ratio (M‐H, Random, 95% CI)

0.95 [0.87, 1.04]

4.2 Consistent condom use

1

1950

Risk Ratio (M‐H, Random, 95% CI)

0.90 [0.71, 1.15]

4.3 Hormonal contraceptives

2

3091

Risk Ratio (M‐H, Random, 95% CI)

2.22 [1.07, 4.62]

5 Sexually Transmitted Diseases‐Individually RCT Show forest plot

2

3440

Risk Ratio (M‐H, Fixed, 95% CI)

0.92 [0.75, 1.13]

Figuras y tablas -
Comparison 5. Contraceptive Intervention