| Study ID | Common treatment | Intervention 1 | intervention 2 |
| Anderson 1983 | C; 1.2g/m2 IV on D1, O; 2.0mg/m2(max 2mg) IV on D3,10,17 and 24, MTX; 6.25mg/m2 IT on D5, 31,34. P; 15mg/m2 (max 60mg) orally qds on D3‐30 decreasing to zero on D31‐3.
Radiation therapy.
Tumour excision attempted in patients with localised disease. Laparotomy and biopsy in patients with non‐localised disease. | COMP
Induction: MTX 300mg/m2 IV on D12, 7
Maintanance: C; 1g/m2 IV on D1, O; 1.5mg/m2 Iv on D1,4, MTX; 6.25mg/m2 IT on D1 (excluded from ist maintenance cycle), the 300mg/m2 IV on D15. Repeat maintenance cycle every 28 days | LSA2 L2 (modified)
Induction: DAU; 60mg/m2 IV on D12 and 13
Consolidation: CYT; 100mg/m2 IV 5 days on ,2 days off x 2weeks, THIO; 50mg/m2 orally 8‐12 hrs post CYT injection, ASP; 6000IU/m2 IM daily x14 days post CYT and THIO. MTX; 6.25mg/m2 IT x2 3 days apart, 2‐3 days after last dose of ASP, CAR; 60mg/m2 IV single dose given 2‐3 days after completion of MTX
Maintanance: THIO; 300mg/m2 orally on D1‐4, ; 600mg/m2 IV on D5, H; 2.4g/m2 orally on D1‐4, DAU 45mg/m2 orally on D5, CYT; 150mg/m2 IV D1‐5, O; 2.0 mg/m2 (max 2mg) IV on D5, MTX; 6.25 mg/m2 IT x2 doses 3days apart. Repeat maintenance cycles 1‐5 |
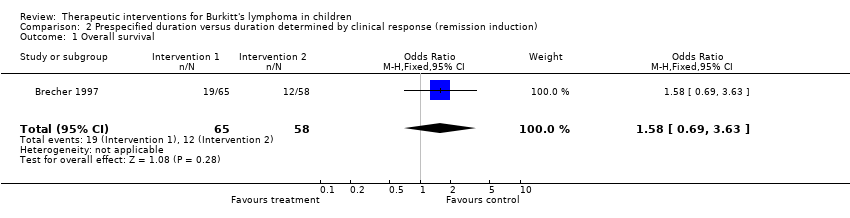
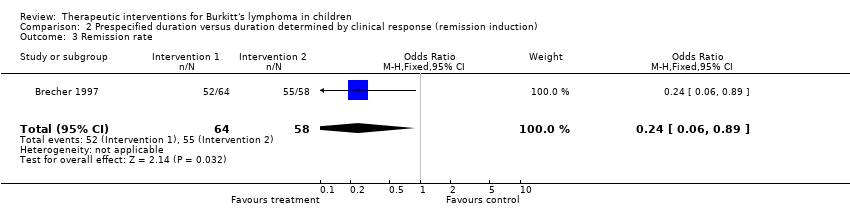
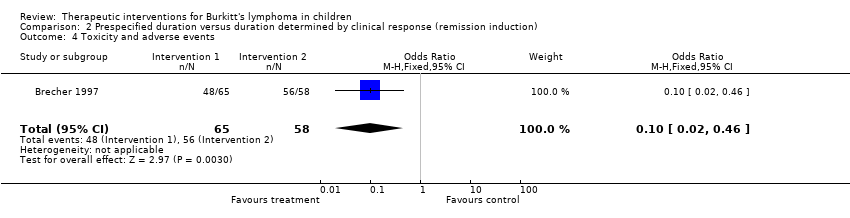
| Brecher 1997 | None | A
Prespecified duration:
Induction:C on D1 (dose not specified), MTX on D24 and 31 (dose not specified), O: wkly (x5weeks dose not specified), P: daily x4weeks (dose not specified)
Consolidation(22 weeks): C: D52 and 102, MTX on D74,81,124, and 131, O: I hour prior to each MTX
Maintanance(11 weeks): O and MTX on D174 and 216,
CNS prophylaxis: Ara‐C;, MTX and hydrocortisone | B
Duration determined by clinical response:
Induction: fractionated C,O and DOX
Infusion phase: sequential continuous infusion of MTX and Ara‐c (pending mucosal and bone marrow recovery)
Repeat induction and infusion x 4 with dose of Ara‐c being doubled with each course
CNS prophylaxis: MTX and Ara‐c |
| Cairo 2003 | Prephase: C: 0.3g/m2 IV, O; 1mg/m2 IV on D1; P: 60mg/m2 IV or orally in 2 fractions on D1‐7, MTX+HYD+Ara‐C: 30mg IT on D1,3 and 5.
Induction:
COPADM 1 (started 1 wk after D1 of prephase)
O: 2mg/m2 (max 2mg) IV, high dose MTX 8g/m2 IV x4 hours on D1, CFR: 15mg/m2 every 6 hrs orally on D2‐4; MTX+HYD+Ara‐C: 30mg IT on D2,4 and 6; DOX: 60mg/m2 IV on D2; C: 0.5g/m2 IV (in 2 fractions) on D2‐4; P: 60mg/m2 IV or orally on D1‐6
COPADM 2 similar to COPADM1 except for: 2nd O dose: 2mg/m2 (max 2mg) IV on D6; C: 1g/m2 IV (in 2 fractions) on D2‐4. | Reduced intensity
Similar to standard dose except for consolidation drugs are given at 2/3 the standard doses and deletion of M2‐4 maintenance. | Standard dose
Consolidation: (x2 courses)
Ara‐C: 50mg/m2 CI x12hrs on D1‐5(8pm‐8am); high dose Ara‐C 3g/m2 IV x3hours on D2‐5(8‐11am); VP‐16: 200mg/m2 IV on D2‐5(2‐4pm).
Maintenance (monthly alternating courses)
M1: O: 2mg/m2(max 2mg) IV, high dose MTX 8g/m2 IVx4hours on D1; CFR: 15mg/m2 every 6hours orally on D2‐4; P: 60mg/m2 orally on D1‐5; MTX+HYD+Ara‐C: 30mg IT on D2; C: 0.5g/m2 IV on D1 and 2; DOX: 60mg/m2 IV on D2.
M2/M4: VP‐16: 150mg/m2 IV on D1‐3; Ara‐C: 100mg/m2 SC(in 2 fractions) on D1‐5.
M3: similar to M1 but without high dose MTX and IT |
| Olweny 1976 | none | C: 40mg/kg IV on D1,repeated after 2 weeks or as soon as toxicity is abated | C: 30mg/kg IV on D1, O: 2mg/m2 IV on D1, MTX 15mg/m2 orally on D1‐3. This is repeated 12‐14 days later. |
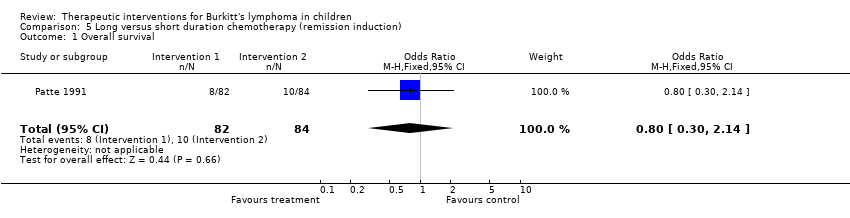
| Patte 1991 | Reduction phase: C: 0.3g/m2 IV, O; 1mg/m2 IV on D1; P: 2mg/kg orally on D1‐7, MTX+HYD: 15mg/m2 IT on D1.
Induction:
COPADM 1 (started 1 wk after D1 of prephase)
O: 2mg/m2 IV, high dose MTX 3g/m2 IV x3 hours on D1, CFR: 15mg/m2 every 6 hrs orally on D2‐4; MTX+HYD: 15mg IT on D2 and 6; DOX: 60mg/m2 IV on D2; C: 0.5g/m2 IV (in 2 fractions) on D2‐4; P: 2mg/kg IV or orally on D1‐6
COPADM 2 similar to COPADM1 except for: addition of 2nd O dose: 2mg/m2 IV on D6; C: 1g/m2 IV (in 2 fractions) on D2‐4.
CYM:high dose MTX 3g/m2 IV x3 hours on D1; CFR: 15mg/m2 every 6 hrs orally on D2‐4;
Ara‐C: 100mg/m2 CI on D2‐6; Ara‐C+HYD: 30mg/m2 IT on D6
Maintenance (monthly alternating courses)
M1: O: 2mg/m2 IV, high dose MTX 3g/m2 IVx3hours on D1; CFR: 15mg every 6hours orally on D2‐4; P: 2mg/kg orally on D1‐5; MTX+HYD: 15mg IT on D2; C: 0.5g/m2 IV on D1 and 2; DOX: 60mg/m2 IV on D2.
M2: CCNU: 60mg/m2 orally on D28; Ara‐C: 100mg/m2 SC(in 2 fractions) on D28‐31; Ara‐C+HYD: 30mg/m2 IT on D28; THIO: 150mg/m2 orally on D28‐31 | Long arm:
CYM 1,
Mini‐BACT:CCNU: 60mg/m2 orally on D1; Ara‐C: 100mg/m2 CI on D2‐6; THIO: 150mg/m2 orally on D2‐6; C: 0.5g/m2 IV on D2‐4.
M1, M2, M1, M2 | Short arm:
CYM 1 and 2,
M1 |
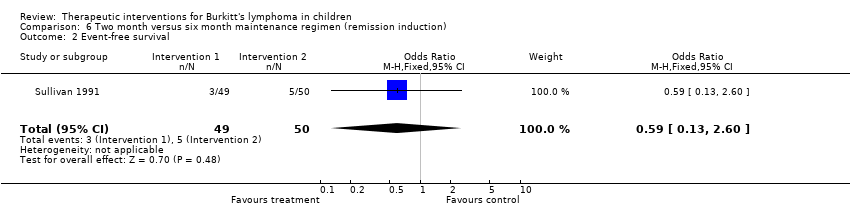
| Sullivan 1991 | Induction: C: 1.2g/m2 Iv on D1, repeat on D1 of weeks 7 and 14; O: 2.0mg/m2(max 2.omg) IV on D2 or 3 weekly x4 then 1.0mg/m2 IV given 1 hour before MTX infusion; P: 60mg/m2(max 60mg) orally daily from D1 x28 days; MTX: 2 6‐hour infusion starting from week 3, starting dose 50mg/kg increasing to 100mg/kg then to 200mg/kg throughout the rest of the treatment, given as 2 doses every 7 weeks during induction and consolidation and every 6 weeks during maintenance; CFR: 15mg IV 3hourly x9 doses then 15mg 6 hourly x8 doses after each MTX infusion;
CNS prophylaxis: CYT: 45mg/m2 on D1 and 2, MTX 15mg/m2 on D3 starting on D2 of induction, subsequently given as triple therapy (CYT 60mg/m2, MTX 15mg/m2 (max 15mg, HYD 30mg/m2) at week 6 and 14, then 24 hours before each pair of MTX infusions.
Maintenance: triple therapy, IV MTX, IV O | Maintenance regimen for 2 months | Maintenance regimen for 6 months |
| Ziegler 1971 | unclear | MTX 25mg/m2 IT alternating with Ara‐C 50mg /m2 IT every 4 days. Two dose of each drug was given | No intrathecal therapy |
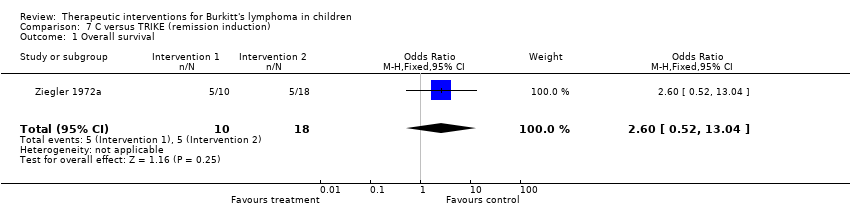
| Ziegler 1972a | none | C: 40mg/kg IV at 2 weekly intervals for 6 doses | TRIKE schedule
C: 4omg/kg followed in two weeks by O: 1.4mg/m2 IV on D1 and MTX 15mg/m2 orally on D1‐4; Ara‐C: two weeks later; 250mg/m2 CI daily x3days. |