Intervenciones terapéuticas para el linfoma de Burkitt en niños
Referencias
Referencias de los estudios incluidos en esta revisión
Referencias de los estudios excluidos de esta revisión
Referencias adicionales
Characteristics of studies
Characteristics of included studies [ordered by study ID]
Ir a:
| Methods | Randomised, parallel group, multicentre trial (North America) | |
| Participants | Baseline characteristics: 234 participants randomised (Regimen 1: 99; 106; 47 (20%) of participants had BL; M:F: 184:50). Mean age: not reported. Tumour staging: Rappaport. Entry criteria: <18 years of age; no previous treatment for NHL; biopsy confirmed NHL Exclusion criteria: not stated | |
| Interventions | COMP versus LSA2‐L2 (modified). See table 1 for details of treatment protocol. Treatment duration: 18 months Follow‐up: two‐four years | |
| Outcomes | Overall survival (12‐24 months). | |
| Notes | Addional 23 participants followed during course of study but not randomly allocated to treatment group Full text publication Randomisation rating: A Withdrawal bias rating: B | |
| Risk of bias | ||
| Bias | Authors' judgement | Support for judgement |
| Allocation concealment? | Low risk | A ‐ Adequate |
| Methods | Randomised, parallel group, multicentre trial (North America) | |
| Participants | Baseline characteristics: 106 male, 17 female, all participants had stage III disease (Regimen A: 65; Regimen B: 58). Mean age: 8.6 yrs range 2.3‐20.3 yrs Entry criteria: newly diagnosed stage III SNCCL, pathology confirmed Exclusion criteria :not stated | |
| Interventions | Regimen A (prespecified duration) versus Regimen B:(duration determined by clinical response) Treatment duration: 9 months Follow‐up: 3‐8 years | |
| Outcomes | Overall survival. | |
| Notes | Full text publication Randomisation rating: B Withdrawal bias rating: B | |
| Risk of bias | ||
| Bias | Authors' judgement | Support for judgement |
| Allocation concealment? | Unclear risk | B ‐ Unclear |
| Methods | Randomised, parallel group, multicentre trial (Europe) | |
| Participants | Baseline characteristics: 241 participants screened (Burkitt's and Burkitt's‐like lymphoma: 51.3%), 195 randomised (standard dose: 96; reduced intensity: 99) Entry criteria: </=21 years; advanced disease (bone marrow and/or CNS, B‐NHL [LCL, BL and BLL]). Exclusion criteria: not described | |
| Interventions | Standard dose versus reduced intensity chemotherapy Tretament duration: not reported Follow‐up: median 3.25 years | |
| Outcomes | Overall survival. | |
| Notes | Unpublished conference abstract Randomisation rating: B Withdrawal bias rating: B | |
| Risk of bias | ||
| Bias | Authors' judgement | Support for judgement |
| Allocation concealment? | Unclear risk | B ‐ Unclear |
| Methods | Randomised, parallel group, | |
| Participants | Baseline characteristics: 35 participants recruited (interim analysis). No other details reported. Entry criteria: In remission from BL post cyclophosphamide | |
| Interventions | CCNU (70mg/m2) administered orally once versus no treatment post treatment with C (two doses, 40mg/kg IV, two weeks apart). Treatment duration: 2 weeks Follow‐up: Unclear | |
| Outcomes | CNS relapse | |
| Notes | Unpublished conference abstract Randomisation rating: B Withdrawal bias rating: B | |
| Risk of bias | ||
| Bias | Authors' judgement | Support for judgement |
| Allocation concealment? | Unclear risk | B ‐ Unclear |
| Methods | Randomised, parallel group, single centre trial (Uganda) | |
| Participants | Baseline characteristics: Screening population: 80. 45 participants randomised (40 evaluated BCG: 21; control: 19; M:F: BCG: 15:6; Control: 14:5) Entry criteria: untreated BL; remission two weeks after treatment with C | |
| Interventions | BCG versus no treatment. Participants randomised if in remission two weeks post C. Follow‐up: Median 1.75 years | |
| Outcomes | Relapse. | |
| Notes | Participants recruited if in remission. Randomisation rating: B Withdrawal bias rating: B | |
| Risk of bias | ||
| Bias | Authors' judgement | Support for judgement |
| Allocation concealment? | Unclear risk | B ‐ Unclear |
| Methods | Randomised, parallel group, single centre study (Ghana) | |
| Participants | Baseline characteristics: 46 participants screened and given 3 courses of C (27 children randomised (M:F: 16:11)) Entry criteria: Stage III BL; adequate response to cyclophosphamide Exclusion criteria: not reported | |
| Interventions | TF IM (once per month) versus no treatment. Incomplete administration of treatment due to limited supply of TF. Study duration: Maximum of one year Follow‐up: Median 3.3 years | |
| Outcomes | Relapse. | |
| Notes | Full text publication. Randomisation rating: A Withdrawal bias rating: B | |
| Risk of bias | ||
| Bias | Authors' judgement | Support for judgement |
| Allocation concealment? | Unclear risk | B ‐ Unclear |
| Methods | Randomised, parallel group, single centre trial (Kenya). | |
| Participants | Baseline characteristics: 40 participants randomised Entry criteria: Confirmed BL. | |
| Interventions | C versus C,O, MTX Treatment duration: 2 weeks (or as soon as toxicity abated). A third dose was given to 3 participants in C group and in one participant in C.O.MTX group. Follow‐up: unclear | |
| Outcomes | Relapse. | |
| Notes | Full text publication Randomisation rating: A Withdrawal bias rating: A | |
| Risk of bias | ||
| Bias | Authors' judgement | Support for judgement |
| Allocation concealment? | Unclear risk | B ‐ Unclear |
| Methods | Randomised, parallel group, single centre trial (Kenya). | |
| Participants | Baseline characteristics: 25 participants randomised. Entry criteria: BL free of CNS involvement in remission post treatment with C, MTX, or O. | |
| Interventions | Irradiation versus no irradiation. Dose given was 20 to 24 Gy (0.7 to 0.75 Gy per fraction). Treatnment duration: 2 x 5 days Follow‐up: 1.6 years | |
| Outcomes | Relapse. | |
| Notes | Full text publication Randomisation rating: A Withdrawal bias rating: A | |
| Risk of bias | ||
| Bias | Authors' judgement | Support for judgement |
| Allocation concealment? | Unclear risk | B ‐ Unclear |
| Methods | Randomised, parallel group, multicentre trial (Europe). | |
| Participants | Baseline characteristics: 216 eligible (166 randomised; long duration: 84; short duration: 82). Entry criteria: Age <17 years, diagnosis of BL, stage III and IV disease Exclusion criteria: CNS involvement. After 1986, only those with abdominal or head‐neck primary tumours were included. | |
| Interventions | Short course (5 weeks) versus long course (16 weeks plus 2 additional drugs) maintenance chemotherapy Follow‐up: unclear | |
| Outcomes | Remission. | |
| Notes | Full text publication. Randomisation rating: A Withdrawal bias rating: A Equivalence trial. Study type: remission induction | |
| Risk of bias | ||
| Bias | Authors' judgement | Support for judgement |
| Allocation concealment? | Low risk | A ‐ Adequate |
| Methods | Randomised, parallel group, multicentre trial (North America) | |
| Participants | Baseline characteristics: 168 participants registered, 148 were evaluable, 73 had BL. Entry criteria: stage III and IV non lymphoblastic NHL, age < 22 years Exclusion criteria: not stated | |
| Interventions | Short term (2 months) versus long term (6 months) maintenance treatment Follow‐up: 3‐7 years | |
| Outcomes | Complete remission. | |
| Notes | Full text publication. Randomisation rating: B Withdrawal bias rating: B | |
| Risk of bias | ||
| Bias | Authors' judgement | Support for judgement |
| Allocation concealment? | Unclear risk | B ‐ Unclear |
| Methods | Randomised, parallel group, single site trial (Uganda) | |
| Participants | Baseline characteristics: sample size; 20 evaluated for study Entry criteria: BL at stage I‐III; no evidence of malignant pleocyotosis on admission Exclusion criteria: not stated | |
| Interventions | Prophylactic IT therapy versus no treatment Treatment duration: 4 or 10 days Follow‐up: participants followed to relapse. | |
| Outcomes | Relapse rate | |
| Notes | Full publication Randomisation rating: B Withdrawal bias rating: B Method of remission induction not clear | |
| Risk of bias | ||
| Bias | Authors' judgement | Support for judgement |
| Allocation concealment? | Unclear risk | B ‐ Unclear |
| Methods | Randomised, parallel group, single site trial (Uganda) | |
| Participants | Baseline characteristics: sample size: 41 participants, 27 were evaluable for the study Entry criteria: stage III or IV disease, untreated, histopathologic diagnosis Exclusion criteria: not stated | |
| Interventions | C versus TRIKE regimen Follow‐up: Participants followed up until death. | |
| Outcomes | Relapse. | |
| Notes | 2:1 allocation was used in randomisation. Full text publication Randomisation rating: B Withdrawal bias rating: C | |
| Risk of bias | ||
| Bias | Authors' judgement | Support for judgement |
| Allocation concealment? | Unclear risk | B ‐ Unclear |
NHL: Non‐Hodgkin's Lymphoma, LCL: Large cell lymphoma; BL: Burkit's lymphoma; BLL: Burkitt's‐like lymphoma; C: cyclophosphamide, O: vincristine, MTX: methotrexate, P: prednisolone, DAU: daunorubicin, CYT: cytarabine, THIO: thioguanine, ASP: asparaginase, CAR: carmustine, H:hydroxyurea, SNCCL: small noncleaved cell lymphoma, Ara‐C: cytosine arabinoside, DOX: doxorubicin, Cairo; conference proceedings; CCNU: Lomustine; CNS: central nervous system; TF: Transfer factor; HYD: hydrocortisone; CFR: citrovorum factor rescue; VP‐16: etoposide; SC: subcutaneously; CI: continuous infusion; IT: intrathecal;
Characteristics of excluded studies [ordered by study ID]
Ir a:
| Study | Reason for exclusion |
| There was no randomisation | |
| The study was done in adults and the tumour type (marginal zone B‐cell lymphoma) is different | |
| The age group of the study participants were not stated but the tumour type is different and the study was not randomised | |
| This is a review article, no randomisation | |
| No randomisation, tumour type is different | |
| Study was done in adults | |
| Age was above the cut off. The study was not randomised, tumour type is different | |
| The study was done in adults | |
| The tumour type is different | |
| Age above cutoff, the study was not randomised | |
| Age above cutoff, study was not randomised | |
| Age above cutoff, study was not randomised | |
| The study was done in adults | |
| The study was done in adults | |
| Not randomised | |
| Not randomised | |
| The study was done in adults | |
| The study was done in adults | |
| The study was done in adults | |
| The study was done in adults, tumour type is different |
Data and analyses
| Outcome or subgroup title | No. of studies | No. of participants | Statistical method | Effect size |
| 1 Overall survival | 0 | Odds Ratio (M‐H, Fixed, 95% CI) | Totals not selected | |
| 2 Event‐free survival | 0 | Odds Ratio (M‐H, Fixed, 95% CI) | Totals not selected | |
| 3 Remission rate | 0 | Odds Ratio (M‐H, Fixed, 95% CI) | Totals not selected | |
| 4 Relapse | 0 | Odds Ratio (M‐H, Fixed, 95% CI) | Totals not selected | |
| 5 Toxicity and adverse events | 0 | Odds Ratio (M‐H, Fixed, 95% CI) | Totals not selected |
| Outcome or subgroup title | No. of studies | No. of participants | Statistical method | Effect size |
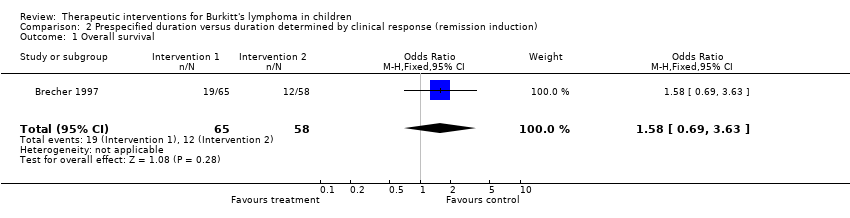
| 1 Overall survival Show forest plot | 1 | 123 | Odds Ratio (M‐H, Fixed, 95% CI) | 1.58 [0.69, 3.63] |
| Analysis 2.1  Comparison 2 Prespecified duration versus duration determined by clinical response (remission induction), Outcome 1 Overall survival. | ||||
| 2 Event‐free survival Show forest plot | 1 | 123 | Odds Ratio (M‐H, Fixed, 95% CI) | 2.10 [0.93, 4.74] |
| Analysis 2.2  Comparison 2 Prespecified duration versus duration determined by clinical response (remission induction), Outcome 2 Event‐free survival. | ||||
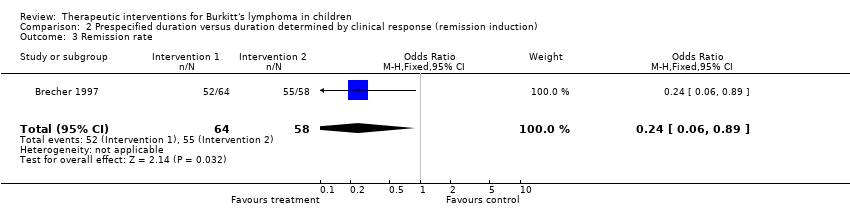
| 3 Remission rate Show forest plot | 1 | 122 | Odds Ratio (M‐H, Fixed, 95% CI) | 0.24 [0.06, 0.89] |
| Analysis 2.3  Comparison 2 Prespecified duration versus duration determined by clinical response (remission induction), Outcome 3 Remission rate. | ||||
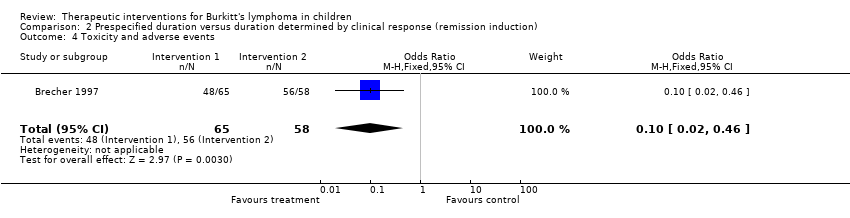
| 4 Toxicity and adverse events Show forest plot | 1 | 123 | Odds Ratio (M‐H, Fixed, 95% CI) | 0.10 [0.02, 0.46] |
| Analysis 2.4  Comparison 2 Prespecified duration versus duration determined by clinical response (remission induction), Outcome 4 Toxicity and adverse events. | ||||
| Outcome or subgroup title | No. of studies | No. of participants | Statistical method | Effect size |
| 1 Overall survival | 0 | Odds Ratio (M‐H, Fixed, 95% CI) | Totals not selected | |
| 2 Event‐free survival | 0 | Odds Ratio (M‐H, Fixed, 95% CI) | Totals not selected | |
| 3 Remission rate | 0 | Odds Ratio (M‐H, Fixed, 95% CI) | Totals not selected | |
| 4 Relapse | 0 | Odds Ratio (M‐H, Fixed, 95% CI) | Totals not selected | |
| 5 Toxicity and adverse events | 0 | Odds Ratio (M‐H, Fixed, 95% CI) | Totals not selected |
| Outcome or subgroup title | No. of studies | No. of participants | Statistical method | Effect size |
| 1 Overall survival Show forest plot | 1 | 40 | Odds Ratio (M‐H, Fixed, 95% CI) | 2.75 [0.76, 9.95] |
| Analysis 4.1  Comparison 4 C versus combination chemotherapy (remission induction), Outcome 1 Overall survival. | ||||
| 2 Event‐free survival | 0 | Odds Ratio (M‐H, Fixed, 95% CI) | Totals not selected | |
| 3 Remission rate Show forest plot | 1 | 37 | Odds Ratio (M‐H, Fixed, 95% CI) | 0.94 [0.16, 5.39] |
| Analysis 4.3  Comparison 4 C versus combination chemotherapy (remission induction), Outcome 3 Remission rate. | ||||
| 4 Relapse Show forest plot | 1 | 31 | Odds Ratio (M‐H, Fixed, 95% CI) | 0.69 [0.16, 2.87] |
| Analysis 4.4  Comparison 4 C versus combination chemotherapy (remission induction), Outcome 4 Relapse. | ||||
| 5 Toxicity and adverse events | 0 | Odds Ratio (M‐H, Fixed, 95% CI) | Totals not selected | |
| Outcome or subgroup title | No. of studies | No. of participants | Statistical method | Effect size |
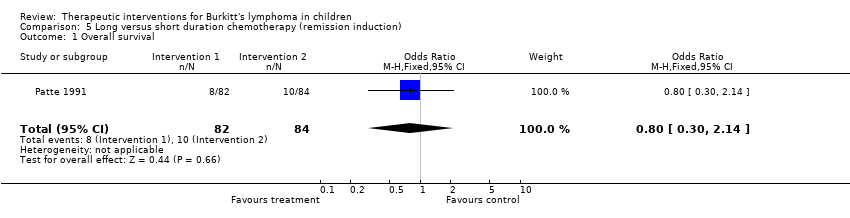
| 1 Overall survival Show forest plot | 1 | 166 | Odds Ratio (M‐H, Fixed, 95% CI) | 0.8 [0.30, 2.14] |
| Analysis 5.1  Comparison 5 Long versus short duration chemotherapy (remission induction), Outcome 1 Overall survival. | ||||
| 2 Event‐free survival Show forest plot | 1 | 166 | Odds Ratio (M‐H, Fixed, 95% CI) | 1.17 [0.43, 3.20] |
| Analysis 5.2  Comparison 5 Long versus short duration chemotherapy (remission induction), Outcome 2 Event‐free survival. | ||||
| 3 Remission rate | 0 | Odds Ratio (M‐H, Fixed, 95% CI) | Totals not selected | |
| 4 Relapse | 0 | Odds Ratio (M‐H, Fixed, 95% CI) | Totals not selected | |
| 5 Toxicity and adverse events Show forest plot | 1 | 166 | Odds Ratio (M‐H, Fixed, 95% CI) | 0.14 [0.01, 2.78] |
| Analysis 5.5  Comparison 5 Long versus short duration chemotherapy (remission induction), Outcome 5 Toxicity and adverse events. | ||||
| Outcome or subgroup title | No. of studies | No. of participants | Statistical method | Effect size |
| 1 Overall survival | 0 | Odds Ratio (M‐H, Fixed, 95% CI) | Totals not selected | |
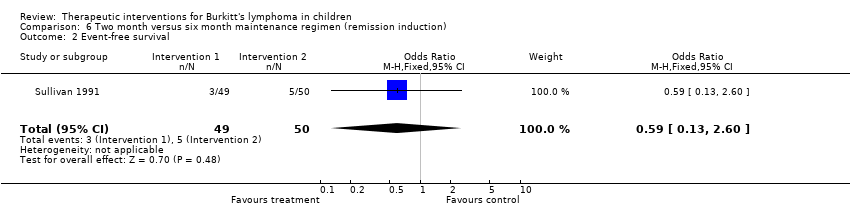
| 2 Event‐free survival Show forest plot | 1 | 99 | Odds Ratio (M‐H, Fixed, 95% CI) | 0.59 [0.13, 2.60] |
| Analysis 6.2  Comparison 6 Two month versus six month maintenance regimen (remission induction), Outcome 2 Event‐free survival. | ||||
| 3 Remission rate | 0 | Odds Ratio (M‐H, Fixed, 95% CI) | Totals not selected | |
| 4 Relapse | 0 | Odds Ratio (M‐H, Fixed, 95% CI) | Totals not selected | |
| 5 Toxicity and adverse events | 0 | Odds Ratio (M‐H, Fixed, 95% CI) | Totals not selected | |
| Outcome or subgroup title | No. of studies | No. of participants | Statistical method | Effect size |
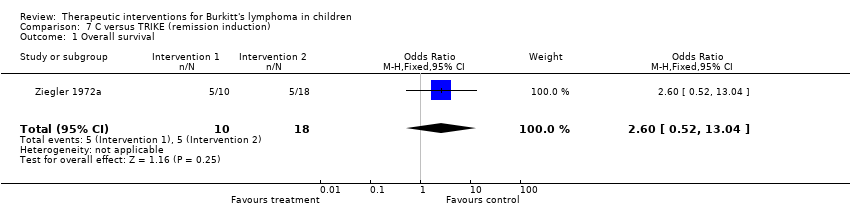
| 1 Overall survival Show forest plot | 1 | 28 | Odds Ratio (M‐H, Fixed, 95% CI) | 2.6 [0.52, 13.04] |
| Analysis 7.1  Comparison 7 C versus TRIKE (remission induction), Outcome 1 Overall survival. | ||||
| 2 Event‐free survival | 0 | Odds Ratio (M‐H, Fixed, 95% CI) | Totals not selected | |
| 3 Remission rate | 0 | Odds Ratio (M‐H, Fixed, 95% CI) | Totals not selected | |
| 4 Relapse Show forest plot | 1 | 28 | Odds Ratio (M‐H, Fixed, 95% CI) | 2.55 [0.41, 15.65] |
| Analysis 7.4  Comparison 7 C versus TRIKE (remission induction), Outcome 4 Relapse. | ||||
| 5 Toxicity and adverse events | 0 | Odds Ratio (M‐H, Fixed, 95% CI) | Totals not selected | |
| Outcome or subgroup title | No. of studies | No. of participants | Statistical method | Effect size |
| 1 Overall survival | 0 | Odds Ratio (M‐H, Fixed, 95% CI) | Totals not selected | |
| 2 Event‐free survival | 0 | Odds Ratio (M‐H, Fixed, 95% CI) | Totals not selected | |
| 3 Remission rate | 0 | Odds Ratio (M‐H, Fixed, 95% CI) | Totals not selected | |
| 4 Relapse Show forest plot | 1 | 26 | Odds Ratio (M‐H, Fixed, 95% CI) | 1.0 [0.21, 4.86] |
| Analysis 8.4  Comparison 8 CCNU versus no treatment (remission maintenance), Outcome 4 Relapse. | ||||
| 5 Toxicity and adverse events | 0 | Odds Ratio (M‐H, Fixed, 95% CI) | Totals not selected | |
| Outcome or subgroup title | No. of studies | No. of participants | Statistical method | Effect size |
| 1 Overall survival Show forest plot | 1 | 40 | Odds Ratio (M‐H, Fixed, 95% CI) | 1.12 [0.28, 4.51] |
| Analysis 9.1  Comparison 9 BCG versus no treatment (remission maintenance), Outcome 1 Overall survival. | ||||
| 2 Event‐free survival | 0 | Odds Ratio (M‐H, Fixed, 95% CI) | Totals not selected | |
| 3 Remission rate | 0 | Odds Ratio (M‐H, Fixed, 95% CI) | Totals not selected | |
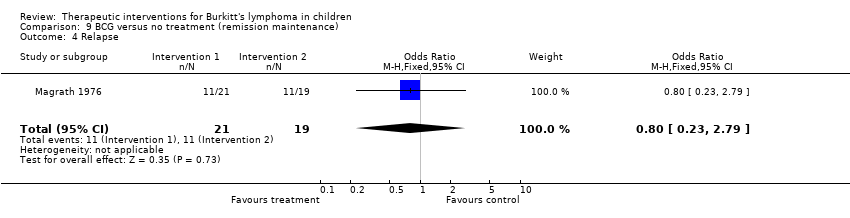
| 4 Relapse Show forest plot | 1 | 40 | Odds Ratio (M‐H, Fixed, 95% CI) | 0.8 [0.23, 2.79] |
| Analysis 9.4  Comparison 9 BCG versus no treatment (remission maintenance), Outcome 4 Relapse. | ||||
| 5 Toxicity and adverse events | 0 | Odds Ratio (M‐H, Fixed, 95% CI) | Totals not selected | |
| Outcome or subgroup title | No. of studies | No. of participants | Statistical method | Effect size |
| 1 Overall survival Show forest plot | 1 | 27 | Odds Ratio (M‐H, Fixed, 95% CI) | 0.38 [0.06, 2.52] |
| Analysis 10.1  Comparison 10 TF versus no treatment (remission maintenance), Outcome 1 Overall survival. | ||||
| 2 Event‐free survival | 0 | Odds Ratio (M‐H, Fixed, 95% CI) | Totals not selected | |
| 3 Remission rate | 0 | Odds Ratio (M‐H, Fixed, 95% CI) | Totals not selected | |
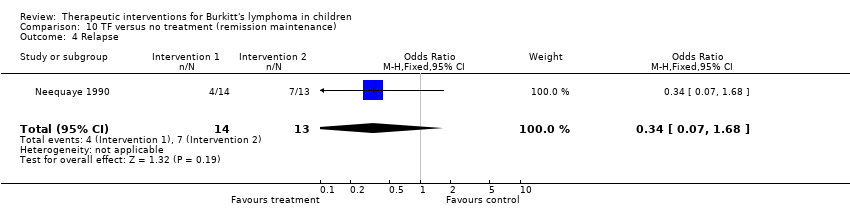
| 4 Relapse Show forest plot | 1 | 27 | Odds Ratio (M‐H, Fixed, 95% CI) | 0.34 [0.07, 1.68] |
| Analysis 10.4  Comparison 10 TF versus no treatment (remission maintenance), Outcome 4 Relapse. | ||||
| 5 Toxicity and adverse events | 0 | Odds Ratio (M‐H, Fixed, 95% CI) | Totals not selected | |
| Outcome or subgroup title | No. of studies | No. of participants | Statistical method | Effect size |
| 1 Overall survival Show forest plot | 1 | 22 | Odds Ratio (M‐H, Fixed, 95% CI) | 3.75 [0.32, 43.31] |
| Analysis 11.1  Comparison 11 Irradiation versus no treatment (remission maintenance), Outcome 1 Overall survival. | ||||
| 2 Event‐free survival | 0 | Odds Ratio (M‐H, Fixed, 95% CI) | Totals not selected | |
| 3 Remission rate | 0 | Odds Ratio (M‐H, Fixed, 95% CI) | Totals not selected | |
| 4 Relapse Show forest plot | 1 | 22 | Odds Ratio (M‐H, Fixed, 95% CI) | 2.1 [0.38, 11.59] |
| Analysis 11.4  Comparison 11 Irradiation versus no treatment (remission maintenance), Outcome 4 Relapse. | ||||
| 5 Toxicity and adverse events | 0 | Odds Ratio (M‐H, Fixed, 95% CI) | Totals not selected | |
| Outcome or subgroup title | No. of studies | No. of participants | Statistical method | Effect size |
| 1 Overall survival | 0 | Odds Ratio (M‐H, Fixed, 95% CI) | Totals not selected | |
| 2 Event‐free survival | 0 | Odds Ratio (M‐H, Fixed, 95% CI) | Totals not selected | |
| 3 Remission rate | 0 | Odds Ratio (M‐H, Fixed, 95% CI) | Totals not selected | |
| 4 Relapse Show forest plot | 1 | 20 | Odds Ratio (M‐H, Fixed, 95% CI) | 1.5 [0.26, 8.82] |
| Analysis 12.4  Comparison 12 Intrathecal MTX versus no treatment (remission maintenance), Outcome 4 Relapse. | ||||
| 5 Toxicity and adverse events | 0 | Odds Ratio (M‐H, Fixed, 95% CI) | Totals not selected | |
Comparison 2 Prespecified duration versus duration determined by clinical response (remission induction), Outcome 1 Overall survival.

Comparison 2 Prespecified duration versus duration determined by clinical response (remission induction), Outcome 2 Event‐free survival.
Comparison 2 Prespecified duration versus duration determined by clinical response (remission induction), Outcome 3 Remission rate.
Comparison 2 Prespecified duration versus duration determined by clinical response (remission induction), Outcome 4 Toxicity and adverse events.

Comparison 4 C versus combination chemotherapy (remission induction), Outcome 1 Overall survival.

Comparison 4 C versus combination chemotherapy (remission induction), Outcome 3 Remission rate.

Comparison 4 C versus combination chemotherapy (remission induction), Outcome 4 Relapse.
Comparison 5 Long versus short duration chemotherapy (remission induction), Outcome 1 Overall survival.

Comparison 5 Long versus short duration chemotherapy (remission induction), Outcome 2 Event‐free survival.

Comparison 5 Long versus short duration chemotherapy (remission induction), Outcome 5 Toxicity and adverse events.
Comparison 6 Two month versus six month maintenance regimen (remission induction), Outcome 2 Event‐free survival.
Comparison 7 C versus TRIKE (remission induction), Outcome 1 Overall survival.

Comparison 7 C versus TRIKE (remission induction), Outcome 4 Relapse.

Comparison 8 CCNU versus no treatment (remission maintenance), Outcome 4 Relapse.

Comparison 9 BCG versus no treatment (remission maintenance), Outcome 1 Overall survival.
Comparison 9 BCG versus no treatment (remission maintenance), Outcome 4 Relapse.

Comparison 10 TF versus no treatment (remission maintenance), Outcome 1 Overall survival.
Comparison 10 TF versus no treatment (remission maintenance), Outcome 4 Relapse.

Comparison 11 Irradiation versus no treatment (remission maintenance), Outcome 1 Overall survival.

Comparison 11 Irradiation versus no treatment (remission maintenance), Outcome 4 Relapse.

Comparison 12 Intrathecal MTX versus no treatment (remission maintenance), Outcome 4 Relapse.
| Study ID | Common treatment | Intervention 1 | intervention 2 |
| Anderson 1983 | C; 1.2g/m2 IV on D1, O; 2.0mg/m2(max 2mg) IV on D3,10,17 and 24, MTX; 6.25mg/m2 IT on D5, 31,34. P; 15mg/m2 (max 60mg) orally qds on D3‐30 decreasing to zero on D31‐3. | COMP | LSA2 L2 (modified) |
| Brecher 1997 | None | A | B |
| Cairo 2003 | Prephase: C: 0.3g/m2 IV, O; 1mg/m2 IV on D1; P: 60mg/m2 IV or orally in 2 fractions on D1‐7, MTX+HYD+Ara‐C: 30mg IT on D1,3 and 5. | Reduced intensity | Standard dose |
| Olweny 1976 | none | C: 40mg/kg IV on D1,repeated after 2 weeks or as soon as toxicity is abated | C: 30mg/kg IV on D1, O: 2mg/m2 IV on D1, MTX 15mg/m2 orally on D1‐3. This is repeated 12‐14 days later. |
| Patte 1991 | Reduction phase: C: 0.3g/m2 IV, O; 1mg/m2 IV on D1; P: 2mg/kg orally on D1‐7, MTX+HYD: 15mg/m2 IT on D1. | Long arm: | Short arm: |
| Sullivan 1991 | Induction: C: 1.2g/m2 Iv on D1, repeat on D1 of weeks 7 and 14; O: 2.0mg/m2(max 2.omg) IV on D2 or 3 weekly x4 then 1.0mg/m2 IV given 1 hour before MTX infusion; P: 60mg/m2(max 60mg) orally daily from D1 x28 days; MTX: 2 6‐hour infusion starting from week 3, starting dose 50mg/kg increasing to 100mg/kg then to 200mg/kg throughout the rest of the treatment, given as 2 doses every 7 weeks during induction and consolidation and every 6 weeks during maintenance; CFR: 15mg IV 3hourly x9 doses then 15mg 6 hourly x8 doses after each MTX infusion; | Maintenance regimen for 2 months | Maintenance regimen for 6 months |
| Ziegler 1971 | unclear | MTX 25mg/m2 IT alternating with Ara‐C 50mg /m2 IT every 4 days. Two dose of each drug was given | No intrathecal therapy |
| Ziegler 1972a | none | C: 40mg/kg IV at 2 weekly intervals for 6 doses | TRIKE schedule |
| Study | Comparison | Rx 1 | Rx 2/control |
| Brecher 1997 | Prespecified duration (1) versus duration determined by clinical response (2) | 29 | 21 |
| Olweny 1976 | C: 40mg/kg IV on D1,repeated after 2 weeks or as soon as toxicity is abated (1) versus C: 30mg/kg IV on D1, O: 2mg/m2 IV on D1, MTX 15mg/m2 orally on D1‐3. This is repeated 12‐14 days later (2) | 58 | 33 |
| Patte 1991 | Long duration chemotherapy (1) versus short duration chemotherapy (2) | 10 | 12 |
| Ziegler 1972a | C (1) versus TRIKE (2) | 50 | 28 |
| Study | Comparison | Rx 1 | Rx 2/control |
| Brecher 1997 | Prespecified duration (1) versus duration determined by clinical response (2) | 35 | 21 |
| Patte 1991 | Long duration chemotherapy (1) versus short duration chemotherapy (2) | 11 | 13 |
| Sullivan 1991 | Two (1) versus six (2) month duration of maintenance chemotherapy. | 6 | 10 |
| Study | Comparison | Rx 1 | Rx 2/control |
| Brecher 1997 | Prespecified duration (1) versus duration determined by clinical response (2) | 81 | 89 |
| Patte 91 | Long duration chemotherapy (1) versus short duration chemotherapy (2) | 87 | 89 |
| Olweny 76 | Irradiation (1) versus no treatment (2) | 83 | 84 |
| Study | Comparison | Rx 1 | Rx2/control |
| Brecher 1997 | Prespecified duration (1) versus duration determined by clinical response (2) | 15 | 15 |
| Olweny 1976 | C: 40mg/kg IV on D1,repeated after 2 weeks or as soon as toxicity is abated (1) versus C: 30mg/kg IV on D1, O: 2mg/m2 IV on D1, MTX 15mg/m2 orally on D1‐3. This is repeated 12‐14 days later (2) | 53 | 62 |
| Patte 1991 | Long duration chemotherapy (1) versus short duration chemotherapy (2) | 11 | 10 |
| Ziegler 1972a | C (1) versus TRIKE (2) | 80 | 61 |
| Study | Comparisons | Rx1 | Rx2/ control | type of toxicity |
| Brecher 1997 | Prespecified duration (1) versus duration determined by clinical response (2) | 74 | 96 | Grade 3 and 4 toxicity; haematologic, neurotoxic, infections |
| Patte 1991 | Long duration chemotherapy (1) versus short duration chemotherapy (2) | 0 | 4 | haematologic, multiorgan failure, infections |
| Study | Comparison | Rx 1 | Rx 2/control |
| Magrath 1976 | BCG (1) versus no treatment (2) | 29 | 26 |
| Neequaye 1990 | TF (1) versus no treatment (2) | 14 | 31 |
| Olweny 1977 | Irradiation (1) versus no treatment (2) | 27 | 9 |
| Study | Comparison | Rx 1 | Rx 2/control | type of relapse |
| Neequaye 1990 | TF (1) versus no treatment (2) | 28 | 54 | Not stated |
| Magrath 1976 | BCG (1) versus no treatment (2) | 52 | 58 | Central nervous system |
| Magrath 1973 | CCNU (1) versus no treatment (2) | 38 | 38 | Central nervous system |
| Olweny 1977 | Irradiation (1) versus no treatment (2) | 54 | 36 | Central nervous system |
| Ziegler 1971 | Intrathecal chemotherapy (MTX) (1) versus no treatment (2) | 50 | 40 | Central nervous system |
| Outcome or subgroup title | No. of studies | No. of participants | Statistical method | Effect size |
| 1 Overall survival | 0 | Odds Ratio (M‐H, Fixed, 95% CI) | Totals not selected | |
| 2 Event‐free survival | 0 | Odds Ratio (M‐H, Fixed, 95% CI) | Totals not selected | |
| 3 Remission rate | 0 | Odds Ratio (M‐H, Fixed, 95% CI) | Totals not selected | |
| 4 Relapse | 0 | Odds Ratio (M‐H, Fixed, 95% CI) | Totals not selected | |
| 5 Toxicity and adverse events | 0 | Odds Ratio (M‐H, Fixed, 95% CI) | Totals not selected |
| Outcome or subgroup title | No. of studies | No. of participants | Statistical method | Effect size |
| 1 Overall survival Show forest plot | 1 | 123 | Odds Ratio (M‐H, Fixed, 95% CI) | 1.58 [0.69, 3.63] |
| 2 Event‐free survival Show forest plot | 1 | 123 | Odds Ratio (M‐H, Fixed, 95% CI) | 2.10 [0.93, 4.74] |
| 3 Remission rate Show forest plot | 1 | 122 | Odds Ratio (M‐H, Fixed, 95% CI) | 0.24 [0.06, 0.89] |
| 4 Toxicity and adverse events Show forest plot | 1 | 123 | Odds Ratio (M‐H, Fixed, 95% CI) | 0.10 [0.02, 0.46] |
| Outcome or subgroup title | No. of studies | No. of participants | Statistical method | Effect size |
| 1 Overall survival | 0 | Odds Ratio (M‐H, Fixed, 95% CI) | Totals not selected | |
| 2 Event‐free survival | 0 | Odds Ratio (M‐H, Fixed, 95% CI) | Totals not selected | |
| 3 Remission rate | 0 | Odds Ratio (M‐H, Fixed, 95% CI) | Totals not selected | |
| 4 Relapse | 0 | Odds Ratio (M‐H, Fixed, 95% CI) | Totals not selected | |
| 5 Toxicity and adverse events | 0 | Odds Ratio (M‐H, Fixed, 95% CI) | Totals not selected |
| Outcome or subgroup title | No. of studies | No. of participants | Statistical method | Effect size |
| 1 Overall survival Show forest plot | 1 | 40 | Odds Ratio (M‐H, Fixed, 95% CI) | 2.75 [0.76, 9.95] |
| 2 Event‐free survival | 0 | Odds Ratio (M‐H, Fixed, 95% CI) | Totals not selected | |
| 3 Remission rate Show forest plot | 1 | 37 | Odds Ratio (M‐H, Fixed, 95% CI) | 0.94 [0.16, 5.39] |
| 4 Relapse Show forest plot | 1 | 31 | Odds Ratio (M‐H, Fixed, 95% CI) | 0.69 [0.16, 2.87] |
| 5 Toxicity and adverse events | 0 | Odds Ratio (M‐H, Fixed, 95% CI) | Totals not selected | |
| Outcome or subgroup title | No. of studies | No. of participants | Statistical method | Effect size |
| 1 Overall survival Show forest plot | 1 | 166 | Odds Ratio (M‐H, Fixed, 95% CI) | 0.8 [0.30, 2.14] |
| 2 Event‐free survival Show forest plot | 1 | 166 | Odds Ratio (M‐H, Fixed, 95% CI) | 1.17 [0.43, 3.20] |
| 3 Remission rate | 0 | Odds Ratio (M‐H, Fixed, 95% CI) | Totals not selected | |
| 4 Relapse | 0 | Odds Ratio (M‐H, Fixed, 95% CI) | Totals not selected | |
| 5 Toxicity and adverse events Show forest plot | 1 | 166 | Odds Ratio (M‐H, Fixed, 95% CI) | 0.14 [0.01, 2.78] |
| Outcome or subgroup title | No. of studies | No. of participants | Statistical method | Effect size |
| 1 Overall survival | 0 | Odds Ratio (M‐H, Fixed, 95% CI) | Totals not selected | |
| 2 Event‐free survival Show forest plot | 1 | 99 | Odds Ratio (M‐H, Fixed, 95% CI) | 0.59 [0.13, 2.60] |
| 3 Remission rate | 0 | Odds Ratio (M‐H, Fixed, 95% CI) | Totals not selected | |
| 4 Relapse | 0 | Odds Ratio (M‐H, Fixed, 95% CI) | Totals not selected | |
| 5 Toxicity and adverse events | 0 | Odds Ratio (M‐H, Fixed, 95% CI) | Totals not selected | |
| Outcome or subgroup title | No. of studies | No. of participants | Statistical method | Effect size |
| 1 Overall survival Show forest plot | 1 | 28 | Odds Ratio (M‐H, Fixed, 95% CI) | 2.6 [0.52, 13.04] |
| 2 Event‐free survival | 0 | Odds Ratio (M‐H, Fixed, 95% CI) | Totals not selected | |
| 3 Remission rate | 0 | Odds Ratio (M‐H, Fixed, 95% CI) | Totals not selected | |
| 4 Relapse Show forest plot | 1 | 28 | Odds Ratio (M‐H, Fixed, 95% CI) | 2.55 [0.41, 15.65] |
| 5 Toxicity and adverse events | 0 | Odds Ratio (M‐H, Fixed, 95% CI) | Totals not selected | |
| Outcome or subgroup title | No. of studies | No. of participants | Statistical method | Effect size |
| 1 Overall survival | 0 | Odds Ratio (M‐H, Fixed, 95% CI) | Totals not selected | |
| 2 Event‐free survival | 0 | Odds Ratio (M‐H, Fixed, 95% CI) | Totals not selected | |
| 3 Remission rate | 0 | Odds Ratio (M‐H, Fixed, 95% CI) | Totals not selected | |
| 4 Relapse Show forest plot | 1 | 26 | Odds Ratio (M‐H, Fixed, 95% CI) | 1.0 [0.21, 4.86] |
| 5 Toxicity and adverse events | 0 | Odds Ratio (M‐H, Fixed, 95% CI) | Totals not selected | |
| Outcome or subgroup title | No. of studies | No. of participants | Statistical method | Effect size |
| 1 Overall survival Show forest plot | 1 | 40 | Odds Ratio (M‐H, Fixed, 95% CI) | 1.12 [0.28, 4.51] |
| 2 Event‐free survival | 0 | Odds Ratio (M‐H, Fixed, 95% CI) | Totals not selected | |
| 3 Remission rate | 0 | Odds Ratio (M‐H, Fixed, 95% CI) | Totals not selected | |
| 4 Relapse Show forest plot | 1 | 40 | Odds Ratio (M‐H, Fixed, 95% CI) | 0.8 [0.23, 2.79] |
| 5 Toxicity and adverse events | 0 | Odds Ratio (M‐H, Fixed, 95% CI) | Totals not selected | |
| Outcome or subgroup title | No. of studies | No. of participants | Statistical method | Effect size |
| 1 Overall survival Show forest plot | 1 | 27 | Odds Ratio (M‐H, Fixed, 95% CI) | 0.38 [0.06, 2.52] |
| 2 Event‐free survival | 0 | Odds Ratio (M‐H, Fixed, 95% CI) | Totals not selected | |
| 3 Remission rate | 0 | Odds Ratio (M‐H, Fixed, 95% CI) | Totals not selected | |
| 4 Relapse Show forest plot | 1 | 27 | Odds Ratio (M‐H, Fixed, 95% CI) | 0.34 [0.07, 1.68] |
| 5 Toxicity and adverse events | 0 | Odds Ratio (M‐H, Fixed, 95% CI) | Totals not selected | |
| Outcome or subgroup title | No. of studies | No. of participants | Statistical method | Effect size |
| 1 Overall survival Show forest plot | 1 | 22 | Odds Ratio (M‐H, Fixed, 95% CI) | 3.75 [0.32, 43.31] |
| 2 Event‐free survival | 0 | Odds Ratio (M‐H, Fixed, 95% CI) | Totals not selected | |
| 3 Remission rate | 0 | Odds Ratio (M‐H, Fixed, 95% CI) | Totals not selected | |
| 4 Relapse Show forest plot | 1 | 22 | Odds Ratio (M‐H, Fixed, 95% CI) | 2.1 [0.38, 11.59] |
| 5 Toxicity and adverse events | 0 | Odds Ratio (M‐H, Fixed, 95% CI) | Totals not selected | |
| Outcome or subgroup title | No. of studies | No. of participants | Statistical method | Effect size |
| 1 Overall survival | 0 | Odds Ratio (M‐H, Fixed, 95% CI) | Totals not selected | |
| 2 Event‐free survival | 0 | Odds Ratio (M‐H, Fixed, 95% CI) | Totals not selected | |
| 3 Remission rate | 0 | Odds Ratio (M‐H, Fixed, 95% CI) | Totals not selected | |
| 4 Relapse Show forest plot | 1 | 20 | Odds Ratio (M‐H, Fixed, 95% CI) | 1.5 [0.26, 8.82] |
| 5 Toxicity and adverse events | 0 | Odds Ratio (M‐H, Fixed, 95% CI) | Totals not selected | |