Antibióticos para la bronquiolitis en niños
Referencias
Referencias de los estudios incluidos en esta revisión
Referencias de los estudios excluidos de esta revisión
Referencias adicionales
Characteristics of studies
Characteristics of included studies [ordered by study ID]
Ir a:
| Methods | Randomised controlled trial | |
| Participants | Babies | |
| Interventions | Ampicillin | |
| Outcomes | Length of hospital stay | |
| Notes | ||
| Risk of bias | ||
| Bias | Authors' judgement | Support for judgement |
| Random sequence generation (selection bias) | Low risk | Randomised |
| Blinding (performance bias and detection bias) | Low risk | Patients were blinded but not doctors nor outcome assessors |
| Incomplete outcome data (attrition bias) | High risk | No intention‐to‐treat analysis but withdrawal rates were acceptable |
| Selective reporting (reporting bias) | Low risk | |
| Methods | Randomised controlled trial | |
| Participants | Children under 2 years of age with clinical suspected bronchiolitis | |
| Interventions | IV ampicillin (parenteral ampicillin 50 mg/kg/6‐hourly + supportive care), oral erythromycin (oral erythromycin 10 mg/kg 6‐hourly + supportive care), control | |
| Outcomes | Respiratory rate, oxygen saturation, wheeze, fever, length of hospital stay, shortness of breath | |
| Notes | ||
| Risk of bias | ||
| Bias | Authors' judgement | Support for judgement |
| Random sequence generation (selection bias) | Low risk | Random number table |
| Allocation concealment (selection bias) | Unclear risk | Not described |
| Blinding (performance bias and detection bias) | High risk | Seems unlikely, not described |
| Incomplete outcome data (attrition bias) | Low risk | 32 participants dropped out (10%), 17 were referred to paediatric intensive care and 15 withdrew from the study or left the recruiting hospitals |
| Selective reporting (reporting bias) | High risk | |
| Methods | Double‐blinded, placebo‐controlled, randomised controlled trial | |
| Participants | Hospitalised infants younger than 24 months with clinically‐confirmed viral lower respiratory tract infection | |
| Interventions | Azithromycin 10 mg/kg/day, once daily for 3 days | |
| Outcomes | Respiratory rate, accessory muscle use, malaise severity, disease complications, use of alternative therapies, length of hospital stay, length of intensive care stay, deaths, need for NG feeding | |
| Notes | ||
| Risk of bias | ||
| Bias | Authors' judgement | Support for judgement |
| Random sequence generation (selection bias) | Low risk | Adequate block randomisation |
| Allocation concealment (selection bias) | Low risk | |
| Blinding (performance bias and detection bias) | Low risk | Participants and doctors |
| Incomplete outcome data (attrition bias) | Low risk | No loss to follow up |
| Selective reporting (reporting bias) | Low risk | |
| Other bias | Low risk | |
| Methods | Randomised controlled trial | |
| Participants | Children aged 1 month to 2 years presenting to an outpatients department in a teaching hospital | |
| Interventions | Supportive management, supportive management plus IV ampicillin, supportive management plus oral erythromycin | |
| Outcomes | Breathing difficulty, feeding difficulty, social smile, tachypnoea, hypoxia, wheeze, rhonchi, crepitation, WBC, Hb, ESR, CRP, X‐ray, rate of recovery | |
| Notes | ||
| Risk of bias | ||
| Bias | Authors' judgement | Support for judgement |
| Random sequence generation (selection bias) | High risk | Odds and evens |
| Allocation concealment (selection bias) | Unclear risk | Not discussed |
| Blinding (performance bias and detection bias) | Unclear risk | Not specified |
| Selective reporting (reporting bias) | Unclear risk | Unsure |
| Methods | Double‐blind, randomised controlled trial | |
| Participants | Infants less than or equal to 7 months with immunologically confirmed RSV infection admitted to 1 hospital | |
| Interventions | Clarithromycin 15 mg/kg/day, once daily for 3 weeks | |
| Outcomes | Respiratory rate, wheeze, use of supplemental oxygen, cyanosis, hospital admission, length of stay | |
| Notes | ||
| Risk of bias | ||
| Bias | Authors' judgement | Support for judgement |
| Random sequence generation (selection bias) | Unclear risk | "... infants were randomized by a single study nurse..." "Simple randomisation was used" |
| Allocation concealment (selection bias) | Unclear risk | Allocation after enrolment by study nurse |
| Blinding (performance bias and detection bias) | Low risk | Blinding of patients and investigators |
| Incomplete outcome data (attrition bias) | Unclear risk | 30 patients were randomised, however 9 were later excluded as they received corticosteroid therapy |
| Selective reporting (reporting bias) | Unclear risk | Unsure if trial was registered |
| Other bias | Unclear risk | Unsure if there were any conflicts of interest |
CRP: C reactive protein
ESR: erythrocyte sedimentation rate
Hb: haemoglobin
IV: intravenous
NG: nasogastric
RSV: respiratory syncytial virus
WBC: white blood count
Characteristics of excluded studies [ordered by study ID]
Ir a:
| Study | Reason for exclusion |
| Did not study antibiotics | |
| The patient selection criteria were fine crepitations or consolidation on chest radiograph which was not consistent with our inclusion criteria of a purely clinical presentation of bronchiolitis |
Data and analyses
| Outcome or subgroup title | No. of studies | No. of participants | Statistical method | Effect size |
| 1 Duration of symptoms Show forest plot | 2 | 123 | Mean Difference (IV, Fixed, 95% CI) | 0.32 [‐1.14, 1.78] |
| Analysis 1.1  Comparison 1 Length of symptoms (not specified), Outcome 1 Duration of symptoms. | ||||
| 2 Duration of fever (days) Show forest plot | 1 | 71 | Mean Difference (IV, Fixed, 95% CI) | 0.47 [‐0.12, 1.06] |
| Analysis 1.2  Comparison 1 Length of symptoms (not specified), Outcome 2 Duration of fever (days). | ||||
| Outcome or subgroup title | No. of studies | No. of participants | Statistical method | Effect size |
| 1 Deaths Show forest plot | 5 | 543 | Odds Ratio (M‐H, Fixed, 95% CI) | 0.0 [0.0, 0.0] |
| Analysis 2.1  Comparison 2 Death, Outcome 1 Deaths. | ||||
| Outcome or subgroup title | No. of studies | No. of participants | Statistical method | Effect size |
| 1 Length of hospital stay Show forest plot | 3 | 288 | Mean Difference (IV, Random, 95% CI) | 0.34 [‐0.71, 1.38] |
| Analysis 3.1  Comparison 3 Length of hospital stay, Outcome 1 Length of hospital stay. | ||||
| Outcome or subgroup title | No. of studies | No. of participants | Statistical method | Effect size |
| 1 Use of alternative therapy Show forest plot | 1 | Odds Ratio (M‐H, Fixed, 95% CI) | Totals not selected | |
| Analysis 4.1  Comparison 4 Use of alternative therapy, Outcome 1 Use of alternative therapy. | ||||
| 1.1 Oxygen | 1 | Odds Ratio (M‐H, Fixed, 95% CI) | 0.0 [0.0, 0.0] | |
| 1.2 Bronchodilator use | 1 | Odds Ratio (M‐H, Fixed, 95% CI) | 0.0 [0.0, 0.0] | |
| 1.3 Corticosteroid use | 1 | Odds Ratio (M‐H, Fixed, 95% CI) | 0.0 [0.0, 0.0] | |
| 1.4 Naso‐gastric feeding | 1 | Odds Ratio (M‐H, Fixed, 95% CI) | 0.0 [0.0, 0.0] | |
| 2 Duration of bronchodilator use Show forest plot | 1 | 71 | Mean Difference (IV, Fixed, 95% CI) | ‐0.17 [‐1.25, 0.91] |
| Analysis 4.2  Comparison 4 Use of alternative therapy, Outcome 2 Duration of bronchodilator use. | ||||
| 3 Days of supplementary oxygen Show forest plot | 1 | 71 | Mean Difference (IV, Fixed, 95% CI) | 0.36 [‐0.46, 1.18] |
| Analysis 4.3  Comparison 4 Use of alternative therapy, Outcome 3 Days of supplementary oxygen. | ||||
| 4 Days of tube feeding Show forest plot | 1 | 71 | Mean Difference (IV, Fixed, 95% CI) | 0.07 [‐0.98, 1.12] |
| Analysis 4.4  Comparison 4 Use of alternative therapy, Outcome 4 Days of tube feeding. | ||||
| Outcome or subgroup title | No. of studies | No. of participants | Statistical method | Effect size |
| 1 PICU admission Show forest plot | 1 | 71 | Odds Ratio (M‐H, Fixed, 95% CI) | 0.39 [0.02, 10.03] |
| Analysis 5.1  Comparison 5 PICU admission, Outcome 1 PICU admission. | ||||
| Outcome or subgroup title | No. of studies | No. of participants | Statistical method | Effect size |
| 1 Re‐admission Show forest plot | 1 | 21 | Odds Ratio (M‐H, Fixed, 95% CI) | 0.11 [0.01, 1.29] |
| Analysis 6.1  Comparison 6 Re‐admission, Outcome 1 Re‐admission. | ||||
| Outcome or subgroup title | No. of studies | No. of participants | Statistical method | Effect size |
| 1 Wheeze Show forest plot | 2 | Odds Ratio (M‐H, Fixed, 95% CI) | Totals not selected | |
| Analysis 7.1  Comparison 7 Symptoms, Outcome 1 Wheeze. | ||||
| 1.1 Day 1 | 1 | Odds Ratio (M‐H, Fixed, 95% CI) | 0.0 [0.0, 0.0] | |
| 1.2 Day 3 | 1 | Odds Ratio (M‐H, Fixed, 95% CI) | 0.0 [0.0, 0.0] | |
| 1.3 Day 5 | 1 | Odds Ratio (M‐H, Fixed, 95% CI) | 0.0 [0.0, 0.0] | |
| 1.4 Day 7 | 1 | Odds Ratio (M‐H, Fixed, 95% CI) | 0.0 [0.0, 0.0] | |
| 2 Shortness of breath Show forest plot | 2 | Odds Ratio (M‐H, Fixed, 95% CI) | Totals not selected | |
| Analysis 7.2  Comparison 7 Symptoms, Outcome 2 Shortness of breath. | ||||
| 2.1 Day 1 | 1 | Odds Ratio (M‐H, Fixed, 95% CI) | 0.0 [0.0, 0.0] | |
| 2.2 Day 3 | 1 | Odds Ratio (M‐H, Fixed, 95% CI) | 0.0 [0.0, 0.0] | |
| 2.3 Day 5 | 1 | Odds Ratio (M‐H, Fixed, 95% CI) | 0.0 [0.0, 0.0] | |
| 2.4 Day 7 | 1 | Odds Ratio (M‐H, Fixed, 95% CI) | 0.0 [0.0, 0.0] | |
| 3 Oxygen saturation (< 96%) Show forest plot | 1 | Odds Ratio (M‐H, Fixed, 95% CI) | Totals not selected | |
| Analysis 7.3  Comparison 7 Symptoms, Outcome 3 Oxygen saturation (< 96%). | ||||
| 3.1 Day 1 | 1 | Odds Ratio (M‐H, Fixed, 95% CI) | 0.0 [0.0, 0.0] | |
| 3.2 Day 3 | 1 | Odds Ratio (M‐H, Fixed, 95% CI) | 0.0 [0.0, 0.0] | |
| 3.3 Day 5 | 1 | Odds Ratio (M‐H, Fixed, 95% CI) | 0.0 [0.0, 0.0] | |
| 4 Not smiling socially Show forest plot | 1 | Odds Ratio (M‐H, Fixed, 95% CI) | Totals not selected | |
| Analysis 7.4  Comparison 7 Symptoms, Outcome 4 Not smiling socially. | ||||
| 4.1 Day 1 | 1 | Odds Ratio (M‐H, Fixed, 95% CI) | 0.0 [0.0, 0.0] | |
| 4.2 Day 3 | 1 | Odds Ratio (M‐H, Fixed, 95% CI) | 0.0 [0.0, 0.0] | |
| 4.3 Day 5 | 1 | Odds Ratio (M‐H, Fixed, 95% CI) | 0.0 [0.0, 0.0] | |
| 5 Feeding difficulties Show forest plot | 1 | Odds Ratio (M‐H, Fixed, 95% CI) | Totals not selected | |
| Analysis 7.5  Comparison 7 Symptoms, Outcome 5 Feeding difficulties. | ||||
| 5.1 Day 1 | 1 | Odds Ratio (M‐H, Fixed, 95% CI) | 0.0 [0.0, 0.0] | |
| 5.2 Day 3 | 1 | Odds Ratio (M‐H, Fixed, 95% CI) | 0.0 [0.0, 0.0] | |
| 5.3 Day 5 | 1 | Odds Ratio (M‐H, Fixed, 95% CI) | 0.0 [0.0, 0.0] | |
| 6 Fever Show forest plot | 1 | Odds Ratio (M‐H, Fixed, 95% CI) | Totals not selected | |
| Analysis 7.6  Comparison 7 Symptoms, Outcome 6 Fever. | ||||
| 6.1 Day 2 | 1 | Odds Ratio (M‐H, Fixed, 95% CI) | 0.0 [0.0, 0.0] | |
| 7 Cough Show forest plot | 1 | Odds Ratio (M‐H, Fixed, 95% CI) | Totals not selected | |
| Analysis 7.7  Comparison 7 Symptoms, Outcome 7 Cough. | ||||
| 7.1 Day 7 | 1 | Odds Ratio (M‐H, Fixed, 95% CI) | 0.0 [0.0, 0.0] | |

Methodological quality summary: review authors' judgements about each methodological quality item for each included study.

Methodological quality graph: review authors' judgements about each methodological quality item presented as percentages across all included studies.

Comparison 1 Length of symptoms (not specified), Outcome 1 Duration of symptoms.
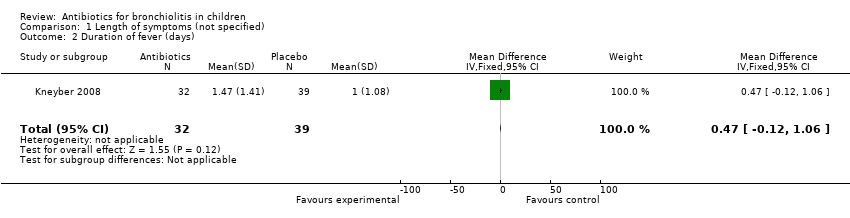
Comparison 1 Length of symptoms (not specified), Outcome 2 Duration of fever (days).

Comparison 2 Death, Outcome 1 Deaths.

Comparison 3 Length of hospital stay, Outcome 1 Length of hospital stay.

Comparison 4 Use of alternative therapy, Outcome 1 Use of alternative therapy.

Comparison 4 Use of alternative therapy, Outcome 2 Duration of bronchodilator use.

Comparison 4 Use of alternative therapy, Outcome 3 Days of supplementary oxygen.

Comparison 4 Use of alternative therapy, Outcome 4 Days of tube feeding.

Comparison 5 PICU admission, Outcome 1 PICU admission.

Comparison 6 Re‐admission, Outcome 1 Re‐admission.

Comparison 7 Symptoms, Outcome 1 Wheeze.
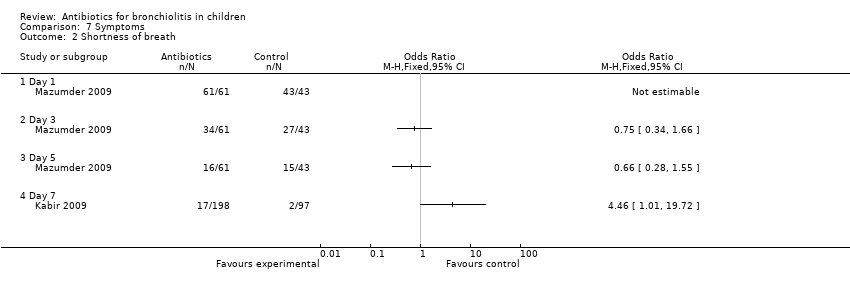
Comparison 7 Symptoms, Outcome 2 Shortness of breath.
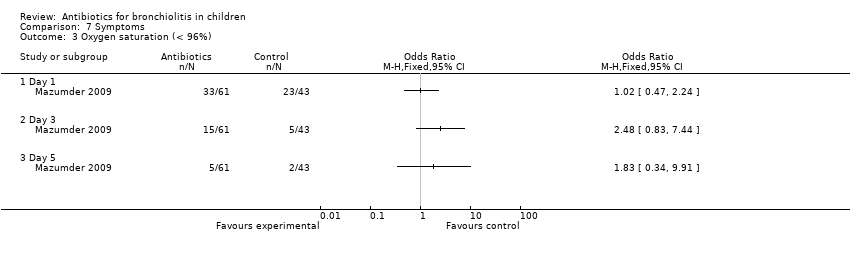
Comparison 7 Symptoms, Outcome 3 Oxygen saturation (< 96%).

Comparison 7 Symptoms, Outcome 4 Not smiling socially.
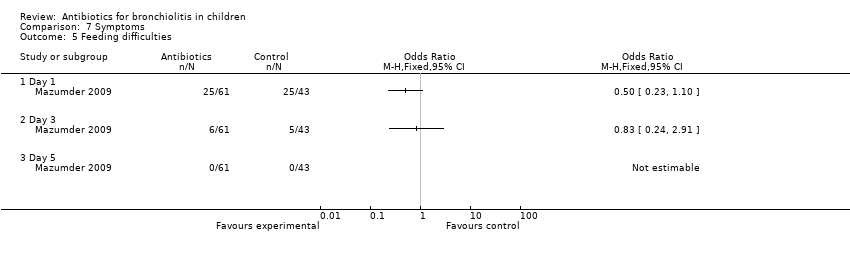
Comparison 7 Symptoms, Outcome 5 Feeding difficulties.

Comparison 7 Symptoms, Outcome 6 Fever.

Comparison 7 Symptoms, Outcome 7 Cough.
| Variable | Azithromycin (n = 32) | Placebo (n = 39) | Outcome | Significance level |
| Days of symptoms | 4.94 (SD 3.78) | 4.62 (SD 2.05) | Mean difference 0.32 (95% CI ‐1.14 to 1.78) | P = 0.65 |
| Days in hospital | 5.5 (SD 2.54) | 5.82 (SD 1.98) | Mean difference ‐0.32 (95% CI ‐1.40 to 0.76) | P = 0.56 |
| Duration of fever (days) | 1.47 (SD 1.41) | 1.00 (SD 1.08) | Mean difference 0.47 (95% CI ‐0.12 to 1.06) | P = 0.12 |
| Duration of bronchodilator use | 2.79 (SD 2.49) | 2.96 (SD 2.06) | Mean difference ‐0.17 (95% CI ‐1.25 to 0.91) | P = 0.81 |
| Bronchodilator use | 17 | 23 | Odds ratio 0.79 (95% CI 0.31 to 2.02) | P = 0.62 |
| Supplementary oxygen | 20 (62.5%) | 31 (79.49%) | Odds ratio 0.43 (95% CI 0.15 to 1.24) | P = 0.11 |
| Days of extra oxygen | 3.75 (SD 1.74) | 3.39 (SD 1.78) | Mean difference 0.36 (95% CI ‐0.46 to 1.18) | P = 0.48 |
| PICU admission | 0 (0%) | 1 (2.56%) | Odds ratio 0.39 (95% CI 0.02 to 10.03) | P = 1.00 |
| Tube feeding | 16 (50.00%) | 16 (41.03%) | Odds ratio 1.44 (95% CI 0.56 to 3.69) | P = 0.45 |
| Days of tube feeding | 1.90 (SD 2.13) | 1.83 (SD 2.36) | Mean difference 0.07 (95% CI ‐0.98 to 1.12) | P = 0.90 |
| PICU: paediatric intensive care unit | ||||
| Variable | Day 1 | Outcome | Day 3 | Outcome | Day 5 | Outcome | ||||||
| IV ampicillin | Oral erythromycin | Control | Chi2 test (P value) | IV ampicillin | Oral erythromycin | Control | Chi2 test (P value) | IV ampicillin | Oral erythromycin | Control | Chi2 test (P value) | |
| Wheeze | 29/29 (100%) | 32/32 (100%) | 43/43 (100%) | N/A | 16/29 (55%) | 2/32 (6%) | 26/43 (60%) | 24.82 (P < 0.001) | 6/29 (21%) | 7/32 (22%) | 2/43 (5%) | 5.69 (P = 0.058) |
| Shortness of breath | 29/29 (100%) | 32/32 (100%) | 43/43 (100%) | N/A | 18/29 (62%) | 16/32 (50%) | 27/43 (63%) | 1.97 (P = 0.37) | 8/29 (28%) | 8/32 (25%) | 15/43 (35%) | 0.95 (P = 0.62) |
| Oxygen saturation (< 96%) | 18/29 (62%) | 15/32 (47%) | 23/43 (53%) | 1.42 (P = 0.49) | 8/29 (28%) | 7/32 (22%) | 5/43 (12%) | 3.05 (P = 0.22) | 2/29 (7%) | 3/32 (9%) | 2/43 (5%) | 0.65 (P = 0.72) |
| Not smiling socially | 19/29 (66%) | 21/32 (66%) | 30/43 (70%) | 0.20 (P = 0.90) | 3/29 (10%) | 3/32 (9%) | 5/43 (12%) | 0.10 (P = 0.95) | 0/29 (0%) | 0/32 (0%) | 0/43 (0%) | N/A |
| Feeding difficulty | 12/29 (41%) | 13/32 (41%) | 25/43 (58%) | 2.98 (P = 0.23) | 3/29 (10%) | 3/32 (9%) | 5/43 (12%) | 0.10 (P = 0.95) | 0/29 (0%) | 0/32 (0%) | 0/43 (0%) | N/A |
| IV: intravenous | ||||||||||||
| Variable | Intervention | Outcome | ||
| IV ampicillin | Oral erythromycin | Control | Chi2 test (P value) | |
| Day 2 | ||||
| Oxygen sats (< 90%) | 2/99 (2%) | 6/99 (6%) | 6/97 (6%) | 2.45 (P = 0.29) |
| Fever | 5/99 (5%) | 6/99 (6%) | 4/97 (4%) | 0.38 (P = 0.83) |
| Day 7 | ||||
| Wheeze | 8/99 (8%) | 9/99 (9%) | 4/97 (4%) | 2.04 (P = 0.36) |
| Shortness of breath | 8/99 (8%) | 9/99 (9%) | 2/97 (2%) | 4.68 (P = 0.10) |
| Cough | 10/99 (10%) | 9/99 (9%) | 3/97 (3%) | 4.06 (P = 0.13) |
| IV: intravenous | ||||
| Outcome or subgroup title | No. of studies | No. of participants | Statistical method | Effect size |
| 1 Duration of symptoms Show forest plot | 2 | 123 | Mean Difference (IV, Fixed, 95% CI) | 0.32 [‐1.14, 1.78] |
| 2 Duration of fever (days) Show forest plot | 1 | 71 | Mean Difference (IV, Fixed, 95% CI) | 0.47 [‐0.12, 1.06] |
| Outcome or subgroup title | No. of studies | No. of participants | Statistical method | Effect size |
| 1 Deaths Show forest plot | 5 | 543 | Odds Ratio (M‐H, Fixed, 95% CI) | 0.0 [0.0, 0.0] |
| Outcome or subgroup title | No. of studies | No. of participants | Statistical method | Effect size |
| 1 Length of hospital stay Show forest plot | 3 | 288 | Mean Difference (IV, Random, 95% CI) | 0.34 [‐0.71, 1.38] |
| Outcome or subgroup title | No. of studies | No. of participants | Statistical method | Effect size |
| 1 Use of alternative therapy Show forest plot | 1 | Odds Ratio (M‐H, Fixed, 95% CI) | Totals not selected | |
| 1.1 Oxygen | 1 | Odds Ratio (M‐H, Fixed, 95% CI) | 0.0 [0.0, 0.0] | |
| 1.2 Bronchodilator use | 1 | Odds Ratio (M‐H, Fixed, 95% CI) | 0.0 [0.0, 0.0] | |
| 1.3 Corticosteroid use | 1 | Odds Ratio (M‐H, Fixed, 95% CI) | 0.0 [0.0, 0.0] | |
| 1.4 Naso‐gastric feeding | 1 | Odds Ratio (M‐H, Fixed, 95% CI) | 0.0 [0.0, 0.0] | |
| 2 Duration of bronchodilator use Show forest plot | 1 | 71 | Mean Difference (IV, Fixed, 95% CI) | ‐0.17 [‐1.25, 0.91] |
| 3 Days of supplementary oxygen Show forest plot | 1 | 71 | Mean Difference (IV, Fixed, 95% CI) | 0.36 [‐0.46, 1.18] |
| 4 Days of tube feeding Show forest plot | 1 | 71 | Mean Difference (IV, Fixed, 95% CI) | 0.07 [‐0.98, 1.12] |
| Outcome or subgroup title | No. of studies | No. of participants | Statistical method | Effect size |
| 1 PICU admission Show forest plot | 1 | 71 | Odds Ratio (M‐H, Fixed, 95% CI) | 0.39 [0.02, 10.03] |
| Outcome or subgroup title | No. of studies | No. of participants | Statistical method | Effect size |
| 1 Re‐admission Show forest plot | 1 | 21 | Odds Ratio (M‐H, Fixed, 95% CI) | 0.11 [0.01, 1.29] |
| Outcome or subgroup title | No. of studies | No. of participants | Statistical method | Effect size |
| 1 Wheeze Show forest plot | 2 | Odds Ratio (M‐H, Fixed, 95% CI) | Totals not selected | |
| 1.1 Day 1 | 1 | Odds Ratio (M‐H, Fixed, 95% CI) | 0.0 [0.0, 0.0] | |
| 1.2 Day 3 | 1 | Odds Ratio (M‐H, Fixed, 95% CI) | 0.0 [0.0, 0.0] | |
| 1.3 Day 5 | 1 | Odds Ratio (M‐H, Fixed, 95% CI) | 0.0 [0.0, 0.0] | |
| 1.4 Day 7 | 1 | Odds Ratio (M‐H, Fixed, 95% CI) | 0.0 [0.0, 0.0] | |
| 2 Shortness of breath Show forest plot | 2 | Odds Ratio (M‐H, Fixed, 95% CI) | Totals not selected | |
| 2.1 Day 1 | 1 | Odds Ratio (M‐H, Fixed, 95% CI) | 0.0 [0.0, 0.0] | |
| 2.2 Day 3 | 1 | Odds Ratio (M‐H, Fixed, 95% CI) | 0.0 [0.0, 0.0] | |
| 2.3 Day 5 | 1 | Odds Ratio (M‐H, Fixed, 95% CI) | 0.0 [0.0, 0.0] | |
| 2.4 Day 7 | 1 | Odds Ratio (M‐H, Fixed, 95% CI) | 0.0 [0.0, 0.0] | |
| 3 Oxygen saturation (< 96%) Show forest plot | 1 | Odds Ratio (M‐H, Fixed, 95% CI) | Totals not selected | |
| 3.1 Day 1 | 1 | Odds Ratio (M‐H, Fixed, 95% CI) | 0.0 [0.0, 0.0] | |
| 3.2 Day 3 | 1 | Odds Ratio (M‐H, Fixed, 95% CI) | 0.0 [0.0, 0.0] | |
| 3.3 Day 5 | 1 | Odds Ratio (M‐H, Fixed, 95% CI) | 0.0 [0.0, 0.0] | |
| 4 Not smiling socially Show forest plot | 1 | Odds Ratio (M‐H, Fixed, 95% CI) | Totals not selected | |
| 4.1 Day 1 | 1 | Odds Ratio (M‐H, Fixed, 95% CI) | 0.0 [0.0, 0.0] | |
| 4.2 Day 3 | 1 | Odds Ratio (M‐H, Fixed, 95% CI) | 0.0 [0.0, 0.0] | |
| 4.3 Day 5 | 1 | Odds Ratio (M‐H, Fixed, 95% CI) | 0.0 [0.0, 0.0] | |
| 5 Feeding difficulties Show forest plot | 1 | Odds Ratio (M‐H, Fixed, 95% CI) | Totals not selected | |
| 5.1 Day 1 | 1 | Odds Ratio (M‐H, Fixed, 95% CI) | 0.0 [0.0, 0.0] | |
| 5.2 Day 3 | 1 | Odds Ratio (M‐H, Fixed, 95% CI) | 0.0 [0.0, 0.0] | |
| 5.3 Day 5 | 1 | Odds Ratio (M‐H, Fixed, 95% CI) | 0.0 [0.0, 0.0] | |
| 6 Fever Show forest plot | 1 | Odds Ratio (M‐H, Fixed, 95% CI) | Totals not selected | |
| 6.1 Day 2 | 1 | Odds Ratio (M‐H, Fixed, 95% CI) | 0.0 [0.0, 0.0] | |
| 7 Cough Show forest plot | 1 | Odds Ratio (M‐H, Fixed, 95% CI) | Totals not selected | |
| 7.1 Day 7 | 1 | Odds Ratio (M‐H, Fixed, 95% CI) | 0.0 [0.0, 0.0] | |