Antibiotics for bronchiolitis in children under two years of age
Abstract
Background
Bronchiolitis is a serious, potentially life‐threatening respiratory illness commonly affecting babies. It is often caused by respiratory syncytial virus (RSV). Antibiotics are not recommended for bronchiolitis unless there is concern about complications such as secondary bacterial pneumonia or respiratory failure. Nevertheless, they are often used.
Objectives
To evaluate the effectiveness of antibiotics for bronchiolitis in children under two years of age compared to placebo or other interventions.
Search methods
We searched the Cochrane Central Register of Controlled Trials (CENTRAL 2014, Issue 6), which includes the Cochrane Acute Respiratory Infection Group's Specialised Register, and the Database of Abstracts of Reviews of Effects, MEDLINE (1966 to June 2014), EMBASE (1990 to June 2014) and Current Contents (2001 to June 2014).
Selection criteria
Randomised controlled trials (RCTs) comparing antibiotics to placebo in children under two years diagnosed with bronchiolitis, using clinical criteria (including respiratory distress preceded by coryzal symptoms with or without fever). Primary clinical outcomes included time to resolution of signs or symptoms (pulmonary markers included respiratory distress, wheeze, crepitations, oxygen saturation and fever). Secondary outcomes included hospital admissions, length of hospital stay, readmissions, complications or adverse events and radiological findings.
Data collection and analysis
Two review authors independently analysed the search results.
Main results
We included seven studies with a total of 824 participants. The results of these seven included studies were often heterogeneous, which generally precluded meta‐analysis, except for deaths, length of supplemental oxygen use and length of hospital admission.
In this update, we included two new studies (281 participants), both comparing azithromycin with placebo. They found no significant difference for length of hospital stay, duration of oxygen requirement and readmission. These results were similar to an older study (52 participants) that demonstrated no significant difference comparing ampicillin and placebo for length of illness.
One small study (21 participants) with higher risk of bias randomised children with proven RSV infection to clarithromycin or placebo and found a trend towards a reduction in hospital readmission with clarithromycin.
The three studies providing adequate data for days of supplementary oxygen showed no difference between antibiotics and placebo (pooled mean difference (MD) (days) ‐0.20; 95% confidence interval (CI) ‐0.72 to 0.33). The three studies providing adequate data for length of hospital stay, similarly showed no difference between antibiotics (azithromycin) and placebo (pooled MD (days) ‐0.58; 95% CI ‐1.18 to 0.02).
Two studies randomised children to intravenous ampicillin, oral erythromycin and control and found no difference for most symptom measures.
There were no deaths reported in any of the arms of the seven included studies. No other adverse effects were reported.
Authors' conclusions
This review did not find sufficient evidence to support the use of antibiotics for bronchiolitis, although research may be justified to identify a subgroup of patients who may benefit from antibiotics. Further research may be better focused on determining the reasons that clinicians use antibiotics so readily for bronchiolitis, how to reduce their use and how to reduce clinician anxiety about not using antibiotics.
PICO
Plain language summary
Antibiotics for bronchiolitis in children under two years of age
Question
We reviewed the evidence on the effect of antibiotics on clinical outcomes in children with bronchiolitis.
Background
Bronchiolitis is a serious respiratory illness that affects babies. It is most commonly caused by respiratory syncytial virus (RSV) and is the most common reason for hospitalisation in babies younger than six months. Babies usually present with runny nose, cough, shortness of breath and signs of difficulty in breathing, which can become life‐threatening. Despite its viral cause, antibiotics are often prescribed. Prescribers may be expecting benefits from anti‐inflammatory effects attributed to some antibiotics or be concerned about secondary bacterial infection, particularly in children who are very unwell and require intensive care. We wanted to discover if antibiotics improved or worsened clinical outcomes in children with bronchiolitis.
Study characteristics
This evidence is current to June 2014. We identified seven trials (824 participants) comparing antibiotics with placebo or no antibiotics in children with bronchiolitis. Two of these studies also compared intravenous and oral antibiotics.
Key results
Our primary outcome was duration of symptoms/signs (duration of supplementary oxygen requirement, oxygen saturation, wheeze, crepitations (crackles), fever). Secondary outcomes included duration of admissions/time to discharge from hospital, readmissions, complications/adverse events (including death) and radiological (X‐ray) findings.
We included seven studies with a total of 824 participants. Four studies reported on duration of supplementary oxygen requirement and did not demonstrate a significant difference in the duration of oxygen use comparing antibiotics to placebo. We combined three studies comparing azithromycin versus placebo and again did not demonstrate a significant difference between antibiotics and placebo in the duration of oxygen requirement. Most of the included studies did not report on the primary outcomes of wheeze, crepitations and fever. One study with a high risk of bias found mixed results for the effects of antibiotics on wheeze but no difference for other symptom measures. One study found no difference in duration of fever and one study found no difference in presence of fever on day two.
In regards to secondary outcomes, six included studies did not find any difference between antibiotics and placebo for the outcomes of length of illness or length of hospital stay. For length of hospital stay, we combined data from three studies comparing the use of azithromycin versus placebo as a subtotal as part of the overall analysis of the effect of antibiotics on hospital stay. These combined results similarly showed no difference between antibiotics (azithromycin) and placebo. One small study with a high risk of bias found that three weeks of clarithromycin significantly reduced hospital readmission compared to placebo. However, this reduction in hospital readmissions was not replicated in a more recent study that randomised 97 children to receive either a single large dose of azithromycin or placebo. There were no deaths reported in any arms of any of the seven included trials and none of the studies specifically reported on adverse effects of antibiotics. Only two studies made general comments that no adverse effects were found with antibiotic use. Radiological findings were not reported as an outcome in any of the included studies.
Quality of the evidence
This 2014 updated review is stronger, owing to the inclusion of two new randomised controlled trials (RCTs). These two studies combined involved a further 138 participants in the antibiotic arm and 143 participants in the placebo arm. Prior to this only three small RCTs had examined antibiotics versus placebo, with only 72 participants in the antibiotic arms and 72 participants in the placebo arms. Consequently, this review makes a substantial contribution, especially with regards to the role of macrolides, such as azithromycin, in bronchiolitis. No new unpublished data have been included. However, the review authors have no reason to suspect that the search strategy has biased the review results. Raw data could not be obtained from one study conducted 40 years ago, nor from three other trials, which is a weakness of this review. Three trial authors did provide raw data for this review.
Conclusion
This review did not find sufficient evidence to support the use of antibiotics for bronchiolitis. Research may be justified to identify a subgroup of patients who may benefit from antibiotics.
Authors' conclusions
Background
Description of the condition
Bronchiolitis is a serious, potentially life‐threatening respiratory illness that often affects young babies. It occurs most frequently in the first year of life and is the commonest cause of hospital admissions in infants under six months of age (Wohl 1978). The most commonly identified pathogen is respiratory syncytial virus (RSV). Other viruses such as human meta‐pneumovirus (HMPV), influenza, parainfluenza, adenovirus and rhinovirus have also been implicated (Williams 2004). Other less common pathogens include Mycoplasma pneumoniae (M. pneumoniae), which can occur in sporadic outbreaks (Glezen 1971; Rose 1987). The diagnosis is most often made on clinical grounds, which usually includes tachypnoea (rapid breathing) and wheezing in children under two years of age (Bordley 2004). Immunofluorescence and culture of the nasopharyngeal aspirate may be used to determine the causative organism and may reduce antibiotic use (Christakis 2005). A chest X‐ray may show hyperinflation and patchy atelectasis (where parts of the lung collapse or do not inflate properly) (Smyth 2006). There are few effective therapies, including antiviral therapies (Smyth 2006).
Description of the intervention
Antibiotics are not recommended unless there is concern about complications such as secondary bacterial pneumonia (Fitzgerald 2004; Lozano 2002). This is based on evidence suggesting a low risk of bacteraemia (0.2%) in children with bronchiolitis and fever ‐ a lower risk than for children with a fever without a recognisable illness, where the rate ranges from 2% to 7% (Greenes 1999). Antibiotic use comes with significant harms including common adverse reactions (rash, abdominal pain, diarrhoea and vomiting), cost and community bacterial resistance (Brook 1998).
Infants with severe bronchiolitis requiring mechanical ventilation have been shown to have high rates of bacterial co‐infection. Bacterial co‐infection rates vary from 21% (Thorburn 2006) to 26% (Kneyber 2005), measured in both from endotracheal aspirates. Consistent with these results, Kneyber 2005 reported antibiotic use at 95% in infants with bronchiolitis in intensive care.
Antibiotics are commonly used in hospitalised infants, even in children who are not ventilated, at rates of 34% (Vogel 2003), 45% (Christakis 2005; Thorburn 2006), and 99% (Kabir 2003). In one outpatient study antibiotics were used in 53% of children with bronchiolitis (Halna 2005).
How the intervention might work
Antibiotics may be useful in cases of illness where superinfection with bacteria occurs, although it is unlikely that antibiotics will be effective for a condition that only has a viral cause. However, some antibiotics may have anti‐inflammatory effects, which may improve symptoms.
Why it is important to do this review
The use of antibiotics for uncomplicated bronchiolitis is common yet is not justified by our understanding of bronchiolitis as a viral illness. The discord between clinical practice and the pathophysiological understanding of bronchiolitis as a viral illness will benefit from the empirical evidence offered by this systematic review.
Objectives
To evaluate the effectiveness of antibiotics for bronchiolitis in children under two years of age compared to placebo or other interventions.
Methods
Criteria for considering studies for this review
Types of studies
Single or double‐blind randomised controlled trials (RCTs) comparing antibiotics to placebo or control to treat bronchiolitis.
Types of participants
Children under the age of two years diagnosed with bronchiolitis using clinical criteria, such as respiratory distress preceded by coryzal symptoms, with or without fever.
Types of interventions
Oral, intravenous, intramuscular or inhaled antibiotics versus placebo.
Types of outcome measures
Primary outcomes
Duration of symptoms/signs:
-
Duration of supplementary oxygen requirement
-
Oxygen saturation
-
Wheeze
-
Crepitations
-
Fever
Secondary outcomes
-
Duration of admission/time to discharge from hospital
-
Readmissions
-
Complications/adverse events developed, including death
-
Radiological findings
Search methods for identification of studies
Electronic searches
We searched the Cochrane Central Register of Controlled Trials (CENTRAL 2014, Issue 6), which includes the Cochrane Acute Respiratory Infection Group's Specialised Register, and the Database of Abstracts of Reviews of Effects, MEDLINE (1966 to June 2014), EMBASE (1990 to June 2014) and Current Contents (2001 to June 2014).
We used multiple strategies to identify as many trials as possible that met the inclusion criteria, regardless of language or publication status. We used the search strategy described in Appendix 1 to search MEDLINE and CENTRAL. We combined the MEDLINE search strategy with the Cochrane Highly Sensitive Search Strategy for identifying randomised trials in MEDLINE: sensitivity‐ and precision‐maximising version (2008 revision): Ovid format (Lefebvre 2011). We modified these terms to search EMBASE (Appendix 2) and Current Contents (Appendix 3).
Searching other resources
We searched the trials registries WHO ICTRP and ClinicalTrials.gov for completed and ongoing trials (latest search date 7 July 2014). We handsearched the references of all identified studies. One review author (GS) and an expert librarian (LE) carried out the search. We contacted experts in the field looking for unpublished studies.
Data collection and analysis
Selection of studies
In the original publication of this review, two review authors (GS, CDM) independently scanned abstracts from the initial search results to identify trials that loosely met the inclusion criteria. Two review authors (CDM, JD) independently reviewed the full‐text articles of the retrieved trials and applied the inclusion criteria.
In the 2011 update, four further studies were found to meet the inclusion criteria and two review authors (CDM, JD) independently assessed the methodological quality of the new included studies that met the inclusion criteria at that time.
Similarly, in this updated review two authors (RF, GS) scanned abstracts from the updated searches to identify trials that met the inclusion criteria. Two review authors (CDM, GS) independently reviewed the full‐text articles of the retrieved trials and applied the inclusion criteria.
We identified two new papers, Pinto 2012 and McCallum 2013, for inclusion in this 2014 updated review.
Data extraction and management
In the initial publication of this review, two review authors (CDM, JD) independently extracted data from each study to be included, using data extraction forms which included type of intervention, adverse events, and continuous and dichotomous outcomes. We also noted the setting (hospital or primary care), study population and any additional interventions or tests.
In this update two review authors (CDM, GS) independently extracted data from the two new included papers. We contacted the authors of both papers to obtain original data.
Assessment of risk of bias in included studies
We rated the quality of each eligible RCT according to the 'Risk of bias' tool available in RevMan 2014 and criteria set out in the Cochrane Handbook for Systematic Reviews of Interventions (Higgins 2011). We assessed methodological quality under the headings of allocation, blinding, incomplete outcome data, selective reporting and other potential sources of bias. Two review authors (GS, CDM) independently assessed the methodological quality of the two new included trials for this review update. We resolved any disagreements between the review authors by discussion.
Measures of treatment effect
We analysed data using RevMan 5.3 (RevMan 2014). We expressed continuous data comparisons using mean differences (MD), where there was one study, or standardised mean difference (SMD), where more than one study used different measurement scales. We expressed dichotomous data using odds ratios (OR). We pooled data into clinical outcomes where multiple trial results for the same clinical presentation existed and heterogeneity did not preclude pooling of results.
Unit of analysis issues
The unit of analysis for each outcome was the individual research participant.
Dealing with missing data
Intention‐to‐treat (ITT) analyses were conducted in Kneyber 2008 and Kabir 2009. In the other five included studies it is not clear if ITT analyses were carried out. Studies were checked for missing data and attempts were made to contact study authors regarding missing data.
Assessment of heterogeneity
We did not undertake a meta‐analysis for most clinical outcomes owing to multiple analyses with only one or two study results. We pooled results where we found a satisfactorily low I2 statistic and non‐significant Chi2 test results. We were only able to combine data for deaths, duration of supplementary oxygen use and length of hospital stay. Given there were no deaths we cannot assess heterogeneity for that outcome.
Assessment of reporting biases
Studies were assessed to ensure that outcomes specified in the methods sections of included studies were reported in the results sections.
Data synthesis
We undertook meta‐analysis for outcomes where there were sufficient comparable data. Only three outcomes fitted this bill: deaths, duration of supplemental oxygen use and length of hospital stay. We were not able to combine symptom measures owing to a lack of comparability of outcome measures or because the timing of measurement was irreconcilably different. We undertook narrative synthesis of the majority of results.
Subgroup analysis and investigation of heterogeneity
Where there was significant heterogeneity we did not conduct meta‐analysis. Sub group analysis to investigate heterogeneity was considered for groups including year of publication, types of antibiotics used and hospital versus community setting.
Sensitivity analysis
Not applicable.
Results
Description of studies
Results of the search
Initial database searching revealed the following results: 173 articles in MEDLINE, 102 articles in EMBASE, 23 articles in CENTRAL and two articles in DARE. Of these 300 articles, we rejected 297 on the basis of title and abstract alone leaving three studies.
In the 2011 update, we identified an additional 259 studies, with 35 duplicates and 220 rejected on title and abstract alone with four studies remaining. Of the seven studies identified from initial and updated searches, we excluded two: one because it did not involve clinical criteria for inclusion (Friis 1984), and one because it did not involve an antibiotic (Boogaard 2007). Five studies did meet the inclusion criteria (Field 1966; Kabir 2009; Kneyber 2008; Mazumder 2009; Tahan 2007).
In this 2014 update, following removal of duplicated studies, the searches resulted in the identification of a further 169 articles. We retrieved five articles for further evaluation. Two of these reported data from studies that met the inclusion criteria (McCallum 2013; Pinto 2012). We excluded three articles as they related to the study reported in McCallum 2013 and did not include any outcome data.
Included studies
Field 1966, Tahan 2007, Kneyber 2008, Mazumder 2009, Kabir 2009, Pinto 2012 and McCallum 2013 met the inclusion criteria, randomising children to antibiotics or control groups. All study participants were children under two years of age except for Tahan 2007, which only included children under seven months of age. Two studies were conducted in low‐income countries, both in Bangladesh (Kabir 2009; Mazumder 2009). These two studies compared oral erythromycin with intravenous ampicillin and control. Two studies were conducted in upper‐middle income countries. Tahan 2007 (Turkey) compared clarithromycin with placebo, while Pinto 2012 (Brazil) compared azithromycin with placebo. Kneyber 2008 and McCallum 2013 were conducted in high‐income countries and compared azithromycin with placebo. Field 1966, also conducted in a high‐income country, compared oral ampicillin with placebo. All studies included participants who were hospitalised and only one study recruited from an outpatients department (Mazumder 2009). Only the two most recent studies clearly identified their funding sources (McCallum 2013; Pinto 2012).
Excluded studies
Boogaard 2007 did not study antibiotics for bronchiolitis. We excluded one study because it dealt with both pneumonia and bronchiolitis using crepitations and radiography as criteria for patient selection (Friis 1984). The study did perform a subgroup analysis of the two groups (antibiotics and placebo) based on virological diagnosis and these results are discussed.
Risk of bias in included studies
Risk of bias is summarised in Figure 1 and Figure 2.

Methodological quality summary: review authors' judgements about each methodological quality item for each included study.
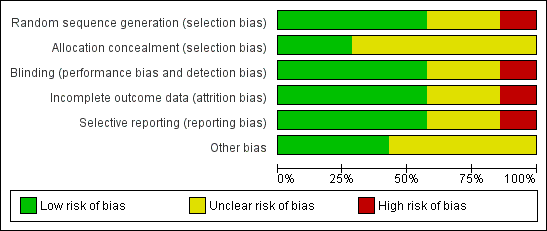
Methodological quality graph: review authors' judgements about each methodological quality item presented as percentages across all included studies.
Allocation
Sequence generation was adequately described by Kneyber 2008, Kabir 2009 and McCallum 2013. Field 1966 probably also used an adequate randomisation procedure. The randomisation process for Tahan 2007 is not adequately described and it was not adequately described in Mazumder 2009. Only two of the seven included studies adequately described allocation concealment (Kneyber 2008; McCallum 2013).
Blinding
Five studies described adequate blinding of participants (all infants), their parents and the investigators. Two did not discuss blinding (Kabir 2009; Mazumder 2009). Two of the studies described blinding of the outcome assessor (McCallum 2013; Pinto 2012).
Incomplete outcome data
In the Mazumder 2009 trial, 22 participants (out of 124) were excluded because they did not attend regular follow‐up (18) or were persistently unwell. In the Kabir 2009 trial, 17 children were referred to tertiary care where there was access to paediatric intensive care and for 15 children their parents withdrew or they left their respective hospitals. In Tahan 2007, nine participants were excluded because they took corticosteroids. There were only 15 participants in each group and six were excluded from the placebo group for taking corticosteroids and three from the clarithromycin group. In Field 1966, eight patients were excluded from the study owing to symptom severity (three from the ampicillin group and five from the placebo group) with an extra two participants (one from each group) lost to follow‐up at the end of the trial. There were no drop outs from the Kneyber 2008 trial. Only one patient was lost to follow‐up in the Pinto 2012 trial. There was no loss to follow‐up for the outcome of respiratory readmission in the McCallum 2013 trial. One participant was excluded from analysis for the outcomes of length of stay and oxygen use as they were randomised to the placebo group but received a macrolide within the exclusion timeframe (McCallum 2013).
Selective reporting
We found Kabir 2009 to have a high risk of reporting bias.
Other potential sources of bias
We identified no other concerns.
Effects of interventions
Duration of symptoms/signs
Primary outcomes
1. Duration of supplementary oxygen requirement
Four studies reported on duration of supplementary oxygen requirement (Kneyber 2008; McCallum 2013; Pinto 2012; Tahan 2007). Three of these studies compared azithromycin versus placebo (Kneyber 2008; McCallum 2013; Pinto 2012), while Tahan 2007 compared clarithromycin to placebo.
Tahan 2007 randomised infants younger than seven months admitted to a department of paediatrics in Turkey to clarithromycin for three weeks (15) or placebo (15) if they were found to be positive for a respiratory syncytial virus (RSV) immunofluorescent test. Nine participants were excluded owing to corticosteroid use, leaving 12 in the clarithromycin group and nine in the placebo group. Duration of oxygen use in the clarithromycin group was 31 hours (interquartile range: 28 to 42) and for placebo 72 hours (52 to 80).
Kneyber 2008 randomised infants younger than 24 months with clinically suspected viral bronchiolitis who were admitted to hospital in the Netherlands to azithromycin (32 children) and placebo (39 children). Oxygen was used by 20 participants in the azithromycin group (mean duration: 3.8 days +/‐ 0.4 standard error (SE)) and 31 participants in the placebo group (mean duration 3.4 days +/‐ 0.3). Other outcomes are tabled and discussed in later sections of this review as appropriate (Table 1).
| Variable | Azithromycin (n = 32) | Placebo (n = 39) | Outcome | Significance level |
| Days of symptoms | 4.94 (SD 3.78) | 4.62 (SD 2.05) | Mean difference 0.32 (95% CI ‐1.14 to 1.78) | P value = 0.65 |
| Days in hospital | 5.5 (SD 2.54) | 5.82 (SD 1.98) | Mean difference ‐0.32 (95% CI ‐1.40 to 0.76) | P value = 0.56 |
| Duration of fever (days) | 1.47 (SD 1.41) | 1.00 (SD 1.08) | Mean difference 0.47 (95% CI ‐0.12 to 1.06) | P value = 0.12 |
| Duration of bronchodilator use | 2.79 (SD 2.49) | 2.96 (SD 2.06) | Mean difference ‐0.17 (95% CI ‐1.25 to 0.91) | P value = 0.81 |
| Bronchodilator use | 17 | 23 | Odds ratio 0.79 (95% CI 0.31 to 2.02) | P value = 0.62 |
| Supplementary oxygen | 20 (62.5%) | 31 (79.49%) | Odds ratio 0.43 (95% CI 0.15 to 1.24) | P value = 0.11 |
| Days of extra oxygen | 3.75 (SD 1.74) | 3.39 (SD 1.78) | Mean difference 0.36 (95% CI ‐0.46 to 1.18) | P value = 0.48 |
| PICU admission | 0 (0%) | 1 (2.56%) | Odds ratio 0.39 (95% CI 0.02 to 10.03) | P value = 1.00 |
| Tube feeding | 16 (50.00%) | 16 (41.03%) | Odds ratio 1.44 (95% CI 0.56 to 3.69) | P value = 0.45 |
| Days of tube feeding | 1.90 (SD 2.13) | 1.83 (SD 2.36) | Mean difference 0.07 (95% CI ‐0.98 to 1.12) | P value = 0.90 |
CI: confidence interval
PICU: paediatric intensive care unit
SD: standard deviation
McCallum 2013 randomised 97 children aged 18 months or under, admitted with a clinical diagnosis of bronchiolitis (according to standardised hospital protocols; months or under, with cough and coryza, wheezing with or without crackles, respiratory distress with both tachypnoea (respiratory rate > 50 breaths/minute) and retractions) to receive either a single large dose (30 mg/kg) of azithromycin (50 children) or placebo (47 children) within 24 hours of hospitalisation. One of the primary outcomes was length of oxygen requirement. The mean difference (MD) in oxygen requirement was not statistically significant between groups; azithromycin 1.9 days versus placebo 2.7 days (MD ‐0.74; 95% confidence interval (CI) ‐1.88 to 0.39).
Pinto 2012 randomised children less than 12 months of age, hospitalised with acute viral bronchiolitis, to receive either azithromycin (88 children) or placebo (96 children) for seven days. One of the primary outcomes was duration of oxygen requirement. There was no statistically significant difference in duration of oxygen requirement in this study; azithromycin 4.4 days versus placebo 4.89 days (MD ‐0.49; 95% CI ‐1.35 to 0.37).
For duration of supplementary oxygen use we combined three studies comparing azithromycin versus placebo in a meta‐analysis (Kneyber 2008; McCallum 2013; Pinto 2012). The three studies providing adequate data for days of supplementary oxygen showed no difference between antibiotics and placebo (pooled MD ‐0.20; 95% CI ‐0.72 to 0.33) (Analysis 1.1). Acceptable statistical heterogeneity was demonstrated for these results (Chi² test = 3.11, df = 2 (P value = 0.21); I² statistic = 36%).
2. Oxygen saturation
Mazumder 2009 randomised infants younger than 24 months (and older than one month) with clinically suspected bronchiolitis to intravenous ampicillin (29 children), oral erythromycin (32 children) and no antibiotics (43 children). Symptoms (wheeze, shortness of breath, oxygen saturation less than 96%, lack of social smile and feeding difficulties) were measured on days one, three and five. No significant differences were reported between the three groups for oxygen saturation less than 96%. Full results as reported by this study for the three groups are tabled with Chi2 test results and significance levels (Table 2). The two antibiotic arms of this trial were also combined and compared with control. Again there was no significant difference between antibiotics and control for the outcome of oxygen saturation less than 96%.
| Variable | Day 1 | Outcome | Day 3 | Outcome | Day 5 | Outcome | ||||||
| IV ampicillin | Oral erythromycin | Control | Chi2 test (P value) | IV ampicillin | Oral erythromycin | Control | Chi2 test (P value) | IV ampicillin | Oral erythromycin | Control | Chi2 test (P value) | |
| Wheeze | 29/29 (100%) | 32/32 (100%) | 43/43 (100%) | N/A | 16/29 (55%) | 2/32 (6%) | 26/43 (60%) | 24.82 (P value < 0.001) | 6/29 (21%) | 7/32 (22%) | 2/43 (5%) | 5.69 (P value = 0.058) |
| Shortness of breath | 29/29 (100%) | 32/32 (100%) | 43/43 (100%) | N/A | 18/29 (62%) | 16/32 (50%) | 27/43 (63%) | 1.97 (P value = 0.37) | 8/29 (28%) | 8/32 (25%) | 15/43 (35%) | 0.95 (P value = 0.62) |
| Oxygen saturation (< 96%) | 18/29 (62%) | 15/32 (47%) | 23/43 (53%) | 1.42 (P value = 0.49) | 8/29 (28%) | 7/32 (22%) | 5/43 (12%) | 3.05 (P value = 0.22) | 2/29 (7%) | 3/32 (9%) | 2/43 (5%) | 0.65 (P value = 0.72) |
| Not smiling socially | 19/29 (66%) | 21/32 (66%) | 30/43 (70%) | 0.20 (P value = 0.90) | 3/29 (10%) | 3/32 (9%) | 5/43 (12%) | 0.10 (P value = 0.95) | 0/29 (0%) | 0/32 (0%) | 0/43 (0%) | N/A |
| Feeding difficulty | 12/29 (41%) | 13/32 (41%) | 25/43 (58%) | 2.98 (P value = 0.23) | 3/29 (10%) | 3/32 (9%) | 5/43 (12%) | 0.10 (P value = 0.95) | 0/29 (0%) | 0/32 (0%) | 0/43 (0%) | N/A |
IV: intravenous
3. Wheeze
Mazumder 2009 found there were significantly fewer children with wheeze in the oral erythromycin group on day three but significantly fewer children with wheeze in the control group on day five. When the two antibiotic arms of this trial were combined and compared with control, for the outcome of wheeze on day three, significantly fewer children had wheeze in the antibiotics arm (odds ratio (OR) 0.27; 95% CI 0.12 to 0.62). However, on day five significantly more children in the antibiotics arm had wheeze compared with control (OR 5.55; 95% CI 1.18 to 26.05) (Analysis 2.1).
4. Crepitations
None of the included studies explored this outcome.
5. Fever
Kabir 2009 randomised infants younger than 24 months with clinical signs of bronchiolitis (hospitalised with runny nose, cough, breathing difficulty, chest indrawing and rhonchi on auscultation). Symptom resolution was measured as rapid (less than four days) or gradual (more than four days). None of the symptom measures (including fever on day two) differed significantly between parenteral ampicillin, oral erythromycin and control (Table 3).
| Variable | Intervention | Outcome | ||
| IV ampicillin | Oral erythromycin | Control | Chi2 test (P value) | |
| Day 2 | ||||
| Oxygen sats (< 90%) | 2/99 (2%) | 6/99 (6%) | 6/97 (6%) | 2.45 (P value = 0.29) |
| Fever | 5/99 (5%) | 6/99 (6%) | 4/97 (4%) | 0.38 (P value = 0.83) |
| Day 7 | ||||
| Wheeze | 8/99 (8%) | 9/99 (9%) | 4/97 (4%) | 2.04 (P value = 0.36) |
| Shortness of breath | 8/99 (8%) | 9/99 (9%) | 2/97 (2%) | 4.68 (P value = 0.10) |
| Cough | 10/99 (10%) | 9/99 (9%) | 3/97 (3%) | 4.06 (P value = 0.13) |
CI: confidence interval
IV: intravenous
PICU: paediatric intensive care unit
SD: standard deviation
There was no significant difference found in duration of fever (days) in Kneyber 2008 when comparing azithromycin versus placebo (Table 1).
While Kabir 2009 and Mazumder 2009 have the same intervention arms, results could not be combined in a meta‐analysis as they either measured symptoms at markedly different times (for example, fever, wheeze, cough, shortness of breath) or used an incomparable measure (for example, oxygen saturation < 96% (Mazumder 2009) versus oxygen saturation < 90% (Kabir 2009)).
Secondary outcomes
1. Duration of admission/time to discharge from hospital
In Tahan 2007, median hospital stay on clarithromycin was 2.13 days (interquartile range: 2 to 2.83) compared to 3.67 days (3 to 4.17) for placebo. In Kneyber 2008, the outcome of length of hospital admission was 5.5 days (standard deviation (SD) 2.55) in the azithromycin group and 5.82 days (SD 2.0) in the placebo group, resulting in a MD of ‐0.32 (95% CI ‐1.40 to 0.76). In Pinto 2012, the use of azythromycin did not reduce the mean number of days of hospitalisation; azithromycin 5.18 versus placebo 5.81 (MD ‐0.63; 95% CI ‐1.52 to 0.26).
McCallum 2013 demonstrated no statistically significant difference in mean length of stay; azithromycin 2.7 days versus placebo 3.6 days (MD ‐0.90; 95% CI ‐2.12 to 0.32). In Kabir 2009, length of hospital stay did not differ significantly between parenteral ampicillin and oral erythromycin and control.
For length of hospital stay, we combined data from three studies comparing the use of azithromycin versus placebo (Kneyber 2008; McCallum 2013; Pinto 2012). We excluded one study from this meta‐analysis because of poor methodological quality and clinical heterogeneity in that it compared erythromycin with placebo (Kabir 2009). The three studies providing adequate data for length of hospital admission similarly showed no difference between antibiotics (azithromycin) and placebo (pooled MD ‐0.58; 95% CI ‐1.18 to 0.02) (Analysis 4.1). Again, acceptable statistical heterogeneity was demonstrated for these results (Chi² test = 0.40, df = 2 (P value = 0.82); I² statistic = 0%).
2. Readmissions
In Tahan 2007, one participant was readmitted in the clarithromycin group (8.3%) and four in the placebo group (44%). McCallum 2013 explored hospital respiratory readmissions six months post discharge as a primary outcome. The number of children readmitted was similar, with 10 per group (OR 0.93; 95% CI 0.35 to 2.47). These two studies providing sufficient data to compare hospital readmissions found no significant difference but we did not pool data owing to a substantial risk of heterogeneity (I2 statistic = 59%) (McCallum 2013; Tahan 2007).
3. Complications/adverse events developed, including death
There were no deaths reported in any arms of any of the seven included trials.
4. Radiological findings
Radiological findings were not reported as an outcome in any of the included studies.
Discussion
Summary of main results
Six included studies did not find any difference between antibiotics and placebo for their primary outcomes of length of illness (Field 1966) or length of hospital stay (Kabir 2009; Kneyber 2008; Mazumder 2009; McCallum 2013; Pinto 2012). One small study with a high risk of bias found that three weeks of clarithromycin significantly reduced hospital admission compared to placebo (Tahan 2007). This reduction in hospital readmissions was not replicated in a more recent study that randomised 97 children to receive either a single large dose of azithromycin or placebo (n = 50 azithromycin, n = 47 placebo) (McCallum 2013). Another study with a high risk of bias found mixed results for the effects of antibiotics on wheeze but no difference for other symptom measures (Mazumder 2009).
We only combined data for deaths, duration of supplementary oxygen use and length of hospital stay. There were no deaths in any arms of any of the seven included trials. For duration of supplementary oxygen use, we combined three studies comparing azithromycin versus placebo (Kneyber 2008; McCallum 2013; Pinto 2012). The three studies providing adequate data for days of supplementary oxygen showed no difference between antibiotics and placebo (pooled mean difference (MD) ‐0.20; 95% confidence interval (CI) ‐0.72 to 0.33). For length of hospital stay, we combined data from three studies comparing the use of azithromycin versus placebo as a subtotal as part of the overall analysis of the effect of antibiotics on hospital stay (Kneyber 2008; McCallum 2013; Pinto 2012). One other study comparing erythromycin with placebo was not included because its addition resulted in statistically significant heterogeneity of the pooled results. This study had a higher risk of bias and it used a different antibiotic (erythromycin rather than azithromycin) as the intervention (Kabir 2009). The three studies providing adequate data for length of hospital admission similarly showed no difference between antibiotics (azithromycin) and placebo, providing a pooled MD of ‐0.58 days (95% CI ‐1.18 to 0.02) with acceptable statistical heterogeneity. Two studies providing sufficient data to compare hospital readmissions showed no significant difference between antibiotic and placebo groups but we did not pool data as there was a substantial risk of heterogeneity (I2statistic = 59%) (McCallum 2013; Tahan 2007).
Overall completeness and applicability of evidence
Clinicians may be concerned that if they do not use antibiotics in a child presenting with a fever and clinical symptoms and signs of bronchiolitis, they may be putting the child at risk of serious complications such as pneumonia, septicaemia and death. It has already been noted that children with this presentation are very unlikely to have an occult bacteraemia (Greenes 1999). In one study, paediatricians were less likely to evaluate febrile infants presenting with clinical signs of bronchiolitis for sepsis. In this series of 219 febrile infants with clinical signs of bronchiolitis, none had a serious bacterial infection and it was concluded that selective evaluation for sepsis in this population of febrile infants is appropriate (Luginbuhl 2008).
In addition to the four new randomised controlled trials (RCTs) included in the 2011 update, this 2014 updated review includes a further two new RCTs, all of which investigated the use of macrolide antibiotics for bronchiolitis. Macrolides are thought to have anti‐inflammatory activities as well as antibiotic activity (Culic 2001), and so were thought to have potential in treating bronchiolitis, a viral condition. Additionally, clarithromycin, a macrolide antibiotic, has been shown to have immune modulatory effects (Ichiyama 2001). One included study hypothesised that clarithromycin would be beneficial for bronchiolitis and found clinical benefit from clarithromycin (Tahan 2007). However, firm conclusions about the benefits of clarithromycin for bronchiolitis cannot be drawn from this study of 21 participants because of the small numbers and the high risk of potential bias.
Another study examining a macrolide antibiotic, azithromycin, hypothesised that macrolide antibiotics would make no difference in bronchiolitis and this was what this study found (Kneyber 2008). Kneyber 2008 was a larger study and had fewer quality appraisal concerns. The two new included studies in this 2014 update also demonstrated no statistically significant benefit of azithromycin compared to placebo for their primary outcomes (McCallum 2013; Pinto 2012). The pooled result of these three studies for length of hospital admission was close to attaining statistical significance. However, the pooled result shows a potential reduction of only half a day in hospital, which represents approximately a 10% decrease in hospital time, which is of dubious clinical significance for an outcome which depends on many structural factors independent of the disease course. Azithromycin also has a long half‐life, which may contribute to increased risk of emerging resistant strains of bacteria.
Mazumder 2009 and Kabir 2009 compared intravenous ampicillin and oral erythromycin for bronchiolitis and found no significant difference between the two. There was also no significant difference with control. For Mazumder 2009, the mixed results of antibiotics on the outcome of wheeze and high risk of potential bias mean that this study cannot support the use of antibiotics in bronchiolitis. No firm conclusions can be drawn from the empirical evidence contained in this review regarding the benefits of macrolide antibiotics for bronchiolitis.
None of the studies specifically reported on adverse effects of antibiotics. Only two studies made general comments that no adverse effects were found with antibiotic use (Field 1966; McCallum 2013).
Methods to reduce antibiotic use for bronchiolitis have been investigated. Wilson 2002 found that a clinical pathway reduced inpatient antibiotic use for bronchiolitis from 27% to 9%.
Children with a serious illness requiring admission to intensive care, and especially those requiring ventilation, may have higher rates of bacterial co‐infection, possibly justifying the increased use of antibiotics in this setting (Kneyber 2005; Thorburn 2006). There have been no RCTs assessing the usefulness of antibiotics for bronchiolitis in an intensive care setting. Bloomfield 2004 found that aside from intensive care admission (2.9% with bacteraemia), children with a respiratory syncytial virus (RSV) infection are more likely to be bacteraemic if they have a nosocomial RSV infection (6.5% bacteraemia) or cyanotic congenital heart disease (6.6% bacteraemia). The baseline rate of bacteraemia in children with RSV bronchiolitis in this study was 0.6%. However, a small study conducted in a paediatric intensive care unit in the United States found that otherwise low‐risk infants (23 infants) with RSV bronchiolitis and respiratory failure had rates of concomitant bacterial pneumonia at 20% or higher (Levin 2010). Further evaluation of the risk of secondary bacterial infection following bronchiolitis would help inform the role of antibiotics in this viral infection, especially in the context of respiratory failure.
Quality of the evidence
This 2014 update saw the addition of two larger studies examining azithromycin versus placebo for bronchiolitis (McCallum 2013; Pinto 2012). These two studies combined involved a further 138 participants in the antibiotic arm and 143 participants in the placebo arm and demonstrated no statistically significant benefit of azithromycin compared to placebo for their primary outcomes.
Prior to this only three small RCTs had examined antibiotics versus placebo, with only 72 participants in the antibiotic arms and 72 participants in the placebo arms. The two previous studies describing adequate randomisation conducted in high‐income countries did not find any difference between antibiotic and placebo arms (Field 1966; Kneyber 2008). The study which found clarithromycin more likely to reduce hospital admission than placebo did not adequately describe randomisation nor allocation concealment and 30% of those randomised were excluded owing to co‐administration of corticosteroids (Tahan 2007). The inconsistency of results seems most likely to be owing to the differences in methodological quality. The study by Tahan 2007 was the only one to use clarithromycin and the only study to use antibiotics for three weeks. Two studies have been conducted in low‐income countries (Kabir 2009; Mazumder 2009), with a further two being conducted in upper‐middle income countries (Pinto 2012; Tahan 2007). Both Mazumder 2009 and Kabir 2009 were studies which had a high risk of bias.
Potential biases in the review process
This 2014 updated review is stronger, owing to the inclusion of a further two new RCTs and makes a substantial contribution, especially with regards to the role of macrolides in bronchiolitis. No new unpublished data have been included. However, the review authors have no reason to suspect that the search strategy has biased the review results. Raw data could not be obtained from one study conducted 40 years ago (Field 1966), nor from Tahan 2007, Mazumder 2009 or Kabir 2009, which is a weakness of this review. Some trial authors did provide raw data for this review (Kneyber 2008; McCallum 2013; Pinto 2012).
Agreements and disagreements with other studies or reviews
Excluded studies comparing antibiotics to placebo in participants with bronchiolitis did not find any significant difference (Friis 1984).

Methodological quality summary: review authors' judgements about each methodological quality item for each included study.

Methodological quality graph: review authors' judgements about each methodological quality item presented as percentages across all included studies.
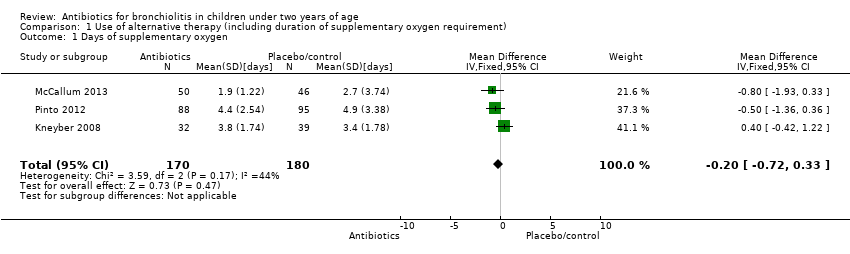
Comparison 1 Use of alternative therapy (including duration of supplementary oxygen requirement), Outcome 1 Days of supplementary oxygen.
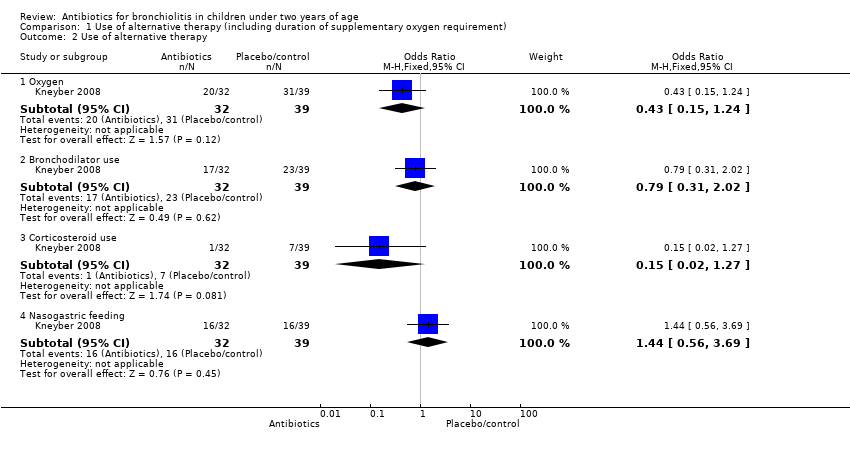
Comparison 1 Use of alternative therapy (including duration of supplementary oxygen requirement), Outcome 2 Use of alternative therapy.

Comparison 1 Use of alternative therapy (including duration of supplementary oxygen requirement), Outcome 3 Duration of bronchodilator use.

Comparison 1 Use of alternative therapy (including duration of supplementary oxygen requirement), Outcome 4 Days of tube feeding.

Comparison 2 Symptoms, Outcome 1 Wheeze.

Comparison 2 Symptoms, Outcome 2 Shortness of breath.
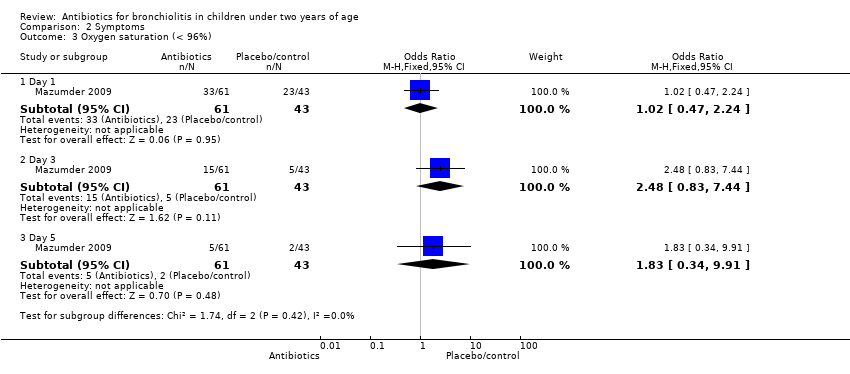
Comparison 2 Symptoms, Outcome 3 Oxygen saturation (< 96%).

Comparison 2 Symptoms, Outcome 4 Not smiling socially.

Comparison 2 Symptoms, Outcome 5 Feeding difficulties.

Comparison 2 Symptoms, Outcome 6 Fever.

Comparison 2 Symptoms, Outcome 7 Cough.

Comparison 3 Duration of symptoms, Outcome 1 Duration of symptoms.
![Comparison 3 Duration of symptoms, Outcome 2 Duration of fever [days].](/es/cdsr/doi/10.1002/14651858.CD005189.pub4/media/CDSR/CD005189/image_n/nCD005189-CMP-003-02.png)
Comparison 3 Duration of symptoms, Outcome 2 Duration of fever [days].

Comparison 4 Hospital admissions/time to discharge from hospital, Outcome 1 Length of hospital stay.

Comparison 5 Readmissions, Outcome 1 Readmission.

Comparison 6 PICU admission, Outcome 1 PICU admission.

Comparison 7 Death, Outcome 1 Deaths.
| Variable | Azithromycin (n = 32) | Placebo (n = 39) | Outcome | Significance level |
| Days of symptoms | 4.94 (SD 3.78) | 4.62 (SD 2.05) | Mean difference 0.32 (95% CI ‐1.14 to 1.78) | P value = 0.65 |
| Days in hospital | 5.5 (SD 2.54) | 5.82 (SD 1.98) | Mean difference ‐0.32 (95% CI ‐1.40 to 0.76) | P value = 0.56 |
| Duration of fever (days) | 1.47 (SD 1.41) | 1.00 (SD 1.08) | Mean difference 0.47 (95% CI ‐0.12 to 1.06) | P value = 0.12 |
| Duration of bronchodilator use | 2.79 (SD 2.49) | 2.96 (SD 2.06) | Mean difference ‐0.17 (95% CI ‐1.25 to 0.91) | P value = 0.81 |
| Bronchodilator use | 17 | 23 | Odds ratio 0.79 (95% CI 0.31 to 2.02) | P value = 0.62 |
| Supplementary oxygen | 20 (62.5%) | 31 (79.49%) | Odds ratio 0.43 (95% CI 0.15 to 1.24) | P value = 0.11 |
| Days of extra oxygen | 3.75 (SD 1.74) | 3.39 (SD 1.78) | Mean difference 0.36 (95% CI ‐0.46 to 1.18) | P value = 0.48 |
| PICU admission | 0 (0%) | 1 (2.56%) | Odds ratio 0.39 (95% CI 0.02 to 10.03) | P value = 1.00 |
| Tube feeding | 16 (50.00%) | 16 (41.03%) | Odds ratio 1.44 (95% CI 0.56 to 3.69) | P value = 0.45 |
| Days of tube feeding | 1.90 (SD 2.13) | 1.83 (SD 2.36) | Mean difference 0.07 (95% CI ‐0.98 to 1.12) | P value = 0.90 |
| CI: confidence interval | ||||
| Variable | Day 1 | Outcome | Day 3 | Outcome | Day 5 | Outcome | ||||||
| IV ampicillin | Oral erythromycin | Control | Chi2 test (P value) | IV ampicillin | Oral erythromycin | Control | Chi2 test (P value) | IV ampicillin | Oral erythromycin | Control | Chi2 test (P value) | |
| Wheeze | 29/29 (100%) | 32/32 (100%) | 43/43 (100%) | N/A | 16/29 (55%) | 2/32 (6%) | 26/43 (60%) | 24.82 (P value < 0.001) | 6/29 (21%) | 7/32 (22%) | 2/43 (5%) | 5.69 (P value = 0.058) |
| Shortness of breath | 29/29 (100%) | 32/32 (100%) | 43/43 (100%) | N/A | 18/29 (62%) | 16/32 (50%) | 27/43 (63%) | 1.97 (P value = 0.37) | 8/29 (28%) | 8/32 (25%) | 15/43 (35%) | 0.95 (P value = 0.62) |
| Oxygen saturation (< 96%) | 18/29 (62%) | 15/32 (47%) | 23/43 (53%) | 1.42 (P value = 0.49) | 8/29 (28%) | 7/32 (22%) | 5/43 (12%) | 3.05 (P value = 0.22) | 2/29 (7%) | 3/32 (9%) | 2/43 (5%) | 0.65 (P value = 0.72) |
| Not smiling socially | 19/29 (66%) | 21/32 (66%) | 30/43 (70%) | 0.20 (P value = 0.90) | 3/29 (10%) | 3/32 (9%) | 5/43 (12%) | 0.10 (P value = 0.95) | 0/29 (0%) | 0/32 (0%) | 0/43 (0%) | N/A |
| Feeding difficulty | 12/29 (41%) | 13/32 (41%) | 25/43 (58%) | 2.98 (P value = 0.23) | 3/29 (10%) | 3/32 (9%) | 5/43 (12%) | 0.10 (P value = 0.95) | 0/29 (0%) | 0/32 (0%) | 0/43 (0%) | N/A |
| IV: intravenous | ||||||||||||
| Variable | Intervention | Outcome | ||
| IV ampicillin | Oral erythromycin | Control | Chi2 test (P value) | |
| Day 2 | ||||
| Oxygen sats (< 90%) | 2/99 (2%) | 6/99 (6%) | 6/97 (6%) | 2.45 (P value = 0.29) |
| Fever | 5/99 (5%) | 6/99 (6%) | 4/97 (4%) | 0.38 (P value = 0.83) |
| Day 7 | ||||
| Wheeze | 8/99 (8%) | 9/99 (9%) | 4/97 (4%) | 2.04 (P value = 0.36) |
| Shortness of breath | 8/99 (8%) | 9/99 (9%) | 2/97 (2%) | 4.68 (P value = 0.10) |
| Cough | 10/99 (10%) | 9/99 (9%) | 3/97 (3%) | 4.06 (P value = 0.13) |
| CI: confidence interval | ||||
| Outcome or subgroup title | No. of studies | No. of participants | Statistical method | Effect size |
| 1 Days of supplementary oxygen Show forest plot | 3 | 350 | Mean Difference (IV, Fixed, 95% CI) | ‐0.20 [‐0.72, 0.33] |
| 2 Use of alternative therapy Show forest plot | 1 | Odds Ratio (M‐H, Fixed, 95% CI) | Subtotals only | |
| 2.1 Oxygen | 1 | 71 | Odds Ratio (M‐H, Fixed, 95% CI) | 0.43 [0.15, 1.24] |
| 2.2 Bronchodilator use | 1 | 71 | Odds Ratio (M‐H, Fixed, 95% CI) | 0.79 [0.31, 2.02] |
| 2.3 Corticosteroid use | 1 | 71 | Odds Ratio (M‐H, Fixed, 95% CI) | 0.15 [0.02, 1.27] |
| 2.4 Nasogastric feeding | 1 | 71 | Odds Ratio (M‐H, Fixed, 95% CI) | 1.44 [0.56, 3.69] |
| 3 Duration of bronchodilator use Show forest plot | 1 | 71 | Mean Difference (IV, Fixed, 95% CI) | ‐0.20 [‐1.28, 0.88] |
| 4 Days of tube feeding Show forest plot | 1 | 71 | Mean Difference (IV, Fixed, 95% CI) | 0.10 [‐0.95, 1.15] |
| Outcome or subgroup title | No. of studies | No. of participants | Statistical method | Effect size |
| 1 Wheeze Show forest plot | 2 | Odds Ratio (M‐H, Fixed, 95% CI) | Subtotals only | |
| 1.1 Day 1 | 1 | 104 | Odds Ratio (M‐H, Fixed, 95% CI) | 0.0 [0.0, 0.0] |
| 1.2 Day 3 | 1 | 104 | Odds Ratio (M‐H, Fixed, 95% CI) | 0.27 [0.12, 0.62] |
| 1.3 Day 5 | 1 | 104 | Odds Ratio (M‐H, Fixed, 95% CI) | 5.55 [1.18, 26.05] |
| 1.4 Day 7 | 1 | 295 | Odds Ratio (M‐H, Fixed, 95% CI) | 2.18 [0.71, 6.68] |
| 2 Shortness of breath Show forest plot | 2 | Odds Ratio (M‐H, Fixed, 95% CI) | Subtotals only | |
| 2.1 Day 1 | 1 | 104 | Odds Ratio (M‐H, Fixed, 95% CI) | 0.0 [0.0, 0.0] |
| 2.2 Day 3 | 1 | 104 | Odds Ratio (M‐H, Fixed, 95% CI) | 0.75 [0.34, 1.66] |
| 2.3 Day 5 | 1 | 104 | Odds Ratio (M‐H, Fixed, 95% CI) | 0.66 [0.28, 1.55] |
| 2.4 Day 7 | 1 | 295 | Odds Ratio (M‐H, Fixed, 95% CI) | 4.46 [1.01, 19.72] |
| 3 Oxygen saturation (< 96%) Show forest plot | 1 | Odds Ratio (M‐H, Fixed, 95% CI) | Subtotals only | |
| 3.1 Day 1 | 1 | 104 | Odds Ratio (M‐H, Fixed, 95% CI) | 1.02 [0.47, 2.24] |
| 3.2 Day 3 | 1 | 104 | Odds Ratio (M‐H, Fixed, 95% CI) | 2.48 [0.83, 7.44] |
| 3.3 Day 5 | 1 | 104 | Odds Ratio (M‐H, Fixed, 95% CI) | 1.83 [0.34, 9.91] |
| 4 Not smiling socially Show forest plot | 1 | Odds Ratio (M‐H, Fixed, 95% CI) | Subtotals only | |
| 4.1 Day 1 | 1 | 104 | Odds Ratio (M‐H, Fixed, 95% CI) | 0.83 [0.36, 1.91] |
| 4.2 Day 3 | 1 | 104 | Odds Ratio (M‐H, Fixed, 95% CI) | 0.83 [0.24, 2.91] |
| 4.3 Day 5 | 1 | 104 | Odds Ratio (M‐H, Fixed, 95% CI) | 0.0 [0.0, 0.0] |
| 5 Feeding difficulties Show forest plot | 1 | Odds Ratio (M‐H, Fixed, 95% CI) | Subtotals only | |
| 5.1 Day 1 | 1 | 104 | Odds Ratio (M‐H, Fixed, 95% CI) | 0.5 [0.23, 1.10] |
| 5.2 Day 3 | 1 | 104 | Odds Ratio (M‐H, Fixed, 95% CI) | 0.83 [0.24, 2.91] |
| 5.3 Day 5 | 1 | 104 | Odds Ratio (M‐H, Fixed, 95% CI) | 0.0 [0.0, 0.0] |
| 6 Fever Show forest plot | 1 | Odds Ratio (M‐H, Fixed, 95% CI) | Totals not selected | |
| 6.1 Day 2 | 1 | Odds Ratio (M‐H, Fixed, 95% CI) | 0.0 [0.0, 0.0] | |
| 7 Cough Show forest plot | 1 | Odds Ratio (M‐H, Fixed, 95% CI) | Subtotals only | |
| 7.1 Day 7 | 1 | 295 | Odds Ratio (M‐H, Fixed, 95% CI) | 3.33 [0.96, 11.53] |
| Outcome or subgroup title | No. of studies | No. of participants | Statistical method | Effect size |
| 1 Duration of symptoms Show forest plot | 2 | 123 | Mean Difference (IV, Fixed, 95% CI) | 0.32 [‐1.14, 1.78] |
| 2 Duration of fever [days] Show forest plot | 1 | 71 | Mean Difference (IV, Fixed, 95% CI) | 0.5 [‐0.09, 1.09] |
| Outcome or subgroup title | No. of studies | No. of participants | Statistical method | Effect size |
| 1 Length of hospital stay Show forest plot | 4 | Mean Difference (IV, Random, 95% CI) | Subtotals only | |
| 1.1 Azithromycin versus placebo | 3 | 350 | Mean Difference (IV, Random, 95% CI) | ‐0.58 [‐1.18, 0.02] |
| 1.2 Erythromycin versus placebo | 1 | 196 | Mean Difference (IV, Random, 95% CI) | 0.70 [0.22, 1.18] |
| Outcome or subgroup title | No. of studies | No. of participants | Statistical method | Effect size |
| 1 Readmission Show forest plot | 2 | Odds Ratio (M‐H, Fixed, 95% CI) | Subtotals only | |
| Outcome or subgroup title | No. of studies | No. of participants | Statistical method | Effect size |
| 1 PICU admission Show forest plot | 1 | 71 | Odds Ratio (M‐H, Fixed, 95% CI) | 0.39 [0.02, 10.03] |
| Outcome or subgroup title | No. of studies | No. of participants | Statistical method | Effect size |
| 1 Deaths Show forest plot | 5 | 543 | Odds Ratio (M‐H, Fixed, 95% CI) | 0.0 [0.0, 0.0] |