Antibiotics for bronchiolitis in children under two years of age
Información
- DOI:
- https://doi.org/10.1002/14651858.CD005189.pub4Copiar DOI

- Base de datos:
-
- Cochrane Database of Systematic Reviews
- Versión publicada:
-
- 09 octubre 2014see what's new
- Tipo:
-
- Intervention
- Etapa:
-
- Review
- Grupo Editorial Cochrane:
-
Grupo Cochrane de Infecciones respiratorias agudas
- Copyright:
-
- Copyright © 2014 The Cochrane Collaboration. Published by John Wiley & Sons, Ltd.
Cifras del artículo
Altmetric:
Citado por:
Autores
Contributions of authors
RF joined the review team for this 2014 update. RF reviewed search results, contacted authors, entered data and drafted the text for this update.
GS co‐wrote the protocol, reviewed search results, performed quality appraisal, extracted data, drafted the original text for this review and assisted in writing the text for this update.
CDM gave advice on performing the systematic review, performed quality appraisal, extracted data and assisted in writing the text for this update and previous versions of this review.
LE conducted the literature search and approved the final version.
Sources of support
Internal sources
-
University of Queensland, Australia.
In kind
External sources
-
No sources of support supplied
Declarations of interest
Rebecca Farley: none known.
Geoffrey KP Spurling: none known.
Lars Eriksson: none known.
Chris B Del Mar: none known.
Acknowledgements
We would like to thank the following people for their comments on the draft review: Anne Lyddiatt, David Isaacs, Federico Martinón‐Torres, Luthful Kabir, Max Bulsara and Juan Lozano. We also thank the following people for commenting on the updated review drafts: Linda Hornbeek, Liz Whamond, Amanda Roberts, Richard Taggart, David Isaacs, Federico Martinón‐Torres, Rob Ware, Teresa Neeman and Inge Axelsson.
We would like to acknowledge Dr Kit Fonseka who co‐wrote the initial protocol, reviewed the search results, performed quality appraisal, extracted data and helped write the first version of this review. Jenny Doust gave advice on performing the systematic review, critically appraised primary data, extracted data and helped write the protocol and the first two versions of this review.
Version history
| Published | Title | Stage | Authors | Version |
| 2014 Oct 09 | Antibiotics for bronchiolitis in children under two years of age | Review | Rebecca Farley, Geoffrey KP Spurling, Lars Eriksson, Chris B Del Mar | |
| 2011 Jun 15 | Antibiotics for bronchiolitis in children | Review | Geoffrey KP Spurling, Jenny Doust, Chris B Del Mar, Lars Eriksson | |
| 2007 Jan 24 | Antibiotics for bronchiolitis in children | Review | Geoffrey KP Spurling, Kithsiri Fonseka, Jenny Doust, Chris B Del Mar | |
| 2005 Apr 20 | Antibiotics for bronchiolitis in children | Protocol | Kithsiri Fonseka, Jenny Doust, Geoffrey KP Spurling, Chris Del Mar | |
Keywords
MeSH
Medical Subject Headings (MeSH) Keywords
Medical Subject Headings Check Words
Humans; Infant;
PICO

Methodological quality summary: review authors' judgements about each methodological quality item for each included study.

Methodological quality graph: review authors' judgements about each methodological quality item presented as percentages across all included studies.
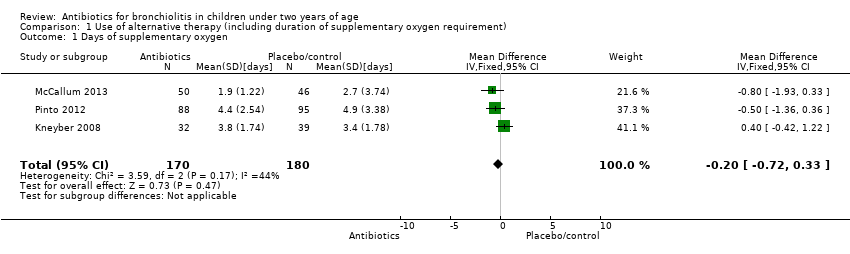
Comparison 1 Use of alternative therapy (including duration of supplementary oxygen requirement), Outcome 1 Days of supplementary oxygen.
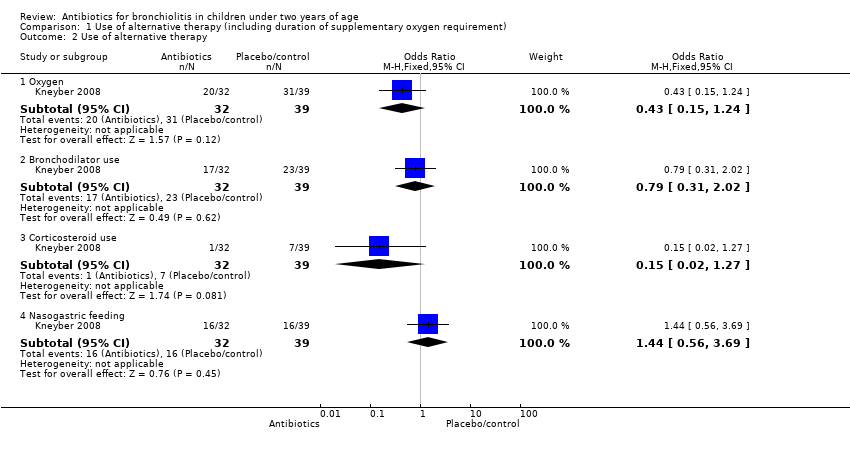
Comparison 1 Use of alternative therapy (including duration of supplementary oxygen requirement), Outcome 2 Use of alternative therapy.

Comparison 1 Use of alternative therapy (including duration of supplementary oxygen requirement), Outcome 3 Duration of bronchodilator use.

Comparison 1 Use of alternative therapy (including duration of supplementary oxygen requirement), Outcome 4 Days of tube feeding.

Comparison 2 Symptoms, Outcome 1 Wheeze.

Comparison 2 Symptoms, Outcome 2 Shortness of breath.
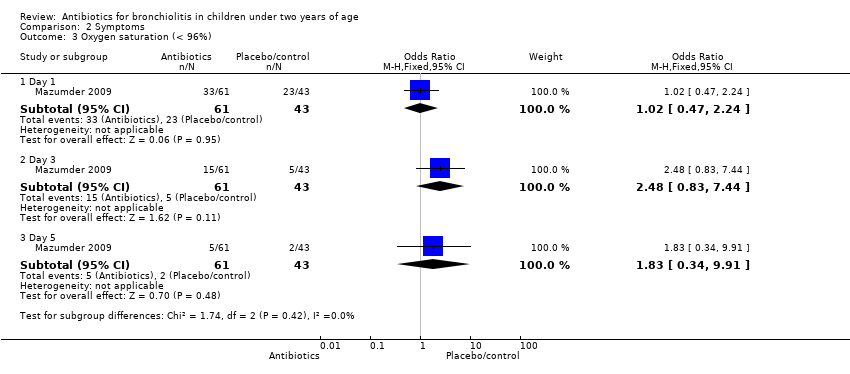
Comparison 2 Symptoms, Outcome 3 Oxygen saturation (< 96%).

Comparison 2 Symptoms, Outcome 4 Not smiling socially.

Comparison 2 Symptoms, Outcome 5 Feeding difficulties.

Comparison 2 Symptoms, Outcome 6 Fever.

Comparison 2 Symptoms, Outcome 7 Cough.

Comparison 3 Duration of symptoms, Outcome 1 Duration of symptoms.
![Comparison 3 Duration of symptoms, Outcome 2 Duration of fever [days].](/es/cdsr/doi/10.1002/14651858.CD005189.pub4/media/CDSR/CD005189/image_n/nCD005189-CMP-003-02.png)
Comparison 3 Duration of symptoms, Outcome 2 Duration of fever [days].

Comparison 4 Hospital admissions/time to discharge from hospital, Outcome 1 Length of hospital stay.

Comparison 5 Readmissions, Outcome 1 Readmission.

Comparison 6 PICU admission, Outcome 1 PICU admission.

Comparison 7 Death, Outcome 1 Deaths.
| Variable | Azithromycin (n = 32) | Placebo (n = 39) | Outcome | Significance level |
| Days of symptoms | 4.94 (SD 3.78) | 4.62 (SD 2.05) | Mean difference 0.32 (95% CI ‐1.14 to 1.78) | P value = 0.65 |
| Days in hospital | 5.5 (SD 2.54) | 5.82 (SD 1.98) | Mean difference ‐0.32 (95% CI ‐1.40 to 0.76) | P value = 0.56 |
| Duration of fever (days) | 1.47 (SD 1.41) | 1.00 (SD 1.08) | Mean difference 0.47 (95% CI ‐0.12 to 1.06) | P value = 0.12 |
| Duration of bronchodilator use | 2.79 (SD 2.49) | 2.96 (SD 2.06) | Mean difference ‐0.17 (95% CI ‐1.25 to 0.91) | P value = 0.81 |
| Bronchodilator use | 17 | 23 | Odds ratio 0.79 (95% CI 0.31 to 2.02) | P value = 0.62 |
| Supplementary oxygen | 20 (62.5%) | 31 (79.49%) | Odds ratio 0.43 (95% CI 0.15 to 1.24) | P value = 0.11 |
| Days of extra oxygen | 3.75 (SD 1.74) | 3.39 (SD 1.78) | Mean difference 0.36 (95% CI ‐0.46 to 1.18) | P value = 0.48 |
| PICU admission | 0 (0%) | 1 (2.56%) | Odds ratio 0.39 (95% CI 0.02 to 10.03) | P value = 1.00 |
| Tube feeding | 16 (50.00%) | 16 (41.03%) | Odds ratio 1.44 (95% CI 0.56 to 3.69) | P value = 0.45 |
| Days of tube feeding | 1.90 (SD 2.13) | 1.83 (SD 2.36) | Mean difference 0.07 (95% CI ‐0.98 to 1.12) | P value = 0.90 |
| CI: confidence interval | ||||
| Variable | Day 1 | Outcome | Day 3 | Outcome | Day 5 | Outcome | ||||||
| IV ampicillin | Oral erythromycin | Control | Chi2 test (P value) | IV ampicillin | Oral erythromycin | Control | Chi2 test (P value) | IV ampicillin | Oral erythromycin | Control | Chi2 test (P value) | |
| Wheeze | 29/29 (100%) | 32/32 (100%) | 43/43 (100%) | N/A | 16/29 (55%) | 2/32 (6%) | 26/43 (60%) | 24.82 (P value < 0.001) | 6/29 (21%) | 7/32 (22%) | 2/43 (5%) | 5.69 (P value = 0.058) |
| Shortness of breath | 29/29 (100%) | 32/32 (100%) | 43/43 (100%) | N/A | 18/29 (62%) | 16/32 (50%) | 27/43 (63%) | 1.97 (P value = 0.37) | 8/29 (28%) | 8/32 (25%) | 15/43 (35%) | 0.95 (P value = 0.62) |
| Oxygen saturation (< 96%) | 18/29 (62%) | 15/32 (47%) | 23/43 (53%) | 1.42 (P value = 0.49) | 8/29 (28%) | 7/32 (22%) | 5/43 (12%) | 3.05 (P value = 0.22) | 2/29 (7%) | 3/32 (9%) | 2/43 (5%) | 0.65 (P value = 0.72) |
| Not smiling socially | 19/29 (66%) | 21/32 (66%) | 30/43 (70%) | 0.20 (P value = 0.90) | 3/29 (10%) | 3/32 (9%) | 5/43 (12%) | 0.10 (P value = 0.95) | 0/29 (0%) | 0/32 (0%) | 0/43 (0%) | N/A |
| Feeding difficulty | 12/29 (41%) | 13/32 (41%) | 25/43 (58%) | 2.98 (P value = 0.23) | 3/29 (10%) | 3/32 (9%) | 5/43 (12%) | 0.10 (P value = 0.95) | 0/29 (0%) | 0/32 (0%) | 0/43 (0%) | N/A |
| IV: intravenous | ||||||||||||
| Variable | Intervention | Outcome | ||
| IV ampicillin | Oral erythromycin | Control | Chi2 test (P value) | |
| Day 2 | ||||
| Oxygen sats (< 90%) | 2/99 (2%) | 6/99 (6%) | 6/97 (6%) | 2.45 (P value = 0.29) |
| Fever | 5/99 (5%) | 6/99 (6%) | 4/97 (4%) | 0.38 (P value = 0.83) |
| Day 7 | ||||
| Wheeze | 8/99 (8%) | 9/99 (9%) | 4/97 (4%) | 2.04 (P value = 0.36) |
| Shortness of breath | 8/99 (8%) | 9/99 (9%) | 2/97 (2%) | 4.68 (P value = 0.10) |
| Cough | 10/99 (10%) | 9/99 (9%) | 3/97 (3%) | 4.06 (P value = 0.13) |
| CI: confidence interval | ||||
| Outcome or subgroup title | No. of studies | No. of participants | Statistical method | Effect size |
| 1 Days of supplementary oxygen Show forest plot | 3 | 350 | Mean Difference (IV, Fixed, 95% CI) | ‐0.20 [‐0.72, 0.33] |
| 2 Use of alternative therapy Show forest plot | 1 | Odds Ratio (M‐H, Fixed, 95% CI) | Subtotals only | |
| 2.1 Oxygen | 1 | 71 | Odds Ratio (M‐H, Fixed, 95% CI) | 0.43 [0.15, 1.24] |
| 2.2 Bronchodilator use | 1 | 71 | Odds Ratio (M‐H, Fixed, 95% CI) | 0.79 [0.31, 2.02] |
| 2.3 Corticosteroid use | 1 | 71 | Odds Ratio (M‐H, Fixed, 95% CI) | 0.15 [0.02, 1.27] |
| 2.4 Nasogastric feeding | 1 | 71 | Odds Ratio (M‐H, Fixed, 95% CI) | 1.44 [0.56, 3.69] |
| 3 Duration of bronchodilator use Show forest plot | 1 | 71 | Mean Difference (IV, Fixed, 95% CI) | ‐0.20 [‐1.28, 0.88] |
| 4 Days of tube feeding Show forest plot | 1 | 71 | Mean Difference (IV, Fixed, 95% CI) | 0.10 [‐0.95, 1.15] |
| Outcome or subgroup title | No. of studies | No. of participants | Statistical method | Effect size |
| 1 Wheeze Show forest plot | 2 | Odds Ratio (M‐H, Fixed, 95% CI) | Subtotals only | |
| 1.1 Day 1 | 1 | 104 | Odds Ratio (M‐H, Fixed, 95% CI) | 0.0 [0.0, 0.0] |
| 1.2 Day 3 | 1 | 104 | Odds Ratio (M‐H, Fixed, 95% CI) | 0.27 [0.12, 0.62] |
| 1.3 Day 5 | 1 | 104 | Odds Ratio (M‐H, Fixed, 95% CI) | 5.55 [1.18, 26.05] |
| 1.4 Day 7 | 1 | 295 | Odds Ratio (M‐H, Fixed, 95% CI) | 2.18 [0.71, 6.68] |
| 2 Shortness of breath Show forest plot | 2 | Odds Ratio (M‐H, Fixed, 95% CI) | Subtotals only | |
| 2.1 Day 1 | 1 | 104 | Odds Ratio (M‐H, Fixed, 95% CI) | 0.0 [0.0, 0.0] |
| 2.2 Day 3 | 1 | 104 | Odds Ratio (M‐H, Fixed, 95% CI) | 0.75 [0.34, 1.66] |
| 2.3 Day 5 | 1 | 104 | Odds Ratio (M‐H, Fixed, 95% CI) | 0.66 [0.28, 1.55] |
| 2.4 Day 7 | 1 | 295 | Odds Ratio (M‐H, Fixed, 95% CI) | 4.46 [1.01, 19.72] |
| 3 Oxygen saturation (< 96%) Show forest plot | 1 | Odds Ratio (M‐H, Fixed, 95% CI) | Subtotals only | |
| 3.1 Day 1 | 1 | 104 | Odds Ratio (M‐H, Fixed, 95% CI) | 1.02 [0.47, 2.24] |
| 3.2 Day 3 | 1 | 104 | Odds Ratio (M‐H, Fixed, 95% CI) | 2.48 [0.83, 7.44] |
| 3.3 Day 5 | 1 | 104 | Odds Ratio (M‐H, Fixed, 95% CI) | 1.83 [0.34, 9.91] |
| 4 Not smiling socially Show forest plot | 1 | Odds Ratio (M‐H, Fixed, 95% CI) | Subtotals only | |
| 4.1 Day 1 | 1 | 104 | Odds Ratio (M‐H, Fixed, 95% CI) | 0.83 [0.36, 1.91] |
| 4.2 Day 3 | 1 | 104 | Odds Ratio (M‐H, Fixed, 95% CI) | 0.83 [0.24, 2.91] |
| 4.3 Day 5 | 1 | 104 | Odds Ratio (M‐H, Fixed, 95% CI) | 0.0 [0.0, 0.0] |
| 5 Feeding difficulties Show forest plot | 1 | Odds Ratio (M‐H, Fixed, 95% CI) | Subtotals only | |
| 5.1 Day 1 | 1 | 104 | Odds Ratio (M‐H, Fixed, 95% CI) | 0.5 [0.23, 1.10] |
| 5.2 Day 3 | 1 | 104 | Odds Ratio (M‐H, Fixed, 95% CI) | 0.83 [0.24, 2.91] |
| 5.3 Day 5 | 1 | 104 | Odds Ratio (M‐H, Fixed, 95% CI) | 0.0 [0.0, 0.0] |
| 6 Fever Show forest plot | 1 | Odds Ratio (M‐H, Fixed, 95% CI) | Totals not selected | |
| 6.1 Day 2 | 1 | Odds Ratio (M‐H, Fixed, 95% CI) | 0.0 [0.0, 0.0] | |
| 7 Cough Show forest plot | 1 | Odds Ratio (M‐H, Fixed, 95% CI) | Subtotals only | |
| 7.1 Day 7 | 1 | 295 | Odds Ratio (M‐H, Fixed, 95% CI) | 3.33 [0.96, 11.53] |
| Outcome or subgroup title | No. of studies | No. of participants | Statistical method | Effect size |
| 1 Duration of symptoms Show forest plot | 2 | 123 | Mean Difference (IV, Fixed, 95% CI) | 0.32 [‐1.14, 1.78] |
| 2 Duration of fever [days] Show forest plot | 1 | 71 | Mean Difference (IV, Fixed, 95% CI) | 0.5 [‐0.09, 1.09] |
| Outcome or subgroup title | No. of studies | No. of participants | Statistical method | Effect size |
| 1 Length of hospital stay Show forest plot | 4 | Mean Difference (IV, Random, 95% CI) | Subtotals only | |
| 1.1 Azithromycin versus placebo | 3 | 350 | Mean Difference (IV, Random, 95% CI) | ‐0.58 [‐1.18, 0.02] |
| 1.2 Erythromycin versus placebo | 1 | 196 | Mean Difference (IV, Random, 95% CI) | 0.70 [0.22, 1.18] |
| Outcome or subgroup title | No. of studies | No. of participants | Statistical method | Effect size |
| 1 Readmission Show forest plot | 2 | Odds Ratio (M‐H, Fixed, 95% CI) | Subtotals only | |
| Outcome or subgroup title | No. of studies | No. of participants | Statistical method | Effect size |
| 1 PICU admission Show forest plot | 1 | 71 | Odds Ratio (M‐H, Fixed, 95% CI) | 0.39 [0.02, 10.03] |
| Outcome or subgroup title | No. of studies | No. of participants | Statistical method | Effect size |
| 1 Deaths Show forest plot | 5 | 543 | Odds Ratio (M‐H, Fixed, 95% CI) | 0.0 [0.0, 0.0] |