Interferón beta para la esclerosis múltiple progresiva secundaria
Referencias
References to studies included in this review
References to studies excluded from this review
Additional references
Characteristics of studies
Characteristics of included studies [ordered by study ID]
Ir a:
| Methods | Randomized, double‐blind, placebo controlled two arm trial. It was a multicentre study (32): Denmark (4 centres, 48 patients), Finland (6 centres, 123 patients), Norway (12 centres, 120 patients) and Sweden (10 centres, 80 patients). | |
| Participants | 371 patients with SP MS: 188 IFN and 183 placebo‐treated. | |
| Interventions | IFN beta‐1a (Rebif; Serono), 22 ug subcutaneously once weekly versus placebo (unspecified) for 36 months. | |
| Outcomes | Primary: The time to progression on the EDSS, defined as an increase from baseline by at least 1.0 point (or 0.5 points if Secondary:Time to progression on the RFSS (Regional Functional System Score). Tertiary: The proportion of progression free patients, time to first exacerbation, proportion of exacerbation free patients, MS related hospitalisation rate, ambulation index and arm index. | |
| Notes | Serono personnel were involved in the study. | |
| Risk of bias | ||
| Bias | Authors' judgement | Support for judgement |
| Random sequence generation (selection bias) | Unclear risk | No information. |
| Allocation concealment (selection bias) | Unclear risk | "equal allocation (page 707)". |
| Incomplete outcome data (attrition bias) | High risk | Only 83% of randomised patients completed about 3 years. Lost to follow‐up: ‐ 21% for treated patients ‐ 16% for placebo More AE and patients' decision in the treated group The median time on treatment was 35.2 months (mean 32.0) for placebo and 35.0 months (mean 31.1) for IFN. |
| Other bias | High risk | The study was terminated during the third year by the Steering Committee based on negative results from the SPECTRIMS study. |
| Blinding of participants and personnel (performance bias) | Unclear risk | "Patients were instructed to cover injection sites." No blinding questionnaire was conducted at study termination. |
| Blinding of outcome assessment (detection bias) | Unclear risk | "double blind" is reported, without any other comments Placebo is not described. No blinding questionnaire was conducted at study termination. |
| Methods | Randomized, double‐blind, placebo‐controlled, two‐arm trial. It was a multicentre study (42): 31 in the United States, four in Canada, and seven in Europe. | |
| Participants | 436 patients with SPMS: 217 IFN beta 1a (Avonex) and 219 placebo (unspecified) patients. | |
| Interventions | Weekly IM injections of IFNb‐1a (60 ug) versus placebo (unspecified) for 24 months. | |
| Outcomes | Primary: Baseline to month 24 change in the MS Functional Composite (MSFC), MSFC Z‐score change. Others : Clinical outcomes: number of patients with EDSS worsening or stable, time to EDSS worsening, defined as a 1.0 step increase for baseline EDSS 3.5 to 5.5 and 0.5 step increase for baseline EDSS 6.0 to 6.5 sustained for 3 months. Relapse rate, Quality of life (The MS Quality of Life Inventory (MSQLI), and depression (The Beck Depression Inventory). MRI Outcome: Total volumes of T2‐hyperintense lesions and Gd‐enhancing lesions. | |
| Notes | Biogen, Inc. supported this study | |
| Risk of bias | ||
| Bias | Authors' judgement | Support for judgement |
| Random sequence generation (selection bias) | Low risk | The contract research organization computer generated two minimization schemes, one for North America and one for Europe and Israel (page 680). |
| Allocation concealment (selection bias) | Unclear risk | Not reported any comments on this aspect. |
| Incomplete outcome data (attrition bias) | Low risk | Lost to follow‐up 52 patients (P 23; T 29 ) /436 (12 %). Reasons for withdrawal were reported. |
| Other bias | High risk | In FDA’s letters of July 23, 1998, December 6, 1999, and March 8,2000, Biogen was informed that the proposed primary endpoint, the Multiple Sclerosis Functional Composite (MSFC) had not been validated as a clinical efficacy outcome measurement and therefore, was not appropriate for use as a primary efficacy endpoint in a Phase 3 study (FDA 2001; Cohen 2002 (IMPACT)). |
| Blinding of participants and personnel (performance bias) | Unclear risk | Patients were instructed to cover injection sites. No blinding questionnaire was conducted at study termination. |
| Blinding of outcome assessment (detection bias) | Low risk | The examining technician administered the MSFC, and the examining neurologist determined the EDSS during all scheduled study visits.Neither the examining technician nor the examining neurologist was involved with any other aspect of subject care, and neither had access to the results of prior examinations or to clinical information that might compromise blinding. |
| Methods | Randomized, double‐blind, placebo‐controlled, four‐arm trial. It was a multicentre study, performed in United States (31 centers) and Canada (4). | |
| Participants | 939 patients with SPMS: 631 treated with IFN beta‐1b (Betaferon, 2 arms with different dosages) and 308 placebo‐treated. | |
| Interventions | Subcutaneous injection every other day of IFN‐1b 250 ug (8.0 million international units [MIU]), IFN‐1b 160ug (5 MIU)/m2 body surface area (mean administered dose 220 ug) or one of two placebo treatments, for 36 months. | |
| Outcomes | Primary: The time to progression on the EDSS, defined as an increase from baseline by more than 1.0 point (or 0.5 points if the baseline EDSS score was 6.0 to 6.5 ) and confirmed at two consecutive scheduled visits separated by 6 months. Secondary : Clinical : Mean EDSS change, annual relapse rate, change in composite neuropsychological test score (Rao Brief Repeatable Battery). MRI: absolute change in T2‐weighted lesion area (assessed annually)from baseline to end point,annual new active lesion rate (new, recurrent, and newly enlarging or enhancing lesions per year on study) (Monthly scanning for Frequent MRI substudy population, n=163). Tertiary : Clinical: proportion of subjects with confirmed disease progression, relapse‐related endpoints, social handicap (Environmental Status Scale), Quality of Life (MSQLI), depression (Beck Depression Inventory). | |
| Notes | Funded by Berlex Laboratories, Montville, NJ. | |
| Risk of bias | ||
| Bias | Authors' judgement | Support for judgement |
| Random sequence generation (selection bias) | Low risk | Each block allocated 2 subjects to fixed‐dose Betaseron, 2 to Body Surface Area (BSA)‐adjusted Betaseron, 1 to fixed placebo, and 1 to BSA‐adjusted placebo. Each site received an adequate number of blocks, based on projected subject recruitment, to ensure sequential subject numbering within each site. The randomisation schedule was generated by the Biostatistics and Data Management Group of Berlex Laboratories (Richmond, CA) using an SAS program (Cary, NC). |
| Allocation concealment (selection bias) | Low risk | The biostatistician and supporting programmers were the only individuals with access to the randomisation codes.The active study drug was indistinguishable from placebo in appearance, smell and colour, and labels and packages for active study agent and placebo were indistinguishable. |
| Incomplete outcome data (attrition bias) | High risk | Only 72% of randomised patients were included in analysis (FDA 2001 page 26). |
| Other bias | High risk | The Independent Data and Safety Monitoring Board recommended early termination of the trial based on the results of a planned interim analysis indicating that continuing the trial was unlikely to change the results.The study initiated in August 2, 1995, interrupted November 22, 1999. The last patient enrolled on April 1, 1997. The final patient visit occurred on November 15, 1999. |
| Blinding of participants and personnel (performance bias) | High risk | Patients and treating physicians were more likely to guess treatment allocation correctly due to side effects. |
| Blinding of outcome assessment (detection bias) | Low risk | Separate treating and examining physicians were employed. A questionnaire to evaluate the success of blinding was made: results suggest a substantial maintenance of blinding for the critical evaluation physicians (FDA 2001). |
| Methods | Randomized, double‐blind, placebo‐controlled, three‐arm trial. It was a multicentre study (22) performed in Europe, Canada and Australia. | |
| Participants | 618 patients with SPMS: 413 treated with IFN beta‐1a (2 arms with different dosages= 204 Rebif 44ug and 209 Rebif 22ug) and 205 placebo (unspecified) patients. | |
| Interventions | Subcutaneous injection, three times weekly of IFN‐1a (Rebif) at 2 different dosages (22 and 44 ug) or placebo (unspecified) treatments, for 36 months. | |
| Outcomes | Primary: The time to progression on the EDSS, defined as an increase from baseline by more than 1.0 point (or 0.5 points if baseline EDSS was < 5.5), confirmed at two consecutive scheduled visits separated by 3 months. Secondary : Clinical : proportion of patients progressing, exacerbation count, time to first exacerbation, time between first and second exacerbations, number of moderate and severe exacerbations, number of steroid courses, number of hospitalizations, and Integrated Disability Status Score (IDSS, defined by area under an EDSS time‐curve adjusted for baseline). MRI: lesion burden, T2 activity (New T2, recurrent T2, newly enlarging T2, and persistently enlarging T2 lesions) enhancing lesions and Combined Unique (CU) activity analysis: (Monthly scanning for Frequent MRI substudy population, n=283). | |
| Notes | Funded by Serono International SA, Geneva, Switzerland. | |
| Risk of bias | ||
| Bias | Authors' judgement | Support for judgement |
| Random sequence generation (selection bias) | Low risk | Computer generated randomisation list provided by Serono, stratified by center; treatments were equally allocated with a block size of six. |
| Allocation concealment (selection bias) | Low risk | The block size was not revealed to the investigators.The manufacturer labelled containers of study medication with patient identification numbers based on the randomisation list, and patients received the medication labelled with their numbers. |
| Incomplete outcome data (attrition bias) | Low risk | Lost to follow‐up 47/618 patients (44 ug = 14, 22 ug =14, Placebo= 19) (8 %). |
| Other bias | Low risk | |
| Blinding of participants and personnel (performance bias) | Unclear risk | Patients were instructed to cover injection sites and to discuss only neurologic matters during neurologic evaluations. Blinding questionnaire was conducted at study termination. |
| Blinding of outcome assessment (detection bias) | Low risk | Solutions of IFNb‐1a and placebo were physically indistinguishable, and packaging and labelling were prepared to preserve blinding neurologic assessments. Separate treating and examining physicians were employed. Patients were instructed to cover injection sites and to discuss only neurologic matters during neurologic evaluations. Evaluating physicians guessed treatment assignments correctly for 29% of patients on active treatment and 26% of patients on placebo. |
| Methods | Randomized, double‐blind, placebo‐controlled, two‐arm trial. It was a multicentre study (32) performed in European countries. | |
| Participants | 718 patients with SP MS: 360 treated with IFN beta 1b (Betaferon) and 358 placebo‐treated. | |
| Interventions | Subcutaneous injection every other day of IFN‐1b 250 ug (8.0 million international units [MIU]), or placebo (unspecified) treatments, for 36 months. | |
| Outcomes | Primary: The time to progression on the EDSS, defined as an increase from baseline by more than 1.0 point (or 0.5 points if baseline EDSS was 6), confirmed at two consecutive scheduled visits separated by 3 months, not obtained during relapses. Secondary : Clinical : proportion of patients with confirmed progression,Time to becoming wheelchair‐bound,Proportion of patients becoming wheelchair bound,Change in EDSS from baseline,Annual relapse rate,Time to first relapse, Proportion of patients with moderate or severe relapse. Tertiary : MS‐related steroid use and hospital admissions. Montgomery Asberg Depression RatingScale (MADRS) to assess mood changes and suicidal risk. MRI :Percentage change in annual T2 lesion volume. (Monthly scanning for Frequent MRI substudy population, n=125)T1‐weighted gadolinium‐enhanced scans in months 0–6 and 18–24. | |
| Notes | This study was funded by Schering AG, Berlin. The cognitive function evaluation was included in the protocol Polman 1995 but results were not retrieved in the primary study. | |
| Risk of bias | ||
| Bias | Authors' judgement | Support for judgement |
| Random sequence generation (selection bias) | Low risk | Central randomisation schedule assigned placebo or interferon ‐1b to blocks of six patients in a 1/1 ratio. |
| Allocation concealment (selection bias) | Low risk | Access to the code was strictly limited according to study protocol. |
| Incomplete outcome data (attrition bias) | High risk | 1/4 of randomised patients were lost to follow‐up. Due to early study termination, at 33 months primary outcome was not available for 187/718 patients (26%) of the randomised patients; placebo= 97/358 (27%), treated= 90/360 (25%). Is not clear which data were used for analysis. |
| Other bias | High risk | In November 20, 1997, a planned interim analysis was done after all patients had been in the study for at least 2 years.The results gave evidence of efficacy and led to a recommendation to the early termination of the study. The study has been initiated in September 1994 and stopped in March 1998. EDSS information at month 33 was available for three‐fourths of patients in both treatment groups in the final data set, compared with 40% in the interim analysis (Kappos 2001, page 1971). |
| Blinding of participants and personnel (performance bias) | High risk | 54·3% of 304 patients guessed correctly that they were on placebo and 65·6% of 308 that they were on active treatment. |
| Blinding of outcome assessment (detection bias) | Unclear risk | Interferon beta‐1b was indistinguishable from placebo. Separate treating and examining physicians were employed. Separate designated EDSS raters performed only the standardized neurologic tests EDSS physicians received no potentially unmasking information from the treating physicians, and were allowed to speak to patients only as necessary to carry out neurological tests. During EDSS assessments all potential injection sites were covered. Blinding questionnaire was conducted at study termination; EDSS physicians guessed correctly for only 54 (18.6%) of 291 of patients on placebo and 65 (20.8%) of 312 patients on interferon ‐1b. "The data at study termination were collected under double‐blind conditions and comprise the data collected after database lock for the interim analysis until the beginning of the open‐label extension phase" (Kappos 2001 page 1970). It is unclear if the 3 years evaluation was double blind or open for the early study termination. |
Characteristics of excluded studies [ordered by study ID]
Ir a:
| Study | Reason for exclusion |
| Treatment is Lenercept | |
| Treatment is BHT‐3009, a tolerizing DNA vaccine encoding full‐length human myelin basic protein | |
| Randomized, double‐blind, parallel group, comparative trial evaluating the safety and tolerability of two formulations of IFNb (IFNbeta‐1b‐G or the refrigeration‐free formulation (IFNbeta‐1b‐M) in patients with relapsing‐remitting or secondary progressive MS. | |
| Patients with secondary progressive MS in a randomized, double‐blind, placebo‐controlled study evaluating short course of antibodies (AB) to IFN‐gamma or AB to tumour necrosis factor (TNF)‐alpha | |
| Relapsing remitting MS patients randomised to receive EMLA cream or placebo cream 2 hr before IFNβ‐1a injection once weekly | |
| Treatment is donepezil | |
| Prospective open label evaluating combination therapy with interferon beta 1 b and azathioprine in secondary progressive MS. | |
| A randomized, double‐masked, dose‐comparison, phase II study of intravenous methyprednisolone in patients with secondary progressive multiple sclerosis. | |
| The treatment is complex of human leukocyte antigen‐DR2 with myelin basic protein84‐102 (AG284). | |
| MS patients suffered from an acute relapse , treated with intravenous methylprednisolone, participating in a double‐blind, placebo‐controlled, | |
| Double‐blind, placebo‐controlled trial of two doses of interferon ‐1a in primary progressive MS patients. | |
| study on the effect of interferon beta in primary progressive MS. | |
| Treatment is natural interferon beta derived from human fibroblasts (Ares‐Serono@). | |
| Open‐label, non‐randomised, observational study. | |
| Double‐blind, placebo‐controlled, study. In secondary progressive MS randomized to three groups (antibodies to TNF‐a, to IFN‐g; and placebo). | |
| Combination therapy with pulse cyclophosphamide given with methylprednisolone | |
| A double‐blind, placebo‐controlled trial in patients with relapsing‐remitting and secondary progressive MS randomized to infusions of anti‐4 integrin antibody (natalizumab; Antegren) or placebo. | |
| Multicenter study evaluating the effect of Rebif 22 in relapsing remitting and secondary progressive MS. |
Data and analyses
| Outcome or subgroup title | No. of studies | No. of participants | Statistical method | Effect size |
| 1 Sustained (6 months) EDSS increase after 3 years Show forest plot | 3 | 2026 | Risk Ratio (M‐H, Random, 95% CI) | 0.98 [0.82, 1.16] |
| Analysis 1.1  Comparison 1 Disability progression, Outcome 1 Sustained (6 months) EDSS increase after 3 years. | ||||
| 2 Sustained (3 or 6 months) EDSS increase at 3 years in patients with or without pre‐study relapses Show forest plot | 3 | Risk Ratio (M‐H, Random, 95% CI) | Subtotals only | |
| Analysis 1.2  Comparison 1 Disability progression, Outcome 2 Sustained (3 or 6 months) EDSS increase at 3 years in patients with or without pre‐study relapses. | ||||
| 2.1 In patients with pre study relapses | 3 | 1106 | Risk Ratio (M‐H, Random, 95% CI) | 0.90 [0.75, 1.09] |
| 2.2 In patients without pre‐study relapses | 3 | 903 | Risk Ratio (M‐H, Random, 95% CI) | 1.05 [0.83, 1.33] |
| 3 Sustained (3 months) EDSS increase Show forest plot | 3 | Risk Ratio (M‐H, Random, 95% CI) | Subtotals only | |
| Analysis 1.3  Comparison 1 Disability progression, Outcome 3 Sustained (3 months) EDSS increase. | ||||
| 3.1 After 2 years | 2 | 1054 | Risk Ratio (M‐H, Random, 95% CI) | 0.94 [0.81, 1.08] |
| 3.2 After 3 years | 2 | 1336 | Risk Ratio (M‐H, Random, 95% CI) | 0.88 [0.80, 0.97] |
| 4 Sustained (3 or 6 months') EDSS increase according to pre‐study clinical characteristics of patients Show forest plot | 5 | Risk Ratio (M‐H, Fixed, 95% CI) | Subtotals only | |
| Analysis 1.4  Comparison 1 Disability progression, Outcome 4 Sustained (3 or 6 months') EDSS increase according to pre‐study clinical characteristics of patients. | ||||
| 4.1 low age and disease duration | 2 | 1336 | Risk Ratio (M‐H, Fixed, 95% CI) | 0.92 [0.83, 1.02] |
| 4.2 high age and disease duration | 3 | 1739 | Risk Ratio (M‐H, Fixed, 95% CI) | 1.03 [0.90, 1.18] |
| Outcome or subgroup title | No. of studies | No. of participants | Statistical method | Effect size |
| 1 Total number of patients with Serious AEs Show forest plot | 5 | 3082 | Risk Ratio (M‐H, Random, 95% CI) | 1.00 [0.83, 1.19] |
| Analysis 2.1  Comparison 2 Adverse Events, Outcome 1 Total number of patients with Serious AEs. | ||||
| 2 Patients who had discontinuated for AEs (including SAEs) * Show forest plot | 5 | 3082 | Risk Ratio (M‐H, Random, 95% CI) | 2.62 [1.92, 3.57] |
| Analysis 2.2  Comparison 2 Adverse Events, Outcome 2 Patients who had discontinuated for AEs (including SAEs) *. | ||||
| 3 Deaths Show forest plot | 5 | 3082 | Risk Ratio (M‐H, Random, 95% CI) | 1.41 [0.58, 3.42] |
| Analysis 2.3  Comparison 2 Adverse Events, Outcome 3 Deaths. | ||||
| 4 Patients who done or attempted suicide Show forest plot | 4 | 2441 | Risk Ratio (M‐H, Random, 95% CI) | 0.83 [0.36, 1.95] |
| Analysis 2.4  Comparison 2 Adverse Events, Outcome 4 Patients who done or attempted suicide. | ||||
| 5 Allergy/Rash (number of events) Show forest plot | 2 | 1657 | Risk Ratio (M‐H, Random, 95% CI) | 1.57 [0.99, 2.48] |
| Analysis 2.5  Comparison 2 Adverse Events, Outcome 5 Allergy/Rash (number of events). | ||||
| 6 Cutaneous necrosis * Show forest plot | 3 | Risk Ratio (M‐H, Random, 95% CI) | Subtotals only | |
| Analysis 2.6  Comparison 2 Adverse Events, Outcome 6 Cutaneous necrosis *. | ||||
| 6.1 Number of events | 2 | 1336 | Risk Ratio (M‐H, Random, 95% CI) | 33.02 [4.57, 238.79] |
| 6.2 Number of patients | 2 | 1557 | Risk Ratio (M‐H, Random, 95% CI) | 18.76 [3.72, 94.61] |
| 7 Injection site reactions * Show forest plot | 5 | Risk Ratio (M‐H, Random, 95% CI) | Subtotals only | |
| Analysis 2.7  Comparison 2 Adverse Events, Outcome 7 Injection site reactions *. | ||||
| 7.1 Number of events | 2 | 1657 | Risk Ratio (M‐H, Random, 95% CI) | 3.84 [3.11, 4.74] |
| 7.2 Number of patients | 3 | 1425 | Risk Ratio (M‐H, Random, 95% CI) | 1.60 [0.84, 3.07] |
| 8 Patients with psychiatric disorders Show forest plot | 5 | 3082 | Risk Ratio (M‐H, Random, 95% CI) | 1.05 [0.94, 1.18] |
| Analysis 2.8  Comparison 2 Adverse Events, Outcome 8 Patients with psychiatric disorders. | ||||
| 9 Patients with headache Show forest plot | 3 | 1746 | Risk Ratio (M‐H, Random, 95% CI) | 1.24 [0.97, 1.60] |
| Analysis 2.9  Comparison 2 Adverse Events, Outcome 9 Patients with headache. | ||||
| 10 Patients with influenza like syndrome * Show forest plot | 4 | 2364 | Risk Ratio (M‐H, Random, 95% CI) | 1.45 [1.01, 2.07] |
| Analysis 2.10  Comparison 2 Adverse Events, Outcome 10 Patients with influenza like syndrome *. | ||||
| 11 Patients with myalgia Show forest plot | 3 | 1746 | Risk Ratio (M‐H, Random, 95% CI) | 1.30 [0.93, 1.83] |
| Analysis 2.11  Comparison 2 Adverse Events, Outcome 11 Patients with myalgia. | ||||
| 12 Patients with fatigue/asthenia Show forest plot | 3 | 1746 | Risk Ratio (M‐H, Random, 95% CI) | 1.09 [0.98, 1.22] |
| Analysis 2.12  Comparison 2 Adverse Events, Outcome 12 Patients with fatigue/asthenia. | ||||
| 13 Patients with leucopenia * Show forest plot | 3 | 1921 | Risk Ratio (M‐H, Random, 95% CI) | 2.25 [1.06, 4.75] |
| Analysis 2.13  Comparison 2 Adverse Events, Outcome 13 Patients with leucopenia *. | ||||
| 14 Patients with liver dysfunction Show forest plot | 2 | 1310 | Risk Ratio (M‐H, Random, 95% CI) | 1.69 [0.97, 2.95] |
| Analysis 2.14  Comparison 2 Adverse Events, Outcome 14 Patients with liver dysfunction. | ||||
| Outcome or subgroup title | No. of studies | No. of participants | Statistical method | Effect size |
| 1 Number of patients with at least one relapse during follow Show forest plot | 5 | Risk Ratio (M‐H, Random, 95% CI) | Subtotals only | |
| Analysis 3.1  Comparison 3 Relapses' outcomes, Outcome 1 Number of patients with at least one relapse during follow. | ||||
| 1.1 After 2 years | 1 | 436 | Risk Ratio (M‐H, Random, 95% CI) | 0.72 [0.54, 0.95] |
| 1.2 After 3 years | 4 | 2639 | Risk Ratio (M‐H, Random, 95% CI) | 0.91 [0.84, 0.97] |
| 2 Relapse rate Show forest plot | 4 | Mean Difference (IV, Random, 95% CI) | Subtotals only | |
| Analysis 3.2  Comparison 3 Relapses' outcomes, Outcome 2 Relapse rate. | ||||
| 2.1 After 2 years | 1 | 436 | Mean Difference (IV, Random, 95% CI) | ‐0.12 [‐0.20, ‐0.04] |
| 2.2 After 3 years | 3 | 1752 | Mean Difference (IV, Random, 95% CI) | ‐0.16 [‐0.21, ‐0.10] |
| Outcome or subgroup title | No. of studies | No. of participants | Statistical method | Effect size |
| 1 Number of patients with combined lesions at different times (6, 9 and 24 months) Show forest plot | 2 | Risk Ratio (M‐H, Random, 95% CI) | Subtotals only | |
| Analysis 4.1  Comparison 4 MRI: role of treatment, Outcome 1 Number of patients with combined lesions at different times (6, 9 and 24 months). | ||||
| 1.1 6 months | 1 | 125 | Risk Ratio (M‐H, Random, 95% CI) | 0.70 [0.52, 0.95] |
| 1.2 9 months | 1 | 264 | Risk Ratio (M‐H, Random, 95% CI) | 0.51 [0.42, 0.62] |
| 1.3 24 months | 1 | 109 | Risk Ratio (M‐H, Random, 95% CI) | 0.52 [0.33, 0.80] |
| 2 Mean absolute change of T2 lesion load Show forest plot | 2 | Mean Difference (IV, Random, 95% CI) | Subtotals only | |
| Analysis 4.2  Comparison 4 MRI: role of treatment, Outcome 2 Mean absolute change of T2 lesion load. | ||||
| 2.1 1 year | 2 | 1022 | Mean Difference (IV, Random, 95% CI) | ‐1.74 [‐3.25, ‐0.23] |
| 2.2 2 years | 2 | 956 | Mean Difference (IV, Random, 95% CI) | ‐2.56 [‐5.08, ‐0.05] |
| 2.3 3 years | 1 | 567 | Mean Difference (IV, Random, 95% CI) | ‐4.87 [‐6.22, ‐3.52] |

Study flow diagram.
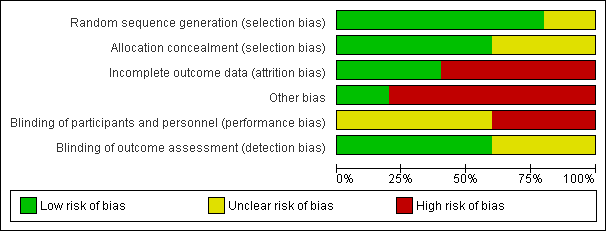
Risk of bias graph: review authors' judgements about each risk of bias item presented as percentages across all included studies.

Risk of bias summary: review authors' judgements about each risk of bias item for each included study.
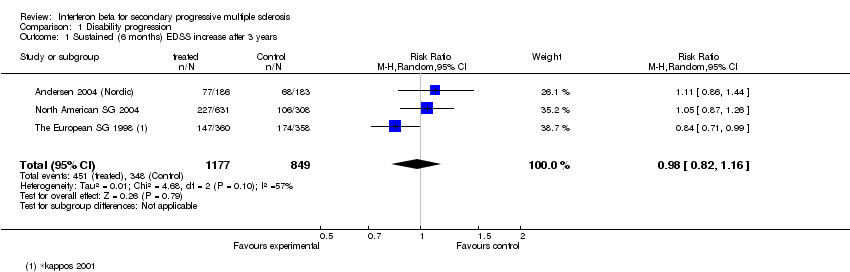
Comparison 1 Disability progression, Outcome 1 Sustained (6 months) EDSS increase after 3 years.
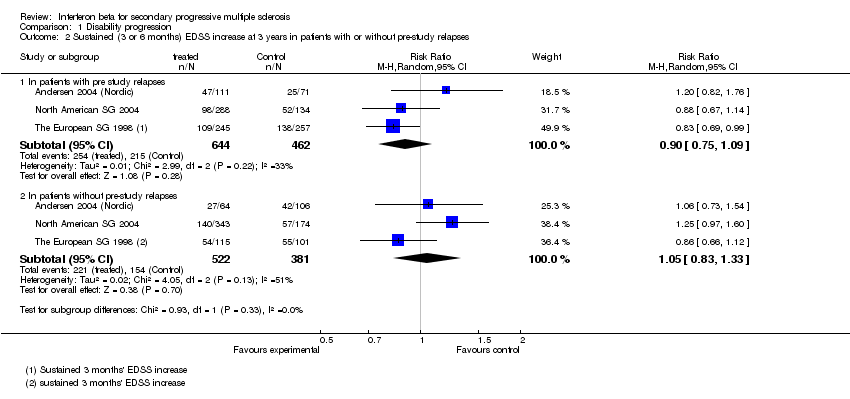
Comparison 1 Disability progression, Outcome 2 Sustained (3 or 6 months) EDSS increase at 3 years in patients with or without pre‐study relapses.

Comparison 1 Disability progression, Outcome 3 Sustained (3 months) EDSS increase.

Comparison 1 Disability progression, Outcome 4 Sustained (3 or 6 months') EDSS increase according to pre‐study clinical characteristics of patients.

Comparison 2 Adverse Events, Outcome 1 Total number of patients with Serious AEs.
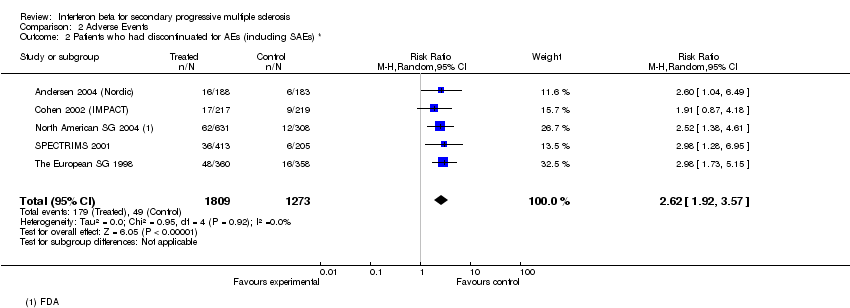
Comparison 2 Adverse Events, Outcome 2 Patients who had discontinuated for AEs (including SAEs) *.

Comparison 2 Adverse Events, Outcome 3 Deaths.
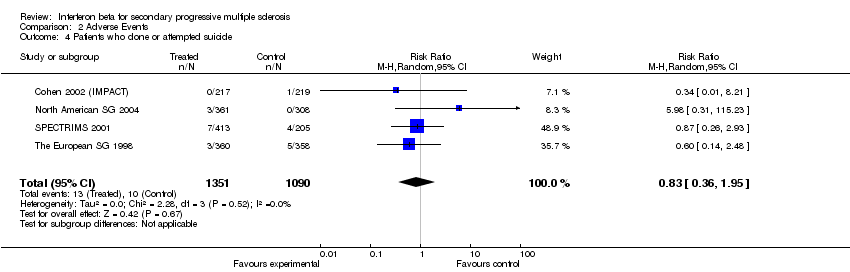
Comparison 2 Adverse Events, Outcome 4 Patients who done or attempted suicide.
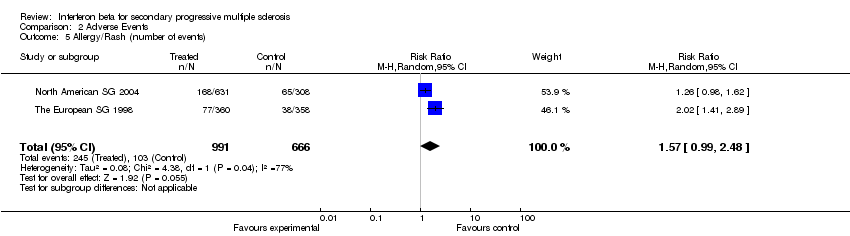
Comparison 2 Adverse Events, Outcome 5 Allergy/Rash (number of events).

Comparison 2 Adverse Events, Outcome 6 Cutaneous necrosis *.
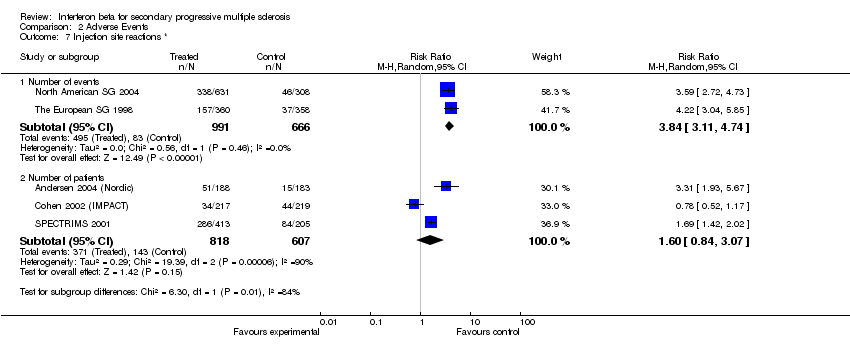
Comparison 2 Adverse Events, Outcome 7 Injection site reactions *.
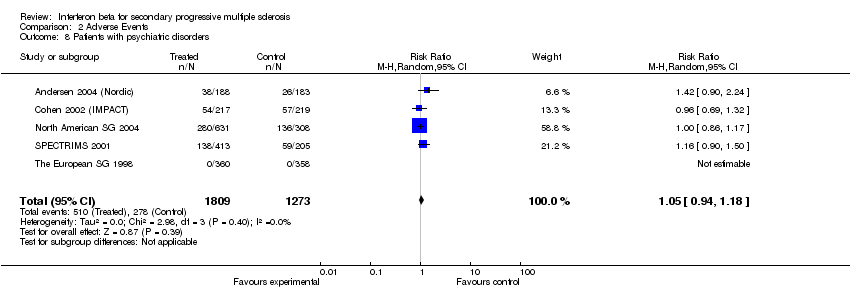
Comparison 2 Adverse Events, Outcome 8 Patients with psychiatric disorders.

Comparison 2 Adverse Events, Outcome 9 Patients with headache.
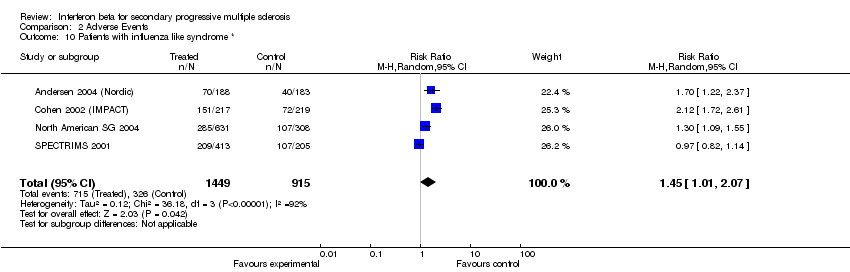
Comparison 2 Adverse Events, Outcome 10 Patients with influenza like syndrome *.
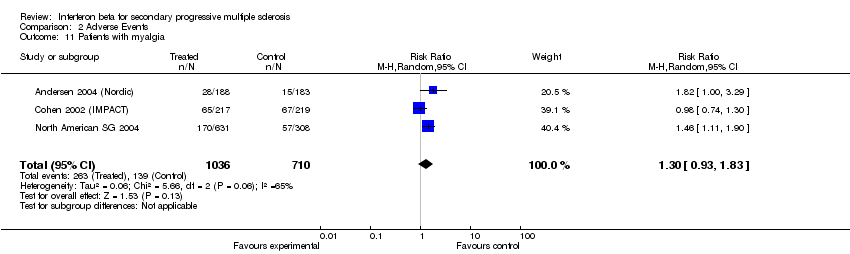
Comparison 2 Adverse Events, Outcome 11 Patients with myalgia.
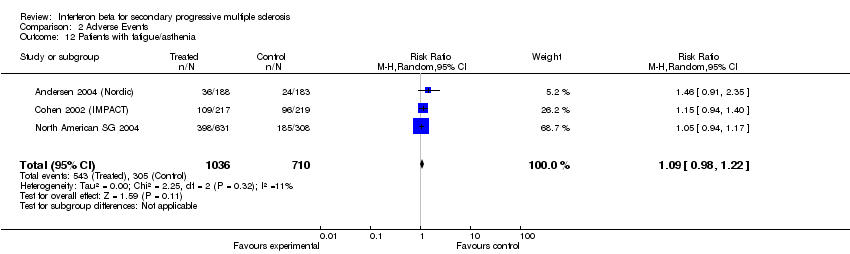
Comparison 2 Adverse Events, Outcome 12 Patients with fatigue/asthenia.
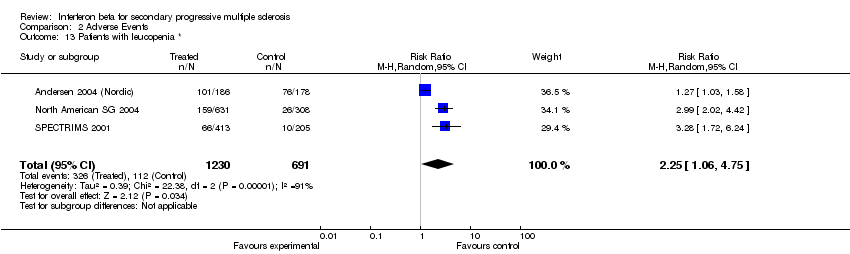
Comparison 2 Adverse Events, Outcome 13 Patients with leucopenia *.
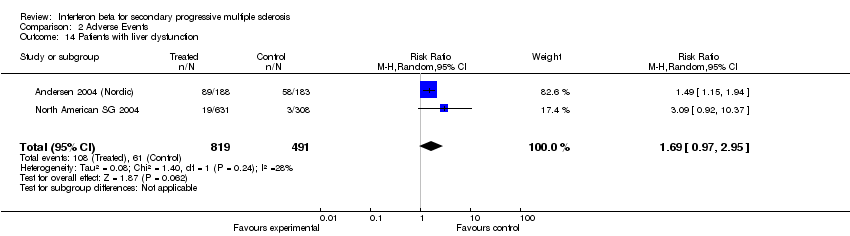
Comparison 2 Adverse Events, Outcome 14 Patients with liver dysfunction.

Comparison 3 Relapses' outcomes, Outcome 1 Number of patients with at least one relapse during follow.

Comparison 3 Relapses' outcomes, Outcome 2 Relapse rate.
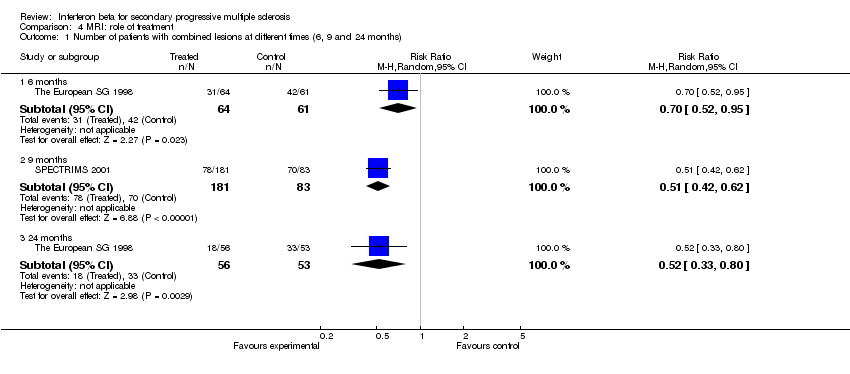
Comparison 4 MRI: role of treatment, Outcome 1 Number of patients with combined lesions at different times (6, 9 and 24 months).

Comparison 4 MRI: role of treatment, Outcome 2 Mean absolute change of T2 lesion load.
| INTERFERONS for secondary progressive multiple sclerosis | ||||||
| Patient or population: patients with secondary progressive multiple sclerosis | ||||||
| Outcomes | Illustrative comparative risks* (95% CI) | Relative effect | No of Participants | Quality of the evidence | Comments | |
| Assumed risk | Corresponding risk | |||||
| Control | INTERFERONS | |||||
| Sustained (6 months) EDSS increase after 3 years | Study population | RR 0.98 | 2026 | HIGH | RCTs low risk of bias Heterogeneity probably due to different clinical characteristics of patients | |
| 410 per 1000 | 402 per 1000 | |||||
| Moderate | ||||||
| 372 per 1000 | 365 per 1000 | |||||
| Sustained (3 months) EDSS increase after 3 years | Study population | RR 0.88 | 1336 | HIGH | ||
| 579 per 1000 | 510 per 1000 | |||||
| Moderate | ||||||
| 594 per 1000 | 523 per 1000 | |||||
| Sustained (3 or 6 months) EDSS increase at 3 years in patients with pre study relapses | Study population | RR 0.9 | 1106 | HIGH | ||
| 465 per 1000 | 419 per 1000 | |||||
| Moderate | ||||||
| 388 per 1000 | 349 per 1000 | |||||
| Number of patients with at least one relapse during follow‐up ‐ after 3 years | Study population | RR 0.91 | 2639 | HIGH | ||
| 530 per 1000 | 482 per 1000 | |||||
| Moderate | ||||||
| 509 per 1000 | 463 per 1000 | |||||
| *The basis for the assumed risk (e.g. the median control group risk across studies) is provided in footnotes. The corresponding risk (and its 95% confidence interval) is based on the assumed risk in the comparison group and the relative effect of the intervention (and its 95% CI). | ||||||
| GRADE Working Group grades of evidence | ||||||
| Study Name | Intervention | Number of patients | % of female | Age ‐ mean (SD) | Baseline EDSS ‐ mean (SD) | Disease duration ‐ mean (SD) | Pre‐study change* in EDSS ‐ mean (SD) | Pre‐study progression duration* ‐ mean (SD) | Pre‐study number of relapses* ‐ mean (SD) | Pre‐study % of patients without relapse* |
| Rebif 22µg weekly | 188 | 60 | 45.1 (nr) | 4.7 (nr) | 14.2 (nr) | nr | 4.8 (nr) | 1.7 (0.4) | 40 | |
| Placebo | 183 | 60 | 46.4 (nr) | 5.0 (nr) | .14.4 (nr) | nr | 6.1 (nr) | 1.6 (0.4) | 34 | |
| Avonex 60µg weekly | 217 | 64 | 47.2 (8.2) | 5.2 (1.1) | 16.2 (9.0) | nr | nr | 1.5 (2.1) | 37 | |
| Placebo | 219 | 64 | 47.9 (7.7) | 5.2 (1.1) | 16.7 (9.0) | nr | nr | 1.3 (2.1) | 44 | |
| Betaferon 250µg, every other day | 317 | 66 | 46.1 (8.0) | 5.2 (1.1) | 14.6 (7.8) | 1.7 (0.9) | 4.0 (3.3) | 0.8 (1.1) | 54 | |
| Betaferon 160µg/m2, every other day | 314 | 61 | 46.8 (8.3) | 5.1 (1.2) | 14.5 (8.7) | 1.7 (0.9) | 4.1 (3.5) | 0.9 (1.6) | 55 | |
| Placebo | 308 | 60 | 47.6 (8.2) | 5.1 +1.1 | 14.9 (8.3) | 1.7 (0.9) | 4.1 (3.5) | 0.8 (1.2) | 56 | |
| Rebif 44µg, three times weekly | 204 | 67 | 42.6 (7.3) | 5.3 + 1.1 | 12.9 (6.9) | 1.5 (0.8) | 3.7 (2.7) | 0.9 (1.3) | 52 | |
| Rebif 22µg, three times weekly | 209 | 62 | 43.1 (7.2) | 5.5 (1.1) | 13.3 (7.4) | 1.6 (0.9) | 4.2 (3.1) | 0.9 (1.4) | 54 | |
| Placebo | 205 | 60 | 42.7 (6.8) | 5.4 (1.1) | 13.7 (7.2) | 1.7 (1.0) | 4.1 (3.2) | 0.9 (1.2) | 52 | |
| Betaferon 250µg, every other day | 360 | 58·1 | 41·1 (7·2) | 5·1 (1·1) | 12.8 (6.6) | 1.5 (nr) | 3·8 (2·7) | 1.7 (0.85) | 32 | |
| Placebo | 358 | 64·2 | 40·9 (7·2) | 5·2 (1·1) | 13.4 (7.5) | 3·8 (3·4) | 28 | |||
| * Pre‐study length of observation: 4 years (Andersen 2004 (Nordic)) ; 3 years (Cohen 2002 (IMPACT) ; 2 years (North American SG 2004 ; SPECTRIMS 2001 ; The European SG 1998) | ||||||||||
| Outcome or subgroup title | No. of studies | No. of participants | Statistical method | Effect size |
| 1 Sustained (6 months) EDSS increase after 3 years Show forest plot | 3 | 2026 | Risk Ratio (M‐H, Random, 95% CI) | 0.98 [0.82, 1.16] |
| 2 Sustained (3 or 6 months) EDSS increase at 3 years in patients with or without pre‐study relapses Show forest plot | 3 | Risk Ratio (M‐H, Random, 95% CI) | Subtotals only | |
| 2.1 In patients with pre study relapses | 3 | 1106 | Risk Ratio (M‐H, Random, 95% CI) | 0.90 [0.75, 1.09] |
| 2.2 In patients without pre‐study relapses | 3 | 903 | Risk Ratio (M‐H, Random, 95% CI) | 1.05 [0.83, 1.33] |
| 3 Sustained (3 months) EDSS increase Show forest plot | 3 | Risk Ratio (M‐H, Random, 95% CI) | Subtotals only | |
| 3.1 After 2 years | 2 | 1054 | Risk Ratio (M‐H, Random, 95% CI) | 0.94 [0.81, 1.08] |
| 3.2 After 3 years | 2 | 1336 | Risk Ratio (M‐H, Random, 95% CI) | 0.88 [0.80, 0.97] |
| 4 Sustained (3 or 6 months') EDSS increase according to pre‐study clinical characteristics of patients Show forest plot | 5 | Risk Ratio (M‐H, Fixed, 95% CI) | Subtotals only | |
| 4.1 low age and disease duration | 2 | 1336 | Risk Ratio (M‐H, Fixed, 95% CI) | 0.92 [0.83, 1.02] |
| 4.2 high age and disease duration | 3 | 1739 | Risk Ratio (M‐H, Fixed, 95% CI) | 1.03 [0.90, 1.18] |
| Outcome or subgroup title | No. of studies | No. of participants | Statistical method | Effect size |
| 1 Total number of patients with Serious AEs Show forest plot | 5 | 3082 | Risk Ratio (M‐H, Random, 95% CI) | 1.00 [0.83, 1.19] |
| 2 Patients who had discontinuated for AEs (including SAEs) * Show forest plot | 5 | 3082 | Risk Ratio (M‐H, Random, 95% CI) | 2.62 [1.92, 3.57] |
| 3 Deaths Show forest plot | 5 | 3082 | Risk Ratio (M‐H, Random, 95% CI) | 1.41 [0.58, 3.42] |
| 4 Patients who done or attempted suicide Show forest plot | 4 | 2441 | Risk Ratio (M‐H, Random, 95% CI) | 0.83 [0.36, 1.95] |
| 5 Allergy/Rash (number of events) Show forest plot | 2 | 1657 | Risk Ratio (M‐H, Random, 95% CI) | 1.57 [0.99, 2.48] |
| 6 Cutaneous necrosis * Show forest plot | 3 | Risk Ratio (M‐H, Random, 95% CI) | Subtotals only | |
| 6.1 Number of events | 2 | 1336 | Risk Ratio (M‐H, Random, 95% CI) | 33.02 [4.57, 238.79] |
| 6.2 Number of patients | 2 | 1557 | Risk Ratio (M‐H, Random, 95% CI) | 18.76 [3.72, 94.61] |
| 7 Injection site reactions * Show forest plot | 5 | Risk Ratio (M‐H, Random, 95% CI) | Subtotals only | |
| 7.1 Number of events | 2 | 1657 | Risk Ratio (M‐H, Random, 95% CI) | 3.84 [3.11, 4.74] |
| 7.2 Number of patients | 3 | 1425 | Risk Ratio (M‐H, Random, 95% CI) | 1.60 [0.84, 3.07] |
| 8 Patients with psychiatric disorders Show forest plot | 5 | 3082 | Risk Ratio (M‐H, Random, 95% CI) | 1.05 [0.94, 1.18] |
| 9 Patients with headache Show forest plot | 3 | 1746 | Risk Ratio (M‐H, Random, 95% CI) | 1.24 [0.97, 1.60] |
| 10 Patients with influenza like syndrome * Show forest plot | 4 | 2364 | Risk Ratio (M‐H, Random, 95% CI) | 1.45 [1.01, 2.07] |
| 11 Patients with myalgia Show forest plot | 3 | 1746 | Risk Ratio (M‐H, Random, 95% CI) | 1.30 [0.93, 1.83] |
| 12 Patients with fatigue/asthenia Show forest plot | 3 | 1746 | Risk Ratio (M‐H, Random, 95% CI) | 1.09 [0.98, 1.22] |
| 13 Patients with leucopenia * Show forest plot | 3 | 1921 | Risk Ratio (M‐H, Random, 95% CI) | 2.25 [1.06, 4.75] |
| 14 Patients with liver dysfunction Show forest plot | 2 | 1310 | Risk Ratio (M‐H, Random, 95% CI) | 1.69 [0.97, 2.95] |
| Outcome or subgroup title | No. of studies | No. of participants | Statistical method | Effect size |
| 1 Number of patients with at least one relapse during follow Show forest plot | 5 | Risk Ratio (M‐H, Random, 95% CI) | Subtotals only | |
| 1.1 After 2 years | 1 | 436 | Risk Ratio (M‐H, Random, 95% CI) | 0.72 [0.54, 0.95] |
| 1.2 After 3 years | 4 | 2639 | Risk Ratio (M‐H, Random, 95% CI) | 0.91 [0.84, 0.97] |
| 2 Relapse rate Show forest plot | 4 | Mean Difference (IV, Random, 95% CI) | Subtotals only | |
| 2.1 After 2 years | 1 | 436 | Mean Difference (IV, Random, 95% CI) | ‐0.12 [‐0.20, ‐0.04] |
| 2.2 After 3 years | 3 | 1752 | Mean Difference (IV, Random, 95% CI) | ‐0.16 [‐0.21, ‐0.10] |
| Outcome or subgroup title | No. of studies | No. of participants | Statistical method | Effect size |
| 1 Number of patients with combined lesions at different times (6, 9 and 24 months) Show forest plot | 2 | Risk Ratio (M‐H, Random, 95% CI) | Subtotals only | |
| 1.1 6 months | 1 | 125 | Risk Ratio (M‐H, Random, 95% CI) | 0.70 [0.52, 0.95] |
| 1.2 9 months | 1 | 264 | Risk Ratio (M‐H, Random, 95% CI) | 0.51 [0.42, 0.62] |
| 1.3 24 months | 1 | 109 | Risk Ratio (M‐H, Random, 95% CI) | 0.52 [0.33, 0.80] |
| 2 Mean absolute change of T2 lesion load Show forest plot | 2 | Mean Difference (IV, Random, 95% CI) | Subtotals only | |
| 2.1 1 year | 2 | 1022 | Mean Difference (IV, Random, 95% CI) | ‐1.74 [‐3.25, ‐0.23] |
| 2.2 2 years | 2 | 956 | Mean Difference (IV, Random, 95% CI) | ‐2.56 [‐5.08, ‐0.05] |
| 2.3 3 years | 1 | 567 | Mean Difference (IV, Random, 95% CI) | ‐4.87 [‐6.22, ‐3.52] |