Pentasacáridos para la prevención de la tromboembolia venosa
Resumen
Antecedentes
La tromboembolia venosa (TEV) es un trastorno común con consecuencias potencialmente graves y mortales. El método estándar de tromboprofilaxis utiliza un anticoagulante como la heparina de bajo peso molecular (HBPM) o warfarina. En los años recientes, otro tipo de anticoagulante, el pentasacárido, un inhibidor indirecto del factor Xa, ha mostrado un buen efecto anticoagulante en los ensayos clínicos. Hay tres tipos de pentasacáridos disponibles: fondaparinux de acción corta, idraparinux de acción prolongada e idrabiotaparinux. Los pentasacáridos causan escasa trombocitopenia inducida por heparina y presentan mejor tolerabilidad que la heparina no fraccionada, la HBPM y la warfarina. Sin embargo, no se ha logrado ningún consenso en cuanto a si los pentasacáridos son superiores o inferiores a otros métodos anticoagulantes.
Objetivos
Evaluar los efectos de los pentasacáridos versus otros métodos de prevención tromboembólica (tromboprofilaxis) en pacientes que requieren tratamiento anticoagulante para prevenir la tromboembolia venosa.
Métodos de búsqueda
El especialista en información del Grupo Cochrane Vascular (Cochrane Vascular Information Specialist, CIS) buscó en el registro especializado (última búsqueda marzo 2016) y en el Registro Cochrane Central de Ensayos Controlados (Cochrane Central Register of Controlled Trials) (CENTRAL; 2016, número 2). El especialista en información buscó en bases de datos de ensayos para obtener detalles de estudios en curso y no publicados. Los autores de la revisión buscaron en LILACS (Latin American and Caribbean Health Sciences) y en las listas de referencias de estudios y revisiones relevantes identificados mediante búsquedas electrónicas.
Criterios de selección
Se incluyeron ensayos controlados aleatorizados sobre cualquier tipo de pentasacárido versus otros métodos de anticoagulación (farmacéuticos o mecánicos) para la prevención de la TEV.
Obtención y análisis de los datos
Dos autores de la revisión, de forma independiente, seleccionaron los ensayos, evaluaron la calidad metodológica y extrajeron los datos en tablas predefinidas.
Resultados principales
Se incluyeron en esta revisión 25 estudios con un total de 21 004 participantes. Todos investigaron el fondaparinux para la prevención de la TEV; ninguno investigó el idraparinux o el idrabiotaparinux. Los estudios incluyeron participantes que se sometieron a cirugía abdominal, torácica, bariátrica o cirugía de revascularización coronaria; pacientes médicos hospitalizados con enfermedades agudas; pacientes que requerían inmovilización rígida o semirrígida; y aquellos con trombosis venosa superficial. La mayoría de los estudios se centró en pacientes ortopédicos. Se consideró más baja la calidad de la evidencia por la heterogeneidad entre los estudios y el reducido número de eventos que causaron imprecisión.
Cuando se comparó el fondaparinux con el placebo, se encontró menos TEV total (riesgos relativos [RR] 0,24; intervalo de confianza [IC] del 95%: 0,15 a 0,38; 5717 participantes; ocho estudios; I2 = 64%; p < 0,00001), menos TEV sintomática (RR 0,15; IC del 95%: 0,06 a 0,36; 6503 participantes; ocho estudios; I2 = 0%; p < 0,0001), menos TEV total (RR 0,25, IC del 95% 0,15 a 0,40; 5715 participantes; ocho estudios; I2 = 67%; P < 0,00001), menos TVP proximal (RR 0,12, IC del 95% 0,04 a 0,39; 2746 participantes; siete estudios; I2 = 64%; P = 0,0004) y menos embolia pulmonar total (EP) (RR 0,16; IC del 95%: 0,04 a 0,62; 6412 participantes; ocho estudios; I2 = 0%; P = 0,008) en el grupo de fondaparinux. La calidad de la evidencia fue moderada para la TEV total, la TVP total y la TVP proximal y alta para la TEV sintomática y la EP total.
Cuando se comparó el fondaparinux con la HBPM, los análisis indicaron que el fondaparinux redujo la TEV y la TVP totales (RR 0,55; IC del 95%: 0,42 a 0,73; 9339 participantes; 11 estudios; I2 = 64%; P < 0,0001; y RR 0,54; IC del 95% 0,40 a 0,71; 9356 participantes; 10 estudios; I2 = 67%; p < 0,0001, respectivamente), y mostró una tendencia hacia la reducción de la TVP proximal (RR 0,58; IC del 95%: 0,33 a 1,02; 8361 participantes; nueve estudios; I2 = 53%; p = 0,06). La TEV sintomática (RR 1,03; IC del 95%: 0,65 a 1,63; 12240 participantes; nueve estudios; I2 = 35%; P = 0,90) y la EP total (RR 1,24; IC del 95%: 0,65 a 2,34; 12350 participantes; 10 estudios; I2 = 0%; P = 0,51) no indicaron diferencias entre el fondaparinux y la HBPM. La calidad de la evidencia fue moderada para la TEV total, la TEV sintomática, la TVP total y la EP total, y baja para la TVP proximal.
Se demostró que el fondaparinux aumentó la hemorragia grave en comparación con el placebo y la HBPM (RR 2,56; IC del 95%: 1,48 a 4,44; 6659 participantes; ocho estudios; I2 = 0%; P = 0,0008; evidencia de calidad moderada; y RR 1,38; IC del 95%: 1,09 a 1,75; 12 501 participantes; 11 estudios; I2 = 24%; P = 0,008; evidencia de alta calidad, respectivamente). La mortalidad por todas las causas no fue diferente entre el fondaparinux y el placebo o la HBPM (RR 0,76; IC del 95%: 0,48 a 1,22; 6674 participantes; ocho estudios; I2 = 14%; P = 0,26; evidencia de calidad moderada; y RR 0,88; IC del 95%: 0,63 a 1,22; 12 400 participantes; 11 estudios; I2 = 0%; P = 0,44; evidencia de calidad moderada, respectivamente).
Un estudio comparó fondaparinux con dosis variables y fijas (1 mg por día) de warfarina después de la cirugía electiva de reemplazo de cadera o rodilla, y no mostró ninguna diferencia en los resultados primarios y secundarios entre el fondaparinux y las dosis tanto variables como fijas de warfarina. La calidad de la evidencia fue muy baja. Un estudio pequeño comparó fondaparinux con edoxabán en pacientes con deterioro renal grave sometidos a cirugía ortopédica del miembro inferior y no informó ningún evento tromboembólico, eventos de hemorragia grave ni muertes en ninguno de los grupos. La calidad de la evidencia fue muy baja. Un estudio pequeño comparó fondaparinux con tromboprofilaxis mecánica. Los resultados no mostraron ninguna diferencia en la TEV total y la TVP total entre el fondaparinux y la tromboprofilaxis mecánica. Este estudio no informó de ningún caso relacionado con los otros resultados de esta revisión. La calidad de la evidencia fue baja.
Hubo estudios insuficientes para permitir conclusiones significativas sobre los subgrupos de las afecciones clínicas diferentes de la cirugía ortopédica.
Conclusiones de los autores
La evidencia de calidad moderada a alta muestra que el fondaparinux es efectivo para la prevención a corto plazo de la TEV en comparación con placebo. Puede reducir la TEV total, la TVP, la EP total y la TEV sintomática, y no demuestra una reducción de las muertes en comparación con placebo. La evidencia de calidad baja a moderada muestra que el fondaparinux es más efectivo para la prevención de la TEV a corto plazo en comparación con la HBPM. Puede reducir la TEV total y la TVP total y no demuestra una reducción de las muertes en comparación con la HBPM. Sin embargo, al mismo tiempo, la evidencia de calidad moderada a alta muestra que el fondaparinux aumenta la hemorragia grave en comparación con placebo y la HBPM. Por lo tanto, cuando se elige fondaparinux para la prevención de la TEV, debe prestarse atención a los riesgos de hemorragia y de trombosis del paciente. La mayoría de los datos se derivaron de pacientes sometidos a cirugía ortopédica. Por lo tanto, la conclusión se refiere predominantemente a estos pacientes. Los datos sobre el fondaparinux para otras afecciones clínicas son escasos.
PICO
Resumen en términos sencillos
Pentasacáridos para la prevención de los coágulos sanguíneos venosos
Antecedentes
La tromboembolia venosa (TEV) es un trastorno en el cual el paciente desarrolla coágulos sanguíneos en las venas. Incluye la trombosis venosa profunda (TVP) y la embolia pulmonar (EP) potencialmente mortal. La TEV ocurre en más del 10% de los pacientes hospitalizados y es la tercera causa más frecuente de muerte entre ellos. Por lo tanto, la prevención efectiva es necesaria para los pacientes que están en alto riesgo de TEV. El método estándar de prevención incluye la administración de un anticoagulante, p.ej., heparina de bajo peso molecular (HBPM) o warfarina, entre los pacientes ortopédicos. En los años recientes, otro tipo de anticoagulante, el pentasacárido, ha mostrado un buen efecto anticoagulante en los ensayos clínicos. Hay tres tipos de pentasacáridos disponibles, a saber, fondaparinux de acción corta, idraparinux de acción prolongada e idrabiotaparinux.
Resultados clave
La revisión sistemática incluyó 25 estudios con 21 004 participantes (actualizada hasta marzo 2016). No se encontró ningún estudio sobre el idraparinux de acción prolongada ni sobre el idrabiotaparinux para la prevención de la TEV. Por lo tanto, se incluyeron sólo estudios sobre el fondaparinux de acción corta para la prevención de la TEV.
La evidencia de calidad moderada a alta muestra que el fondaparinux es efectivo para la prevención a corto plazo de la TEV en comparación con placebo. Puede reducir la TEV total, la TVP, la EP total y la TEV sintomática, y no muestra ninguna diferencia en el número de muertes en comparación con placebo. La evidencia de calidad baja a moderada muestra que el fondaparinux es efectivo para la prevención a corto plazo de la TEV en comparación con la HBPM. Puede reducir la TEV total y la TVP total y no muestra ninguna diferencia en el número de muertes en comparación con la HBPM. Al mismo tiempo, sin embargo, el fondaparinux aumenta la hemorragia grave en comparación con placebo y HBPM. Por lo tanto, cuando se elige fondaparinux para la prevención de la TEV, debe prestarse atención al riesgo de hemorragias del paciente. La mayoría de los datos se obtuvieron a partir de estudios en pacientes sometidos a cirugía ortopédica. Por lo tanto, la conclusión se refiere predominantemente a estos pacientes. Los datos sobre el fondaparinux para otros trastornos médicos como la cirugía interna, médica y abdominal son escasos.
Calidad de la evidencia
La calidad de la evidencia se disminuyó debido a los números pequeños de eventos que causaron imprecisión, y las diferencias y la inconsistencia entre los estudios. Se necesitan más ensayos clínicos de alta calidad para confirmar la eficacia y la seguridad del fondaparinux.
Authors' conclusions
Summary of findings
| Fondaparinux versus placebo for the prevention of venous thromboembolism | ||||||
| Patient or population: people requiring prevention of venous thromboembolism | ||||||
| Outcomes | Illustrative comparative risks* (95% CI) | Relative effect | Number of participants | Quality of the evidence | Comments | |
| Assumed risk | Corresponding risk | |||||
| Placebo | Fondaparinux | |||||
| Total VTE | Study population | RR 0.24 | 5717 | ⊕⊕⊕⊝ | ||
| 91 per 1000 | 22 per 1000 | |||||
| Moderate | ||||||
| 181 per 1000 | 43 per 1000 | |||||
| Symptomatic VTE | Study population | RR 0.15 | 6503 | ⊕⊕⊕⊕ | ||
| 12 per 1000 | 2 per 1000 | |||||
| Moderate | ||||||
| 7 per 1000 | 1 per 1000 | |||||
| Total DVT | Study population | RR 0.25 | 5715 | ⊕⊕⊕⊝ | ||
| 87 per 1000 | 22 per 1000 | |||||
| Moderate | ||||||
| 173 per 1000 | 43 per 1000 | |||||
| Proximal DVT | Study population | RR 0.12 | 2746 | ⊕⊕⊕⊝ | ||
| 60 per 1000 | 7 per 1000 | |||||
| Moderate | ||||||
| 54 per 1000 | 6 per 1000 | |||||
| Total PE | Study population | RR 0.16 | 6412 | ⊕⊕⊕⊕ | ||
| 5 per 1000 | 1 per 1000 | |||||
| Moderate | ||||||
| 1 per 1000 | 0 per 1000 | |||||
| Major bleeding | Study population | RR 2.56 | 6659 | ⊕⊕⊕⊝ | ||
| 5 per 1000 | 12 per 1000 | |||||
| Moderate | ||||||
| 3 per 1000 | 8 per 1000 | |||||
| All causes of death | Study population | RR 0.76 | 6674 | ⊕⊕⊕⊝ | ||
| 12 per 1000 | 9 per 1000 | |||||
| Moderate | ||||||
| 0 per 1000 | 0 per 1000 | |||||
| *The basis for the assumed risk (e.g. median control group risk across studies) is provided in footnotes. The corresponding risk (and its 95% confidence interval) is based on the assumed risk in the comparison group and the relative effect of the intervention (and its 95% CI). | ||||||
| GRADE Working Group grades of evidence | ||||||
| 1 Data were pooled with a random‐effects model owing to heterogeneity ‐ downgraded by one level. | ||||||
| Fondaparinux versus LMWH for the prevention of venous thromboembolism | ||||||
| Patient or population: people requiring prevention of venous thromboembolism | ||||||
| Outcomes | Illustrative comparative risks* (95% CI) | Relative effect | Number of participants | Quality of the evidence | Comments | |
| Assumed risk | Corresponding risk | |||||
| LMWH | Fondaparinux | |||||
| Total VTE | Study population | RR 0.55 | 9339 | ⊕⊕⊕⊝ | ||
| 108 per 1000 | 60 per 1000 | |||||
| Moderate | ||||||
| 83 per 1000 | 46 per 1000 | |||||
| Symptomatic VTE | Study population | RR 1.03 | 12240 | ⊕⊕⊕⊝ | ||
| 6 per 1000 | 6 per 1000 | |||||
| Moderate | ||||||
| 3 per 1000 | 3 per 1000 | |||||
| Total DVT | Study population | RR 0.54 | 9356 | ⊕⊕⊕⊝ | ||
| 106 per 1000 | 57 per 1000 | |||||
| Moderate | ||||||
| 86 per 1000 | 46 per 1000 | |||||
| Proximal DVT | Study population | RR 0.58 | 8361 | ⊕⊕⊝⊝ | ||
| 23 per 1000 | 13 per 1000 | |||||
| Moderate | ||||||
| 25 per 1000 | 14 per 1000 | |||||
| Total PE | Study population | RR 1.24 | 12350 | ⊕⊕⊕⊝ | ||
| 3 per 1000 | 3 per 1000 | |||||
| Moderate | ||||||
| 1 per 1000 | 1 per 1000 | |||||
| Major bleeding | Study population | RR 1.38 | 12501 | ⊕⊕⊕⊕ | ||
| 18 per 1000 | 25 per 1000 | |||||
| Moderate | ||||||
| 23 per 1000 | 32 per 1000 | |||||
| All causes of death | Study population | RR 0.88 | 12400 | ⊕⊕⊕⊝ | ||
| 12 per 1000 | 10 per 1000 | |||||
| Moderate | ||||||
| 3 per 1000 | 3 per 1000 | |||||
| *The basis for the assumed risk (e.g. median control group risk across studies) is provided in footnotes. The corresponding risk (and its 95% confidence interval) is based on the assumed risk in the comparison group and the relative effect of the intervention (and its 95% CI). | ||||||
| GRADE Working Group grades of evidence | ||||||
| 1 Data were pooled with the random‐effects model because of heterogeneity ‐ downgraded by one level. | ||||||
| Fondaparinux versus variable dose warfarin for the prevention of venous thromboembolism | ||||||
| Patient or population: patients requiring prevention of venous thromboembolism | ||||||
| Outcomes | Illustrative comparative risks* (95% CI) | Relative effect | Number of participants | Quality of the evidence | Comments | |
| Assumed risk | Corresponding risk | |||||
| Variable dose warfarin | Fondaparinux | |||||
| Total VTE | See comment | See comment | Not estimable | 236 | ⊕⊝⊝⊝ | No VTE events recorded |
| Symptomatic VTE | See comment | See comment | Not estimable | 236 | ⊕⊝⊝⊝ | No VTE events recorded |
| Total DVT | See comment | See comment | Not estimable | 236 | ⊕⊝⊝⊝ | No DVT events recorded |
| Proximal DVT | See comment | See comment | Not estimable | 236 | ⊕⊝⊝⊝ | No proximal DVT events recorded |
| Total PE | See comment | See comment | Not estimable | 236 | ⊕⊝⊝⊝ | No PE events recorded |
| Major bleeding | Study population | RR 7 | 236 | ⊕⊝⊝⊝ | ||
| No cases of bleeding (0/118) were reported in the variable warfarin group. Three cases (3/118) of bleeding were reported in the fondaparinux group. | ||||||
| All causes of death | See comment | See comment | Not estimable | 236 | ⊕⊝⊝⊝ | No deaths recorded |
| *The basis for the assumed risk (e.g. median control group risk across studies) is provided in footnotes. The corresponding risk (and its 95% confidence interval) is based on the assumed risk in the comparison group and the relative effect of the intervention (and its 95% CI). | ||||||
| GRADE Working Group grades of evidence | ||||||
| 1 One study was included in this comparison; the study sample was small, and the events were rare ‐ downgraded by three levels. | ||||||
| Fondaparinux versus 1 mg warfarin for the prevention of venous thromboembolism | ||||||
| Patient or population: people requiring prevention of venous thromboembolism | ||||||
| Outcomes | Illustrative comparative risks* (95% CI) | Relative effect | Number of participants | Quality of the evidence | Comments | |
| Assumed risk | Corresponding risk | |||||
| 1 mg warfarin | Fondaparinux | |||||
| Total VTE | Study population | RR 0.2 | 236 | ⊕⊝⊝⊝ | ||
| 17 per 1000 | 3 per 1000 | |||||
| Moderate | ||||||
| 17 per 1000 | 3 per 1000 | |||||
| Symptomatic VTE | See comment | See comment | Not estimable | 236 | ⊕⊝⊝⊝ | No systematic VTE events recorded |
| Total DVT | Study population | RR 0.2 | 236 | ⊕⊝⊝⊝ | ||
| 17 per 1000 | 3 per 1000 | |||||
| Moderate | ||||||
| 17 per 1000 | 3 per 1000 | |||||
| Proximal DVT | See comment | See comment | Not estimable | 236 | ⊕⊝⊝⊝ | No proximal DVT events recorded |
| Total PE | See comment | See comment | Not estimable | 236 | ⊕⊝⊝⊝ | No PE events recorded |
| Major bleeding | Study population | RR 3 | 236 | ⊕⊝⊝⊝ | ||
| 8 per 1000 | 25 per 1000 | |||||
| Moderate | ||||||
| 9 per 1000 | 27 per 1000 | |||||
| All causes of death | See comment | See comment | Not estimable | 236 | ⊕⊝⊝⊝ | No deaths recorded |
| *The basis for the assumed risk (e.g. median control group risk across studies) is provided in footnotes. The corresponding risk (and its 95% confidence interval) is based on the assumed risk in the comparison group and the relative effect of the intervention (and its 95% CI). | ||||||
| GRADE Working Group grades of evidence | ||||||
| 1 One study was included in this comparison; the study sample was small, and the events were rare ‐ downgraded by three levels. | ||||||
| Fondaparinux versus edoxaban for the prevention of venous thromboembolism | ||||||
| Patient or population: people requiring prevention of venous thromboembolism | ||||||
| Outcomes | Illustrative comparative risks* (95% CI) | Relative effect | Number of participants | Quality of the evidence | Comments | |
| Assumed risk | Corresponding risk | |||||
| Edoxaban | Fondaparinux | |||||
| Total VTE | See comment | See comment | Not estimable | 38 | ⊕⊝⊝⊝ | No VTE events recorded |
| Symptomatic VTE | See comment | See comment | Not estimable | 38 | ⊕⊝⊝⊝ | No VTE events recorded |
| Total DVT | See comment | See comment | Not estimable | 38 | ⊕⊝⊝⊝ | No DVT events recorded |
| Proximal DVT | See comment | See comment | 38 | Proximal DVT not an outcome of this study | ||
| Total PE | See comment | See comment | Not estimable | 38 | ⊕⊝⊝⊝ | No PE events recorded |
| Major bleeding | See comment | See comment | Not estimable | 38 | ⊕⊝⊝⊝ | No major bleeding events recorded |
| All causes of death | See comment | See comment | Not estimable | 38 | ⊕⊝⊝⊝ | No deaths recorded |
| *The basis for the assumed risk (e.g. median control group risk across studies) is provided in footnotes. The corresponding risk (and its 95% confidence interval) is based on the assumed risk in the comparison group and the relative effect of the intervention (and its 95% CI). | ||||||
| GRADE Working Group grades of evidence | ||||||
| 1 One study was included in this comparison; the study sample was small, and no events were recorded ‐ downgraded by three levels. | ||||||
| Fondaparinux versus mechanical thromboprophylaxis for the prevention of venous thromboembolism | ||||||
| Patient or population: people requiring prevention of venous thromboembolism | ||||||
| Outcomes | Illustrative comparative risks* (95% CI) | Relative effect | Number of participants | Quality of the evidence | Comments | |
| Assumed risk | Corresponding risk | |||||
| Mechanical thromboprophylaxis | Fondaparinux | |||||
| Total VTE | Study population | RR 0.61 | 99 | ⊕⊕⊝⊝ | ||
| 176 per 1000 | 108 per 1000 | |||||
| Moderate | ||||||
| 177 per 1000 | 108 per 1000 | |||||
| Symptomatic VTE | See comment | See comment | Not estimable | 120 | ⊕⊕⊝⊝ | No cases of symptomatic VTE recorded |
| Total DVT | Study population | RR 0.63 | 100 | ⊕⊕⊝⊝ | ||
| 171 per 1000 | 108 per 1000 | |||||
| Moderate | ||||||
| 171 per 1000 | 108 per 1000 | |||||
| Proximal DVT | See comment | See comment | Not estimable | 105 | ⊕⊕⊝⊝ | No cases of proximal DVT recorded |
| Total PE | See comment | See comment | Not estimable | 120 | ⊕⊕⊝⊝ | No cases of PE recorded |
| Major bleeding | See comment | See comment | Not estimable | 120 | ⊕⊕⊝⊝ | No cases of major bleeding recorded |
| All causes of death | See comment | See comment | Not estimable | 120 | ⊕⊕⊝⊝ | No deaths recorded |
| *The basis for the assumed risk (e.g. median control group risk across studies) is provided in footnotes. The corresponding risk (and its 95% confidence interval) is based on the assumed risk in the comparison group and the relative effect of the intervention (and its 95% CI). | ||||||
| GRADE Working Group grades of evidence | ||||||
| 1 One study included in this comparison, small study sample, funded by pharmaceutical company, very short follow‐up ‐ downgraded by two levels. | ||||||
Background
Description of the condition
Venous thromboembolism (VTE), including deep venous thrombosis (DVT) and pulmonary embolism (PE), is a prevalent disease with potentially serious consequences. A major life‐threatening complication for patients with VTE is that parts of the thrombus, called emboli, can break off and travel to the lungs, eventually leading to sudden collapse and death. Even in patients without such an acute condition, emboli can cause pulmonary hypertension and post‐thrombotic syndrome over the longer term, leading to chronic swelling and ulceration of the skin. Venous thromboembolism has become the third most frequent cause of death and the most common preventable cause of death in hospital (Agnelli 2000; Geerts 2008). The incidence of VTE is about seven per 10,000 person‐years among community residents (Heit 2001). The incidence of DVT is five per 10‐000 person‐years and rises exponentially with increasing age (Fowkes 2003). The relapse rate of DVT is variable and depends mainly on the risk factor profile of patients. For patients with symptomatic and proximal DVT, the recurrence rate is over 20% after five years of initial treatment (Hansson 2000; Pinede 2001). Among hospitalised patients, the incidence of VTE is more than 100 times greater than among community residents (Heit 2001), and the prevalence of fatal PE is approximately 1% (Geerts 2004). Venous thromboembolism has become the third most frequent cause of death among patients in hospital in the United States (Heit 2005). Therefore, prevention of VTE among those at risk is important for reducing morbidity and mortality (Geerts 2001).
Until relatively recently, the main pharmacological options for treatment and prevention of thromboembolic disorders were warfarin and heparin (unfractionated heparin or low molecular weight heparin). However, the principal disadvantage of using unfractionated heparin involves its unpredictable pharmacological effect, which requires close monitoring. Disadvantages of warfarin and other vitamin K antagonists include a narrow therapeutic window, numerous drug interactions and the need for close monitoring. Although low molecular weight heparins (LMWHs) could be superior to unfractionated heparins because monitoring of coagulation is not needed and LMWHs have a better safety record (Erkens 2010), problems associated with their use include bleeding, hypersensitivity and heparin‐induced thrombocytopenia (HIT). New oral anticoagulants ‐ direct factor X inhibitors and direct thrombin inhibitors ‐ may be as effective as traditional anticoagulants without the need for monitoring but may cause more bleeding (Southworth 2013) and are associated with other adverse effects (Uchino 2012); data are still insufficient to fully understand their effects (Metzger 2015; Salazar 2010). In addition, DVT may occur despite prophylaxis with LMWH or other agents (Geerts 2001). Other non‐pharmacological methods, including thromboembolic deterrent (TED) stockings and pneumatic calf compression devices, are safe but are not effective enough to be used alone (Geerts 2001). These unresolved issues have led to continued research into potentially effective and safe anticoagulants ‐ pentasaccharides (Koopman 2003; Turpie 2003).
Description of the intervention
Pentasaccharide are a new class of agents with a specific effect on the blood coagulation cascade; they may be more effective and may cause fewer side effects than LMWH (Bauer 2003; Koopman 2003). The structure of the pentasaccharide is modelled on the pentasaccharide sequence in heparin, which binds to antithrombin‐III, but it is modified to have higher affinity (Bauer 2003). Once bound, antithrombin‐III undergoes a conformational change and binds to factor Xa. This inhibits the coagulation cascade because factor Xa is positioned at the start of the common pathway of the intrinsic and extrinsic systems and results in effective inhibition of thrombin generation (Bauer 2003). As no direct interference with components of the coagulation cascade occurs, these agents have been proposed to be less likely to cause haemorrhagic complications whilst possessing equivalent or superior efficacy when compared with LMWH (Koopman 2003; Shoda 2015).
Currently, three types of pentasaccharides are used for VTE prophylaxis. One type is fondaparinux, which has a half‐life time of approximately 15 hours and can be administered subcutaneously once daily. A systematic review on fondaparinux for acute coronary syndrome showed a better anticoagulative effect, less major bleeding and reduced total mortality when compared with LMWH (Brito 2011). The second type is the long‐acting pentasaccharide idraparinux, which has a half‐life time of approximately 120 hours when administered for the first time, which increases to 60 days when metabolism has been in steady state (Veyrat‐Follet 2009). With its long half‐life time, idraparinux can be administered subcutaneously once weekly and can greatly improve patients' tolerance and quality of life. On the other hand, the anticoagulative effect may accumulate and bleeding risk may increase after long‐term administration. If acute major bleeding takes place during idraparinux injection, it will be difficult to reverse its anticoagulative effect because no specific rescuer is available. For this reason, a new medicine called idrabiotaparinux was developed by the pharmaceutical company Sanofi‐Aventis. It is a compound of idraparinux and biotin that can be neutralised immediately by the external agent avidin. When avidin is administered, it binds rapidly to idrabiotaparinux, and the avidin–idrabiotaparinux complex is rapidly cleared from plasma to tissues in which avidin normally resides, resulting in a rapid decrease in circulating anti‐factor Xa activity (Paty 2007; Savi 2008). No relevant toxicity or adverse effects of avidin have been reported in safety pharmacology and toxicology studies (Stoldt 1997). Paty and colleagues reported that avidin is effective in reversing the anticoagulative effect of idrabiotaparinux (Paty 2010).
Why it is important to do this review
Pentasaccharides have longer half‐life times with no need for monitoring coagulation time, and they cause little HIT so are more tolerable than the traditional unfractionated heparin, LMWH or warfarin. However, in terms of beneficial effects and adverse effects in VTE prevention, although many clinical trials have compared them with other anticoagulative methods (medical, mechanical or combined), no consensus has been reached on whether they are superior or inferior to other anticoagulative methods (Bauersachs 2005; Bergqvist 2006; Falck‐Ytter 2012; Prandoni 2008; Turpie 2003a). Therefore, we conducted this systematic review to assess beneficial and adverse effects of pentasaccharides for VTE prevention.
Objectives
To assess effects of pentasaccharides versus other methods of thromboembolic prevention (thromboprophylaxis) in people who require anticoagulant treatment to prevent venous thromboembolism.
Methods
Criteria for considering studies for this review
Types of studies
Randomised controlled trials (RCTs) comparing pentasaccharides with other methods of thromboprophylaxis. We included only trials involving adults (18 years of age and older) and excluded trials in which participants were randomised by a quasi‐random method of allocation (such as alternation, date of birth or case record number).
Types of participants
We included participants over 18 years of age who required anticoagulant treatment to prevent VTE and excluded people who had contraindications to anticoagulant therapy, or who were pregnant. For participants with a serum creatinine concentration above 180 µmol/L or a glomerular filtration rate less than 30 mL/min who were well hydrated, anticoagulant doses should have been adjusted according to renal function. We excluded participants undergoing haemodialysis and those who received any type of anticoagulant, fibrinolytic therapy or dextran within two days of planned administration of the first study drug.
Types of interventions
All participants had received pentasaccharide or another method of thromboprophylaxis (pharmacological or mechanical) for prevention of VTE. We included adjunctive measures such as compression hosiery, as long as they were used equally between groups and their use was not affected by randomisation.
Types of outcome measures
Primary outcomes
The primary efficacy and safety outcome measures were overall rate of VTE and rate of major bleeding.
Secondary outcomes
-
Symptomatic VTE
-
Total DVT
-
Proximal DVT
-
Total PE
-
Fatal PE
-
Non‐fatal PE
-
Symptomatic PE
-
Fatal bleeding
-
Myocardial infarction (MI) (non‐fatal and fatal)
-
All causes of death
-
Any other serious adverse effects
Participants should have been assessed postoperatively for the presence of DVT by ascending venography, 125‐I‐labelled fibrinogen uptake or Doppler ultrasonography. We did not accept clinical scoring or D‐dimer assay or both as a suitable confirmatory test of DVT in this context.
Pulmonary embolism should have been confirmed by pulmonary angiography, high‐probability ventilation/perfusion (V/Q) scan or computerised tomography (CT), or should have been evaluated post mortem.
We defined major bleeding as bleeding that was fatal, retroperitoneal, intracranial or intraspinal, or that involved any other critical organ; or bleeding that led to reoperation or intervention, declined haemoglobin levels by greater than 2 grams per decilitre, transfusion of 2 or more units of packed red blood cells and a bleeding index ≥ 2.0. We derived the bleeding index by adding the number of transfused units of packed red blood cells or whole blood to the difference in haemoglobin level measured in grams per decilitre before and after a bleeding event, as mentioned above.
Search methods for identification of studies
Electronic searches
The Cochrane Vascular Information Specialist (CIS) searched the following databases for relevant trials.
-
Cochrane Vascular Specialised Register (March 2016).
-
Cochrane Central Register of Controlled Trials (CENTRAL; 2016, Issue 2) via the Cochrane Register of Studies Online.
See Appendix 1 for details of the strategy used to search CENTRAL.
The Cochrane Vascular Specialised Register is maintained by the CIS and is constructed from weekly electronic searches of MEDLINE Ovid, Embase Ovid, CINAHL, AMED, and through handsearching relevant journals. The full list of the databases, journals and conference proceedings which have been searched, as well as the search strategies used are described in the Specialised Register section of the Cochrane Vascular module in the Cochrane Library (www.cochranelibrary.com).
In addition, the review authors searched Latin American and Caribbean Health Sciences (LILACS) (August 2016) using the search strategy provided in Appendix 2.
The CIS searched (7 March 2016) the following trial registries for details of ongoing and unpublished studies.
-
ClinicalTrials.gov (www.clinicaltrials.gov).
-
World Health Organization International Clinical Trials Registry Platform (www.who.int/trialsearch).
-
International Standard Randomised Controlled Trial Number (ISRCTN) Register (www.isrctn.com/).
Searching other resources
We checked the reference lists of relevant studies and reviews identified by the electronic searches.
Data collection and analysis
Selection of studies
Two review authors (YS, XL or KD) independently selected and assessed trials before they were included in the review. For trials without sufficient information, we contacted study authors and researchers to request needed details. We resolved differences between the two review authors about grading or inclusion of some studies by discussion. If agreement could not be reached, we asked JD to arbitrate.
Data extraction and management
Two review authors (YS, XL or KD) independently performed data extraction using a standard form and resolved inconsistencies and disagreements by discussion or with involvement of a third review author (JD).
We extracted the following data.
-
Number of participants allocated to each group to allow an intention‐to‐treat analysis.
-
Method used to assess outcome endpoints.
-
Number of participants excluded or lost to follow‐up.
-
Details of therapy employed such as dosage and timing.
-
Use of adjunctive prophylaxis methods such as mechanical methods, and whether they were applied equally between groups.
-
Details of outcome measures as stated above.
Assessment of risk of bias in included studies
Two review authors (YS and XL or KD) independently assessed the methodological quality of included trials and resolved discrepancies by discussion. If agreement could not be reached, JD arbitrated. We used the Cochrane recommended tool for assessing risk of bias (Higgins 2011). This tool comprises seven specific domains (namely, sequence generation, allocation concealment, blinding of participants and personnel, blinding of outcome assessment, incomplete outcome data, selective outcome reporting and 'other bias'). Each domain in the tool included one or more specific entries in a 'Risk of bias' table. Within each entry, the first part of the tool described what was reported to have happened in the study and whether sufficient detail was provided to support a judgement about risk of bias. The second part of the tool assigned a judgement related to risk of bias for that entry by assigning a judgement of 'low risk' of bias, 'high risk' of bias or 'unclear risk' of bias (Higgins 2011). We stratified studies into two groups ‐ a 'low risk' of bias group and a 'high risk' of bias group. We stratified in the 'low risk' of bias group studies that showed 'low risk' of bias in all of the sequence generation, allocation concealment and blinding of outcome assessment domains; if any of the three domains could not be achieved, we classified the study into the 'high risk' of bias group. We considered other domains as well. If other risks of bias would obviously affect the calculated intervention effect substantially, we classified the outcome into the 'high risk' of bias group. For outcomes with information insufficient for classification into the 'low risk' of bias or 'high risk' of bias group, we tried to contact study authors to obtain the original data, attempted to find additional information in other published articles of the same study or used other methods that would be helpful in obtaining sufficient data to clarify the bias. If information was still insufficient, we decided to classify studies into the 'low risk' of bias or 'high risk' of bias group through discussion. We pooled only data from 'low risk' of bias groups in the meta‐analyses.
Measures of treatment effect
We used risk ratio (RR) with a 95% confidence interval (CI) as the measure of treatment effect for dichotomous outcomes. YS, KD and XL carried out the analysis.
Dealing with missing data
For studies with incomplete data, we attempted to contact study authors to obtain the missing information needed.
Assessment of heterogeneity
We assessed heterogeneity using the Chi‐squared test and the I2 statistic. If we found evidence of heterogeneity, we explored the cause by subgroup analyses.
Assessment of reporting biases
We used a funnel plot to detect reporting bias for analyses that involved more than 10 studies and performed sensitivity analyses when necessary.
Data synthesis
We used the fixed‐effect model to combine studies with no significant heterogeneity (confirmed by P value of the Chi‐squared test > 0.10 and I2< 25%). With P value of the Chi‐squared test > 0.10 and 25% ≤ I2< 50%, we decided on heterogeneity through discussion. When the P value of the Chi‐squared test was ≤ 0.10 or I2 was ≥ 50%, we investigated for clinical heterogeneity. If we found clinical heterogeneity, we analysed the data using subgroups, then combined the included studies using the Mantel‐Haenszel random‐effects model analysis. However, because we included data from various clinical conditions with risk of clinical heterogeneity, we performed subgroup analyses on different clinical conditions for all outcomes to detect whether inter‐subgroup heterogeneity was present.
Subgroup analysis and investigation of heterogeneity
In our protocol, we had planned to analyse the short‐term acting pentasaccharides and the long‐term acting pentasaccharides as subgroups. However, our searches identified that short‐term acting pentasaccharides were used only for primary VTE prevention and were administered once daily for a period of approximately one month, but long‐term acting pentasaccharides were used only for VTE treatment and were administered once weekly for several months. Participants and treatment duration were different for the two kinds of pentasaccharide studies. We therefore analysed studies on short‐term acting pentasaccharides for VTE prevention and excluded studies on long‐term acting pentasaccharides from the meta‐analyses without performing tests for heterogeneity. We also performed subgroup analyses on different surgical clinical conditions.
Sensitivity analysis
We performed sensitivity analyses to confirm the effects of data from the 'unclear risk' of bias group on the intervention effect. We have presented the sensitivity analyses separately.
Summary of findings
We present the main findings of the review concerning quality of evidence, magnitude of effect of the interventions examined and the sum of available data on main outcomes (total VTE, symptomatic VTE, total DVT, proximal DVT, total PE, major bleeding, all causes of death) in a 'Summary of findings' table, according to the GRADE principles described by Atkins 2004 and Higgins 2011a. We assessed different intervention comparisons (e.g. fondaparinux compared with placebo, LMWH and mechanical thromboprophylaxis), so we developed a 'Summary of findings' table for each comparison included in the Effects of interventions section. We used GRADE software (GradePro) to assist in preparation of the 'Summary of findings' table.
Results
Description of studies
See Characteristics of included studies, Characteristics of excluded studies and Characteristics of ongoing studies.
Results of the search
See Figure 1.

Study flow diagram.
Included studies
See Characteristics of included studies.
All 25 included studies (ACT2545; APOLLO; AR3106116; ARTEMIS; Bern 2015; CALISTO; Cho 2013; DRI4090; DRI4757; EFFORT; EPHESUS; FONDACAST; Kolluri 2016; L‐8541; L‐8635; Li 2015; PEGASUS; PENTAMAKS; PENTATHLON; PENTATHLON 2000; PENTHIFRA; PENTHIFRA PLUS; Shen 2014; Yokote 2011; Fuji 2015) investigated fondaparinux for short‐term VTE prevention. No studies examined idraparinux or idrabiotaparinux for VTE prevention. Seventeen studies (ACT2545; APOLLO; AR3106116; ARTEMIS; CALISTO; DRI4090; DRI4757; EPHESUS; FONDACAST; L‐8541; L‐8635; PEGASUS; PENTAMAKS; PENTATHLON; PENTATHLON 2000; PENTHIFRA; PENTHIFRA PLUS) were run by a pharmaceutical company, two (EFFORT; Fuji 2015) received support from a pharmaceutical company and six (Bern 2015; Cho 2013; Kolluri 2016; Li 2015; Shen 2014; Yokote 2011) were not supported by a pharmaceutical company.
Fifteen studies (ACT2545; Bern 2015; Cho 2013; DRI4090; DRI4757;EPHESUS;Fuji 2015;L‐8541;L‐8635; PENTAMAKS; PENTATHLON; PENTATHLON 2000; PENTHIFRA; PENTHIFRA PLUS; Yokote 2011) included participants undergoing orthopaedic procedures, three (APOLLO; AR3106116; PEGASUS) included participants undergoing abdominal surgery, one (Shen 2014) included participants following surgical resection of oesophageal cancer, one (ARTEMIS) acutely ill hospitalised medical patients, one (FONDACAST) participants requiring rigid or semirigid immobilisation (e.g. with a plaster cast or brace), one (Li 2015) intensive care unit (ICU) patients with hypercoagulability secondary to traumatic infection, one (EFFORT) people undergoing bariatric surgery, one (Kolluri 2016) patients undergoing coronary artery bypass graft surgery and one (CALISTO) participants with superficial venous thrombosis. Fuji 2015 involved participants with renal impairment with creatinine clearance ≥ 20 to < 30 mL/min undergoing orthopaedic procedures in the fondaparinux group and its comparator edoxaban. The other studies did not involve participants with renal impairment.
In most studies, the follow‐up period was less than 30 days, except for CALISTO and FONDACAST, both of which had a follow‐up period up to 45 days. All included studies were RCTs with comparable baseline demographic characteristics of participants in different treatment groups and low withdrawal rates (< 15%, with most studies showing a withdrawal rate < 10%). Most studies were carried out in Western countries, except for Cho 2013, DRI4090, DRI4757, Fuji 2015, Yokote 2011, Li 2015, L‐8541, L‐8635 and Shen 2014. The first five studies were carried out in Japan, and the last four in China.
Shen 2014 used effective methods to warrant the randomisation sequence, effective allocation concealment and blinding of the outcome assessor but reported VTE rates for fondaparinux and LMWH groups instead of numbers of VTE events. We were unable to obtain these details when we contacted the study authors. Therefore, we did not include this study in the meta‐analyses.
Reports of L‐8541 and Yokote 2011 did not contain sufficient information to clearly stratify them into low risk or high risk of bias groups, as discussed above. The L‐8541 report did not mention whether personnel who evaluated outcomes were independent or were blind to group treatment details. Yokote 2011 was a single‐centre study that reported no reliable randomisation method. Therefore, we included L‐8541 and Yokote 2011 in the sensitivity analyses only. Investigators in the EFFORT study administered 5 mg/d fondaparinux in the study arm and 40 mg enoxaparin twice daily in the control arm after participants had undergone bariatric surgery. Doses of fondaparinux and enoxaparin used by EFFORT were double those used for prevention of VTE in other included studies for other types of patients. Therfore, we performed sensitivity analyses excluding this study to demonstrate whether this factor would affect the results.
APOLLO, ARTEMIS, Bern 2015, CALISTO, Cho 2013, EFFORT, EPHESUS, Fuji 2015, Kolluri 2016, PENTAMAKS, PENTATHLON 2000, PENTHIFRA and PENTHIFRA PLUS reported using adjunctive anticoagulation methods. APOLLO used an intermittent pneumatic compression device (IPC) equally in different treatment groups. CALISTO, Cho 2013, EPHESUS and PENTAMAKS mentioned that they used compression stockings equally in different treatment groups as the adjunctive anticoagulation method. CALISTO also used a low dose of oral aspirin (≤ 325 mg per day) or other antiplatelet agents as an adjunctive anticoagulation method, and again this was done equally between treatment groups. ARTEMIS, Bern 2015, EFFORT, Kolluri 2016, PEGASUS, PENTATHLON 2000, PENTHIFRA, PENTHIFRA PLUS and Yokote 2011 mentioned that researchers used adjunctive anticoagulation methods (aspirin, thienopyridines and non‐steroidal anti‐inflammatory drugs were discouraged during the study; other antiplatelet agents, intermittent pneumatic leg compression, dextran and anticoagulant or thrombolytic agents were prohibited; graded‐pressure elastic stockings were permitted; and early mobilisation was strongly recommended) but did not report whether they were used equally in the different treatment groups. Because the adjunctive methods used by most participants in seven studies (ARTEMIS; EFFORT; Kolluri 2016; PEGASUS; PENTATHLON; PENTHIFRA; PENTHIFRA PLUS) were graduated compression stockings (GCS) and IPC, and no evidence suggests that these mechanical methods would substantially affect the symptomatic VTE rate, we decided to include these in the meta‐analysis. We used Yokote 2011 only for the sensitivity analysis, as described above. Another reason for including these studies was that they included large samples. If we excluded these from the meta‐analysis, the result would be biased. In Bern 2015, participants had early postoperative ambulation. All participants wore pneumatic compression stockings while in‐patients. Elastic compression stockings were prescribed to be used after discharge until follow‐up ultrasonography. Hydroxyethyl starch (HES) 6% was allowed intraoperatively for case‐specific reasons. Use of platelet function suppressive drugs, such as non‐steroidal anti‐inflammatory drugs (NSAIDs), was discouraged but not prohibited by the protocol. As Bern 2015 was the single study comparing fondaparinux and warfarin for VTE prevention, we included this study to present its results. Fuji 2015 allowed concomitant physiotherapy (intermittent pneumatic compression devices or elastic stockings) throughout the treatment period. AR3106116 compared the efficacy of fondaparinux versus IPC for VTE prevention in patients undergoing abdominal surgery who were at high risk of VTE, so the two groups in this study received fondaparinux injection and IPC treatment separately.
ACT2545, EFFORT, EPHESUS, FONDACAST, L‐8635, Li 2015, PEGASUS, PENTAMAKS, PENTATHLON, PENTATHLON 2000, PENTHIFRA and Shen 2014 compared the efficacy and safety of fondaparinux versus LMWH (approximately 100 anti‐factor Xa units per kilogram per day). ACT2545, EPHESUS and PENTATHLON 2000 compared the efficacy and safety of fondaparinux (2.5 mg subcutaneous (sc) once daily) versus LMWH after total hip replacement and hip fracture surgery. PENTATHLON was a dose‐ranging study involving five fondaparinux dose groups (0.75 mg, 1.5 mg, 3.0 mg, 6.0 mg, 8.0 mg) and a 60 mg enoxaparin control group of people undergoing elective primary hip replacement or revision of a primary procedure. We chose the 1.5 mg and 3.0 mg groups and combined their data for inclusion; we included the enoxaparin group as a comparator. FONDACAST compared the efficacy and safety of fondaparinux 2.5 mg sc once daily versus LMWH in participants requiring rigid or semirigid immobilisation for at least 21 days and up to 45 days because of isolated non‐surgical below‐knee injuries that were treated with a plaster cast. L‐8635 and PENTAMAKS compared the efficacy and safety of fondaparinux 2.5 mg sc once daily versus LMWH after major knee surgery, L‐8635 after elective knee replacement and PENTAMAKS for major knee surgery. PEGASUS compared the efficacy and safety of fondaparinux 2.5 mg sc once daily versus LMWH in participants after major abdominal surgery who were at high risk of VTE. PENTHIFRA compared the efficacy and safety of fondaparinux (2.5 mg sc once daily) versus LMWH in participants undergoing standard surgery for fracture of the upper third of the femur, including the femoral head and neck. Li 2015 compared the efficacy and safety of fondaparinux (2.5 mg sc once daily) versus LMWH in ICU patients with hypercoagulability accompanied by traumatic infection. EFFORT compared the efficacy and safety of fondaparinux (5 mg sc once daily) versus LMWH (40 mg twice daily) in bariatric surgical patients. Shen 2014 compared the efficacy and safety of fondaparinux (2.5 mg sc once daily) versus LMWH in participants undergoing surgical resection for oesophageal cancer.
APOLLO, AR3106116, ARTEMIS, Bern 2015, CALISTO, Cho 2013, DRI4090, DRI4757, Kolluri 2016 and PENTHIFRA PLUS compared the efficacy and safety of fondaparinux versus placebo or the mechanical method IPC for VTE prevention. CALISTO investigated the efficacy and safety of fondaparinux 2.5 mg sc once daily for prevention of venous thromboembolic complications for acute symptomatic isolated superficial thrombophlebitis of the lower limbs. DRI4090 and DRI4757 were dose‐ranging studies conducted to determine the dose‐response effect of fondaparinux on the prophylaxis of VTE after total hip replacement (THR) and total knee replacement (TKR), respectively. These studies included four fondaparinux dose groups (0.75 mg, 1.5 mg, 2.5 mg, 3.0 mg) and a placebo control group. We combined the 1.5 mg, 2.5 mg and 3.0 mg groups into a single group and dropped the data for the 0.75 mg group because the 0.75 mg dose of fondaparinux was too small and was not effective for routine VTE prevention and treatment (PENTATHLON). In PENTHIFRA PLUS, participants received open‐label fondaparinux 2.5 mg sc once daily postoperatively for 7 ± 1 days (day 1 = day of surgery) after hip fracture surgery. They were then randomised to receive double‐blind fondaparinux 2.5 mg sc once daily for 21 ± 2 days or placebo for three weeks. AR3106116 compared fondaparinux (2.5 mg sc once daily) with IPC for VTE prevention. Cho 2013 investigated fondaparinux (2.5 mg sc once daily) in participants after unilateral total knee arthroplasty (TKA), and ARTEMIS focused on the efficacy and safety of the anticoagulant fondaparinux (2.5 mg sc once daily) in older acutely ill medical in‐patients at moderate to high risk of VTE. Kolluri 2016 compared fondaparinux 2.5 mg sc once daily versus placebo for prevention of VTE after coronary artery bypass graft surgery. APOLLO compared fondaparinux 2.5 mg sc once daily combined with IPC versus IPC alone in participants at high risk of VTE after major abdominal surgery.
Bern 2015 compared fondaparinux 2.5 mg sc once daily versus variable (target international normalised ratio (INR) 2.0 to 2.5) and fixed (1 mg) doses of warfarin after elective hip or knee replacement surgery.
Fuji 2015 compared fondaparinux (1.5 mg sc once daily) versus edoxaban (15 mg oral once daily) in participants with serious renal impairment undergoing orthopaedic procedures.
We also identified six ongoing studies (EUCTR2007‐003746‐15‐DE; EUCTR2008‐001779‐31‐IT; JPRN‐UMIN000002444; JPRN‐UMIN000007005;JPRN‐UMIN000008435;PROTECT), which were recruiting participants and had reported no results at the time of the search for this review.
Excluded studies
See Characteristics of excluded studies.
In total, we excluded 33 studies (ACT1840; Amadeus 2008; AR3106206; AR3106333; AR3106335; Argun 2013; Bonneux 2006; Buller 2014; Cassiopea; Cohen 2007; EQUINOX; extended van Gogh; FLEXTRA; Kawaji 2012; Li 2013; MATISSE‐DVT; MATISSE‐PE; NCT00521885; NCT00539942; PENTATAK; PERSIST; Rembrandt; SAFE‐AF; Sasaki 2009; Sasaki 2011; Savi 2005; Tsutsumi 2012; van Gogh‐DVT; van Gogh‐PE; Xin 2013; Yamaoka 2014; Zhao 2013; Zhao 2015). Cassiopea, extended van Gogh, PERSIST, van Gogh‐DVT and van Gogh‐PE investigated idraparinux or idrabiotaparinux for long‐term VTE treatment, not for primary VTE prevention. Amadeus 2008 focused on idraparinux for prevention of thromboembolism in participants with atrial fibrillation. Because most thrombotic events in this study among participants with atrial fibrillation consisted of arterial embolism (stoke or non‐central nervous system systemic embolism), not venous thrombosis, published results did not distinguish the arterial embolism and venous thrombosis events; therefore, we excluded this study from the review. Buller 2014 focused on idrabiotaparinux for prevention of thromboembolism in participants with atrial fibrillation. Published results did not distinguish systemic embolism from venous thrombosis events; therefore, we excluded this study from the review. We excluded AR3106206, Rembrandt, MATISSE‐DVT and MATISSE‐PE because researchers investigated initial treatment of VTE, but not prophylaxis of VTE. In AR3106333, AR3106335, Cohen 2007, EQUINOX, FLEXTRA and PENTATAK, all study groups received pentasaccharides for VTE prevention, so investigators included no comparator. Kawaji 2012, Tsutsumi 2012 and Yamaoka 2014 were not RCTs, and Sasaki 2009 and Sasaki 2011 were quasi‐RCTs, so we excluded them. In ACT1840, the fondaparinux dose (3 mg sc twice daily) markedly extended the normal VTE prevention dose; therefore we excluded this study (PENTATHLON). NCT00539942 and NCT00521885 were terminated owing to problems with accrual and reported no results. Savi 2005 reported no VTE rate; as this was our primary outcome, we excluded this study. Argun 2013 and Bonneux 2006 reported no reliable primary efficacy and safety results. Li 2013, SAFE‐AF, Xin 2013, Zhao 2013 and Zhao 2015 investigated the efficacy and safety of fondaparinux for treatment of acute coronary syndrome and atrial fibrillation, not for VTE prevention.
Risk of bias in included studies

Risk of bias graph: review authors' judgements about each risk of bias item presented as percentages across all included studies.

Risk of bias summary: review authors' judgements about each risk of bias item for each included study.
Allocation
Seventeen studies (ACT2545;APOLLO; AR3106116; ARTEMIS; CALISTO; DRI4090; DRI4757; EPHESUS; FONDACAST; L‐8541; L‐8635; PEGASUS; PENTAMAKS; PENTATHLON; PENTATHLON 2000; PENTHIFRA; PENTHIFRA PLUS) were multi‐centre RCTs organised by a pharmaceutical company. Five of them (ARTEMIS; CALISTO; PENTAMAKS; PENTATHLON 2000; PENTHIFRA PLUS) clearly described in their published articles the use of computerised or central randomisation at an independent centre and were assessed to be at low risk of selection bias. We assumed that the remaining 12 multi‐centre randomised studies organised by the same company (GlaxoSmithKline) (ACT2545; APOLLO; AR3106116; DRI4090; DRI4757; EPHESUS; FONDACAST; L‐8541; L‐8635; PEGASUS; PENTATHLON; PENTHIFRA) were also randomised centrally by reliable methods. In addition, we believed that the 17 studies had sufficient allocation concealment and assessed them as having low risk of selection bias. Another seven studies also used reliable randomisation methods (Bern 2015; Cho 2013; EFFORT; Fuji 2015; Kolluri 2016; Li 2015; Shen 2014); we therefore assessed them as having low risk of selection bias. Yokote 2011 was a single‐centre study without sufficient information to estimate whether its randomisation was reliable, and we assessed it as having unclear risk of selection bias. We did not include this study in the efficacy analysis but did include it in a sensitivity analysis.
Blinding
ACT2545, AR3106116, FONDACAST, Fuji 2015 and L‐8635 were open‐label studies. ACT2545, FONDACAST and L‐8635 compared fondaparinux versus LMWH. AR3106116 compared fondaparinux versus IPC, and this was impossible to blind to both participants and personnel. Although the five studies were open‐label studies, their outcome evaluators were independent and were blinded to the randomisation. Therefore, we believed that failure to realise blinding to participants and healthcare personnel might not cause serious bias, and we included these trials in the data analyses. We therefore assessed these five studies as having unclear risk of performance bias but low risk of detection bias. Bern 2015, DRI4090, DRI4757, PENTATHLON, Shen 2014 and Yokote 2011 did not clearly describe the method used to ensure blinding of participants and personnel. However, they did describe effective methods that they used to ensure that outcome evaluators were blinded to the randomisation. According to our protocol, we included these studies in the data analyses. We assessed Bern 2015, DRI4090, DRI4757, PENTATHLON, Shen 2014 and Yokote 2011 as having unclear risk of performance bias but low risk of detection bias. Kolluri 2016 did not clearly describe whether outcome assessors were blinded; we therefore judged this study to have unclear risk of detection bias. Li 2015 reported reliable blinding of participants and outcome assessors but not of healthcare personnel; we therefore judged this study to have unclear risk of performance bias but low risk of detection bias. L‐8541, a single‐blind study, did not mention whether investigators used methods to ensure that outcome assessors were blinded to the treatment that participants received. We assessed L‐8541 to have unclear risk of performance and detection bias. We did not include this study in the data analysis but included it in a sensitivity analysis.
The remaining included studies were all triple‐blind and reported use of effective blinding strategies; we judged these studies to have low risk of performance and detection bias.
Incomplete outcome data
More than 90% of participants in every treatment group in all but two studies (PENTATHLON; PENTHIFRA PLUS) completed treatment as planned in the protocol, and we included them in the analyses of study results. In PENTATHLON, 10.4% of participants in the comparator enoxaparin group withdrew from the study, and in PENTHIFRA PLUS, 12.3% and 13.9% of participants from the fondaparinux group and placebo group, respectively, discontinued studies midway. We deemed all studies to have low risk of attrition bias.
Selective reporting
All included studies reported the primary efficacy outcomes listed in the Methods section of this review. However, Shen 2014 reported VTE rates rather than numbers of events, and we could not include this study in the meta‐analysis. All but one study (Shen 2014) reported the primary safety outcome. Shen 2014 reported drainage volume rather than major bleeding; we therefore judged this study to have unclear risk of reporting bias.
We used the funnel plot to detect publication bias.
Other potential sources of bias
All studies except Bern 2015, Cho 2013, Kolluri 2016, Li 2015, Shen 2014 and Yokote 2011 were organised by pharmaceutical companies, and EFFORT was supported by a pharmaceutical company, which provided the study medication. Therefore, we judged all studies except Bern 2015, Cho 2013, EFFORT, Kolluri 2016, Li 2015, Shen 2014 and Yokote 2011 as having unclear risk of other bias.
Effects of interventions
See: Summary of findings for the main comparison Fondaparinux versus placebo for the prevention of venous thromboembolism; Summary of findings 2 Fondaparinux versus LMWH for the prevention of venous thromboembolism; Summary of findings 3 Fondaparinux versus variable dose warfarin for the prevention of venous thromboembolism; Summary of findings 4 Fondaparinux versus 1 mg warfarin for the prevention of venous thromboembolism; Summary of findings 5 Fondaparinux versus edoxaban for the prevention of venous thromboembolism; Summary of findings 6 Fondaparinux versus mechanical thromboprophylaxis for the prevention of venous thromboembolism
Fondaparinux versus placebo
Eight studies (APOLLO; ARTEMIS; CALISTO; Cho 2013; DRI4090; DRI4757; Kolluri 2016; PENTHIFRA PLUS) compared the efficacy and safety of fondaparinux versus placebo for VTE prevention. As the outcomes total VTE, total DVT and proximal DVT showed significant heterogeneity, we analysed the data by using the random‐effects model. Remaining outcomes (symptomatic VTE, total PE, fatal PE, non‐fatal PE, major bleeding, fatal bleeding, MI, all causes of death, other serious adverse effects) showed low heterogeneity and were analysed with the fixed‐effect model. Our results showed less total VTE (RR 0.24, 95% CI 0.15 to 0.38; P < 0.00001; 8 studies; 5717 participants), less symptomatic VTE (RR 0.15, 95% CI 0.06 to 0.36; P < 0.0001; 8 studies; 6503 participants), less total DVT (RR 0.25, 95% CI 0.15 to 0.40; P < 0.00001; 8 studies; 5715 participants), less proximal DVT (RR 0.12, 95% CI 0.04 to 0.39; P = 0.0004; 7 studies; 2746 participants) and less total PE (RR 0.16, 95% CI 0.04 to 0.62; P = 0.008; 8 studies; 6412 participants) for fondaparinux compared with placebo. All PE events were symptomatic. Fondaparinux also showed less fatal PE and non‐fatal PE, but results from eight studies and 6412 participants were not significant compared with placebo (RR 0.14, 95% CI 0.02 to 1.17; P = 0.07; and RR 0.22, 95% CI 0.05 to 1.03; P = 0.05).
On the other hand, results showed that major bleeding was increased in the fondaparinux arm (RR 2.56, 95% CI 1.48 to 4.44; P = 0.0008; 8 studies; 6659 participants) versus the placebo arm. Only two out of six studies reporting on fatal bleeding reported participants suffered from fatal bleeding, and the rate was not different between study arms (RR 4.87, 95% CI 0.58 to 40.84; P = 0.14; 6 studies; 5993 participants).
Four out of eight studies (APOLLO; ARTEMIS; CALISTO; PENTHIFRA PLUS) reporting on all causes of death reported deaths. We combined results and showed that the all causes of death outcome was not different between fondaparinux and placebo arms (RR 0.76, 95% CI 0.48 to 1.22; P = 0.26; 8 studies; 6674 participants).
Our results did not show differences in MI (RR 0.25, 95% CI 0.03 to 2.19; P = 0.21; 5 studies; 5777 participants) or other serious adverse effects (RR 0.98, 95% CI 0.77 to 1.24; P = 0.85; 7 studies; 6581 participants) between fondaparinux and placebo. Most of the included studies reporting MI did not classify MI into fatal and non‐fatal events.
The quality of evidence for total VTE, total DVT and proximal DVT was moderate, and the quality of evidence for symptomatic VTE and total PE was high. The quality of evidence for major bleeding and all causes of death was moderate. See summary of findings Table for the main comparison.
Sensitivity analysis and subgroup analysis
We added Yokote 2011 to the analysis to assess its effects on treatment effects. Results did not change for VTE, PE and bleeding outcomes. Yokote 2011 did not report on the other outcomes of this review. For details, see the Data and analyses section, Comparison 2.
The CALISTO study investigated fondaparinux for the treatment of patients with superficial venous thrombosis (SVT), as well as for VTE prevention. Considering that the clinical characteristics were different between participants with SVT and other participants included in the meta‐analyses, we performed another sensitivity analysis that excluded the CALISTO study. Results showed no significant differences. For details, see the Data and analyses section, Comparison 3.
We also performed subgroup analyses based on different clinical conditions (by dividing studies into surgery, superficial thrombophlebitis and medically ill participants subgroups). Subgroup analyses showed no differences between subgroups for total VTE, major bleeding, all causes of death and other serious adverse effects (for details, see the Data and analyses section, Comparison 4). The medically ill participants subgroup showed no significant differences between fondaparinux and placebo in total DVT and proximal DVT. For total PE, results revealed no significant differences between fondaparinux and placebo arms in every subgroup. The medically ill patients and thrombophlebitis subgroups exhibited no significant differences between fondaparinux and placebo in terms of major bleeding. However, we included only one study for each of the superficial thrombophlebitis and medically ill participants subgroups.
Fondaparinux versus LMWH
Twelve studies (ACT2545; EFFORT; EPHESUS; FONDACAST; L‐8635; Li 2015; PEGASUS; PENTAMAKS; PENTATHLON; PENTATHLON 2000; PENTHIFRA; Shen 2014) compared the efficacy and safety of fondaparinux versus LMWH for the prevention of VTE. We combined the first 11 studies into meta‐analyses. Total VTE, total DVT and proximal DVT outcomes showed significant heterogeneity; therefore, we used the random‐effects model. Outcomes of symptomatic VTE, total PE, fatal PE, non‐fatal PE, major bleeding, fatal bleeding, all causes of death, MI and other serious adverse effects showed low heterogeneity; therefore, we used the fixed‐effect model for analyses of these variables. The heterogeneity assessment of symptomatic VTE showed a P value for the Chi‐squared test of 0.16 and an I2 statistic of 35%; after discussion, we decided to analyse this outcome by using the fixed‐effect model. Results showed that fondaparinux reduced VTE and DVT (RR 0.55, 95% CI 0.42 to 0.73; P < 0.0001; 11 studies; 9339 participants; and RR 0.54, 95% CI 0.40 to 0.71; P < 0.0001; 10 studies; 9356 participants, respectively) and showed a trend towards reduced proximal DVT (RR 0.58, 95% CI 0.33 to 1.02; P = 0.06; 9 studies; 8361 participants). EPHESUS, PEGASUS, PENTAMAKS, PENTATHLON, PENTATHLON 2000, PENTHIFRA, Li 2015, EFFORT and FONDACAST reported symptomatic VTE. The combined result showed no differences between fondaparinux and LMWH in symptomatic VTE (RR 1.03, 95% CI 0.65 to 1.63; P = 0.90; 9 studies; 12,240 participants). Fondaparinux increased major bleeding (RR 1.38, 95% CI 1.09 to 1.75; P = 0.008; 11 studies; 12,501 participants) but did not increase fatal bleeding (RR 0.71, 95% CI 0.14 to 3.62; P = 0.68; 6 studies; 10,293 participants). Total PE, fatal PE and non‐fatal PE were not different (RR 1.24, 95% CI 0.65 to 2.34; P = 0.51; 10 studies; 12,350 participants; and RR 0.72, 95% CI 0.25 to 2.05; P = 0.54; 9 studies; 11,107 participants; and RR 1.40, 95% CI 0.63 to 3.11; P = 0.41; 9 studies; 11,107 participants, respectively) between fondaparinux and LMWH groups. All PE events were symptomatic events. Shen 2014 reported VTE rates of fondaparinux and LMMH groups as 7.02% and 8.47%, respectively (P = 0.957). However, because Shen 2014 did not report the number of events for each group, we did not include this study in the meta‐analysis.
EPHESUS, FONDACAST, PEGASUS, PENTAMAKS, PENTATHLON, PENTATHLON 2000 and PENTHIFRA reported deaths, and ACT2545, Li 2015, EFFORT and L‐8635 reported no cases of death. The pooled result showed no differences between fondaparinux and LMWH arms (RR 0.88, 95% CI 0.63 to 1.22; P = 0.44; 11 studies; 12,400 participants). EPHESUS, PENTATHLON and PENTHIFRA also reported deaths associated with VTE or bleeding. Pooled results did not show a difference (RR 0.89, 95% CI 0.38 to 2.07; P = 0.79; 5 studies; 4774 participants). Results showed no differences in MI (RR 1.28, 95% CI 0.69 to 2.37; P = 0.43; 6 studies; 10,720 participants) nor in other serious adverse effects (RR 1.06, 95% CI 0.94 to 1.19; P = 0.31; 10 studies; 12,465 participants) between the two types of medicine. Most included studies did not classify MI data into fatal and non‐fatal events.
The quality of evidence was moderate for total VTE, symptomatic VTE, total DVT, total PE and all causes of death, and was low for proximal DVT. The quality of evidence was high for major bleeding. See summary of findings Table 2.
Sensitivity analysis and subgroup analysis
We subsequently added the studies L‐8541 and Yokote 2011 to the analysis to assess their effects. Results did not change significantly for total VTE, symptomatic VTE, total DVT, proximal DVT, total PE, fatal PE, non‐fatal PE, major bleeding, fatal bleeding, all causes of death and other serious adverse effects. For details, see the Data and analyses section, Comparison 6.
Because the doses of fondaparinux and enoxaparin used in the EFFORT study were double those used by other included studies, we excluded the EFFORT study in another sensitivity analysis to assess the effects of these different doses. Results were not significantly changed for any outcomes. For details, see the Data and analyses section, Comparison 7.
We performed subgroup analyses comparing fondaparinux versus LMWH on the basis of different clinical conditions (by dividing studies into orthopaedic, abdominal surgery, bariatric surgery and ICU patients subgroups). Subgroup analyses showed no differences between subgroups. Subgroup analyses revealed no differences between study arms in the orthopaedic subgroup in symptomatic VTE, proximal DVT, total DVT, total VTE, major bleeding, total PE, all causes of death and other serious adverse effects (for details, see the Data and analyses section, Comparison 8). In addition, we noted no differences between fondaparinux and LMWH arms in total VTE, total DVT and major bleeding outcomes in the other three subgroups. However, we included only one study in each of the other three subgroups.
Fondaparinux versus warfarin
Only one study (Bern 2015) compared fondaparinux versus variable dose warfarin (target INR 2.0 to 2.5) for VTE prevention after hip or knee replacement until day 28 ± 2 after operation. Investigators included 118 participants in each of the two treatment groups and reported no VTE events (VTE, DVT or PE) in either group. They reported three cases of major bleeding in the fondaparinux group and none in the variable dose warfarin groups, showing no differences between groups (RR 7.00, 95% CI 0.37 to 134.5; 236 participants). Study authors reported no fatal bleeding. The quality of the evidence for all outcomes was very low. For details, see the Data and analyses section, Comparison 9.
Bern 2015 also compared fondaparinux with the fixed dose 1 mg once daily warfarin for VTE prevention. They reported no VTE events in the fondaparinux group and two distal DVTs in the 1 mg warfarin group, showing no statistically significant differences (RR 0.2, 95% CI 0.01 to 4.12; 236 participants for VTE and total DVT analyses). Results showed three and one major bleeding events, respectively, in the fondaparinux and 1 mg warfarin groups (RR 3.00, 95% CI 0.32 to 28.43; 236 participants). The quality of the evidence for all outcomes was very low. For details, see the Data and analyses section, Comparison 10.
Bern 2015 reported no deaths and no other serious adverse events.
Fondaparinux versus edoxaban
Only one study (Fuji 2015) involving 43 participants compared fondaparinux (1.5 mg sc once daily) versus edoxaban (15 mg oral once daily) for patients with renal impairment undergoing lower‐limb orthopaedic surgery. Researchers reported no cases of thromboembolic and major bleeding events in the fondaparinux and edoxaban groups. In addition, they reported no deaths. The quality of the evidence for all outcomes was very low. For details, see the Data and analyses section, Comparison 11.
Fondaparinux versus mechanical thromboprophylaxis
Only one study (AR3106116) compared fondaparinux with the mechanical thromboprophylaxis method and intermittent pneumatic compression (IPC). This study showed no differences in total VTE (RR 0.61, 95% CI 0.22 to 1.67; 99 participants), DVT (RR 0.63, 95% CI 0.23 to 1.72; 100 participants) or other serious adverse effects (RR 0.18, 95% CI 0.02 to 1.67; 120 participants) between fondaparinux and IPC. Results included no cases of symptomatic VTE, proximal DVT, PE, major bleeding or death,although this is likely a result of the fact that the study lasted only up to eight days. The quality of the evidence for all outcomes was low. For details, see the Data and analyses section, Comparison 12.
Discussion
Summary of main results
We included in this review 25 studies with a total of 21,004 participants; all investigated fondaparinux for venous thromboembolism (VTE) prevention, and no studies examined idraparinux or idrabiotaparinux for prevention of VTE.
Fondaparinux versus placebo
Our results show that compared with placebo, fondaparinux reduced VTE events for people needing VTE prevention. Effects of fondaparinux were consistent in nearly all efficacy outcomes and in most of the included studies. summary of findings Table for the main comparison shows that the quality of the evidence was moderate for total VTE. Therefore, we can conclude that fondaparinux is effective for VTE prevention. Results also demonstrate that fondaparinux reduced symptomatic VTE, total deep venous thrombosis (DVT), proximal DVT and total pulmonary embolism (PE), and the quality of evidence for these analyses was moderate or high, indicating that fondaparinux is effective for VTE prevention. At the same time, however, our results show that fondaparinux increased major bleeding compared with placebo. The quality of the evidence was moderate. This finding is significant, as major bleeding is vital for assessing the safety of anticoagulants. As a result, we consider that caution is warranted when fondaparinux is used in people who are at high risk of bleeding. In the analyses of all causes of death, we did not show a difference in numbers of deaths between fondaparinux and placebo. Sensitivity analyses did not change these results.
In subgroup analyses for different clinical conditions, we included only one study in the medically ill and superficial thrombophlebitis subgroups, respectively. Therefore, information was insufficient to permit conclusions on the efficacy and safety of fondaparinux for different clinical conditions. In the medically ill patients subgroup, fondaparinux caused fewer deaths than were caused by placebo (P = 0.06). However, we included only one study (ARTEMIS), and, as a result, evidence was insufficient to show a real trend. The medically ill patients group is a special group of patients that usually consists of more seriously ill and bedridden patients. In such a clinical setting, fondaparinux may have a larger effect. Our analyses (Analysis 4.1) show that fondaparinux significantly reduced total VTE, with a P value of 0.02 compared with placebo, in the medically ill patients subgroup. However, according to available evidence, the reduced VTE rate failed to significantly improve the survival rate. In addition, the small number of included studies did not allow us to draw conclusions. We need additional randomised controlled trials (RCTs) to assess whether fondaparinux can reduce mortality among medically ill patients. In the surgery patients subgroup analyses, only APOLLO investigated patients undergoing abdominal surgery, only Kolluri 2016 investigated those undergoing bariatric surgery and the remaining four studies investigated orthopaedic patients. Consequently, it is suggested that fondaparinux is effective for VTE prevention among orthopaedic patients, although the evidence for patients undergoing other types of surgery remains insufficient. This may be the case because it is common for orthopaedic surgeons to give anticoagulation treatment to immobilised patients. At the same time, it is not usual for surgeons from other departments to administer anticoagulative medicine to prevent VTE in immobilised patients after surgery. We need additional high‐quality studies on fondaparinux for VTE prevention among people in clinical settings other than orthopaedics.
Fondaparinux versus low molecular weight heparin (LMWH)
We demonstrated that total VTE was reduced in the fondaparinux group compared with the LMWH group, but symptomatic VTE was not different. Results indicate that fondaparinux decreased only non‐symptomatic VTE compared with LMWH. As the importance of non‐symptomatic isolated distal DVT remains unclear, most studies cannot show a significant increase in mortality or in the incidence of post‐thrombotic syndrome (Palareti 2012). In addition, the quality of evidence for the efficacy analyses was moderate or low. See summary of findings Table 2. We showed a tendency for fondaparinux to reduce proximal DVT compared with LMWH (P = 0.06). According to Hansson 2000, asymptomatic proximal DVT causes significantly more deaths compared with both asymptomatic distal DVT and no DVT; therefore, targeting of asymptomatic proximal DVT is an appropriate endpoint in future clinical studies of venous thromboprophylaxis. Moreover, our results show that fondaparinux increased the major bleeding rate. In terms of safety, fondaparinux was inferior to LMWH. In summary, on the basis of available evidence, we conclude that fondaparinux may be more effective than LMWH for VTE prevention, but it increases the major bleeding rate, which limits its usefulness.
Similar to the fondaparinux versus placebo subgroup analysis, we included only one study in the abdominal surgery and ICU patients subgroups, respectively, and the subgroup result was not significantly different from the total result. Therefore, we cannot draw conclusions regarding the superiority or inferiority of fondaparinux compared with LMWH in different clinical conditions for VTE prophylaxis.
Fondaparinux versus other methods of thromboprophylaxis
Only one study (Bern 2015) compared fondaparinux versus variable warfarin (target INR 2 to 2.5) and 1 mg once daily warfarin for VTE prevention among patients who have undergone elective hip or knee replacement surgery. This study was small, and reported efficacy and safety outcomes were rare. Only one study (Fuji 2015) compared fondaparinux with edoxaban. Thus the evidence on fondaparinux compared with anticoagulants other than LMWH for VTE prevention was insufficient to allow any conclusions. Additional studies are needed.
Only one small study (AR3106116) with a short duration of eight days compared fondaparinux versus mechanical thromboprophylaxis. Evidence was insufficient to allow any conclusions. Additional studies are needed for this comparison.
Overall completeness and applicability of evidence
All included studies of fondaparinux for VTE prevention investigated total VTE and major bleeding as primary efficacy and safety outcomes.
No studies reported on fondaparinux versus other anticoagulation methods besides LMWH, warfarin, edoxaban and an intermittent pneumatic compression device (IPC), such as unfractionated heparin, aspirin, oral thrombin inhibitors and other direct factor X inhibitors; too few studies have examined fondaparinux versus LMWH, warfarin, edoxaban and IPC for VTE prevention. In addition, no study investigated long‐acting pentasaccharides (idraparinux and idrabiotaparinux) and pentasaccharides other than fondaparinux for primary VTE prevention.
Most studies of fondaparinux have focused on prevention of VTE among patients undergoing orthopaedic surgery. Therefore, our results mainly reflect fondaparinux for VTE prevention among these patients. Subgroup analyses did not include enough studies in subgroups other than orthopaedic patients, such as the medically ill patients subgroup and the superficial venous thrombosis subgroup; hence, the evidence is insufficient to reveal whether effects and adverse effects of fondaparinux are different for patients in different clinical settings. Therefore, we are in greater need of studies that focus on fondaparinux for VTE prevention in different clinical conditions, such as gynaecological surgery, neurological surgery, etc, and other medical conditions, such as malignant disease.
Quality of the evidence
See summary of findings Table for the main comparison, summary of findings Table 2, summary of findings Table 3, summary of findings Table 4 and summary of findings Table 6.
Most of the studies included in this systematic review were high‐quality RCTs with large sample sizes and reliable randomisation methods. All outcome assessments were completed by independent adjudicated committees that were blind to randomisation, and most VTEs were diagnosed by objective reliable tests (venography, independent ultrasonography, etc, for DVT; spiral computed tomography (CT), venography, etc, for PE). These points enhanced the quality of the evidence. On the other hand, some included studies were open‐label or single‐blinded (ACT2545; AR3106116; FONDACAST; L‐8635; Li 2015) with risk affecting allocation (Hills 2009). Most of the included studies (except Bern 2015; Cho 2013; Kolluri 2016; and Li 2015) were organised by a pharmaceutical company, and the four studies that did not receive support from pharmaceutical companies included relatively small samples. These disadvantages could potentially introduce bias and lower the quality of the evidence.
Summary of findings tables show moderate‐quality evidence in the fondaparinux versus placebo meta‐analysis for total VTE, total DVT and proximal DVT, and high‐quality evidence for symptomatic VTE and total PE. At the same time, we graded the quality of the evidence for the efficacy of fondaparinux versus LMWH as moderate or low. The quality of the evidence for major bleeding in the fondaparinux versus both placebo and LMWH analyses was moderate and high, respectively. Reasons for lowering the quality of the evidence included small numbers of events causing imprecision, and heterogeneity or inconsistency between studies. In addition, a potential risk of bias was caused by studies organised by pharmaceutical companies and by lack of publication in languages other than English, although we did not consider these sufficient to downgrade the quality of evidence. The Summary of findings table showed very low‐quality evidence for fondaparinux versus both variable and 1 mg once daily fixed doses of warfarin. We included only one study comparing fondaparinux with warfarin, and events were rare, which lowered the grade of the evidence. The Summary of findings table showed low‐quality evidence for fondaparinux versus mechanical thromboprophylaxis; only one included study performed this comparison, and the study was only up to eight days long, resulting in many outcomes with no reported events, as follow‐up was too short. This study was organised by a pharmaceutical company. The Summary of findings table showed very low‐quality evidence for fondaparinux versus edoxaban. Only one small study assessed this comparison and recorded no events, which led to lowering of the grade of evidence.
Potential biases in the review process
This systematic review had some potential biases.
Most included studies analysed efficacy outcomes by using the per‐protocol strategy, not the intention‐to‐treat (ITT) strategy that was preplanned in our protocol, because most VTE and DVT events were diagnosed by venography, which is an invasive procedure that could not be used on every participant. It would be very difficult to arbitrate these participants without such efficacy evaluation results (about 10% in every study); therefore, we pooled and analysed the results presented by study reports, but not ITT data as planned. Furthermore, we included in the meta‐analysis all VTE events before study time endpoints. So we pooled per‐protocol data but not ITT data, as our protocol had outlined.
ARTEMIS, PEGASUS, PENTATHLON 2000, PENTHIFRA and PENTHIFRA PLUS mentioned that investigators used adjunctive anticoagulation methods but did not report whether they were used equally in the different treatment groups. Because adjunctive methods used by most participants in these studies consisted of graduated compression stockings (GCS), and evidence suggests that GCS would not substantially affect the symptomatic VTE rate (Falck‐Ytter 2012), we decided to include these in the meta‐analysis. Another reason for including these studies was that they included large samples, and excluding them from the meta‐analysis would bias the overall outcome.
Funnel plots for the outcome total VTE in the comparison of fondaparinux versus placebo and LMWH were asymmetrical (Figure 4; Figure 5). Most included studies (except Bern 2015, Cho 2013, Kolluri 2016, Li 2015, Shen 2014 and Yokote 2011) were conducted by pharmaceutical companies, and all were reported in English. Therefore, we considered risk of publication bias was possible. Cho 2013, Shen 2014, Yokote 2011, Li 2015, Bern 2015 and Kolluri 2016 were not conducted by pharmaceutical companies and included relatively small sample sizes. Yokote 2011 failed to report a reliable method used for randomisation; therefore, we included only this study in the sensitivity analysis. Shen 2014 reported VTE rates of fondaparinux and LMWH groups instead of numbers of VTE events, and we were unable to obtain these details when communicating with study authors. Therefore, we did not include Shen 2014 in the meta‐analyses. We included Bern 2015, Kolluri 2016, Li 2015 and Cho 2013 in analyses of primary and secondary outcomes.

Funnel plot of comparison: 1 fondaparinux versus placebo, outcome: 1.1 total VTE.

Funnel plot of comparison: 5 fondaparinux versus LMWH, outcome: 5.1 total VTE.
Finally, because we included all suitable trials on VTE prevention that included patients after orthopaedic and abdominal surgery, medically ill patients and those with superficial venous thrombosis, we noted large heterogeneity in some meta‐analyses. We chose the random‐effects model to analyse the data.
The reliability of this systematic review might be influenced by these factors, and results might need to be interpreted with caution. Although we had some limitations, we believe that our review is significant for evaluating the efficacy and safety of fondaparinux for VTE prevention.
Agreements and disagreements with other studies or reviews
Our results show that fondaparinux was more effective in VTE prevention than both placebo and LMWH. Results were consistent with those reported by the Bounameaux 2002, Nijkeuter 2004 and Falck‐Ytter 2012 reviews. In the Antithrombotic Therapy and Prevention of Thrombosis Guidelines (Falck‐Ytter 2012), review authors combined five large trials comparing fondaparinux 2.5 mg started six to eight hours after wound closure versus a routine prophylactic dose of LMWH for patients after surgery. Review authors showed that fondaparinux reduced the asymptomatic DVT rate significantly but did not show significant differences in symptomatic DVT and PE rates between the two types of anticoagulants. In our systematic review, we showed that fondaparinux significantly reduced total VTE and DVT rates but did not reduce symptomatic DVT and PE rates. On the other hand, our systematic review showed that fondaparinux might reduce proximal DVT by less than 50% compared with LMWH (risk ratio (RR) 0.56, 95% confidence interval (CI) 0.31 to 1.0; P = 0.06), although this finding was not statistically significant. In Falck‐Ytter 2012, review authors did not study this outcome. The proximal DVT analysis result might be helpful, as proximal DVT is associated with more recurrent VTE (symptomatic and non‐symptomatic) and more frequent deaths than distal DVT (Pinede 2001). We need additional data to confirm whether the result was caused by real efficacy of fondaparinux or occurred by chance. For bleeding risk, Falck‐Ytter 2012 demonstrated a substantial increase in bleeding requiring reoperation associated with the use of fondaparinux (RR 1.85, 95% CI 1.1 to 3.11) compared with LMWH, but showed no difference in the non‐fatal major bleeding rate (RR 1.35, 95% CI 0.89 to 2.05). In our analyses, we showed that fondaparinux increased overall major bleeding (Analysis 5.8) but did not increase fatal bleeding. Our review used a different definition of fatal bleeding than was used in Falck‐Ytter 2012. Also, participants in our study were different from those involved in the Falck‐Ytter 2012 study. We included all people requiring primary VTE prevention, but Falck‐Ytter 2012 included only people who had undergone surgery. In addition, participants included in our review were potentially at lower risk of haemorrhage. Nevertheless, fondaparinux increased the overall major bleeding rate compared with LMWH. Our systematic review and the Falck‐Ytter 2012 study suggest similar efficacy and safety of fondaparinux for VTE prevention in different patient populations.
Fondaparinux is the first agent in its class that was approved by the US Food and Drug Administration and the European Agency for the Evaluation of Medicinal Products. Compared with LMWH for short‐term VTE prevention, it is more effective and has predictable linear pharmacokinetics (PENTATHLON). Fondaparinux is rarely neutralised by platelet factor 4 and is highly unlikely to cause thrombocytopaenia (Amiral 1997). Fondaparinux highly selectively inhibits factor Xa with no direct effect against the thrombin molecule itself (Olson 1992). However, it causes more major bleeding, which limits its use. Therefore, we should be cautious when using fondaparinux for VTE prevention, especially in people who are at high risk of bleeding. Our results show that when fondaparinux is injected at a dose of 2.5 mg once daily, it not only reduces VTE but also increases bleeding significantly compared with the routine dose of LMWH for VTE prophylaxis. In a Cochrane systematic review (Brito 2011), review authors showed that fondaparinux was non‐inferior to LMWH in anticoagulative efficacy and lowered both major and minor bleeding rates compared with LMWH when used in the treatment of patients with acute coronary syndrome. In that research, the LMWH dose was approximately two times the dose used in our review, but the fondaparinux dose was the same as the one reported here. Therefore, we speculate that the higher major bleeding rate of fondaparinux might be caused by the relatively high dose used for VTE prevention. Dose‐response studies (DRI4090; DRI4757; PENTATHLON) have shown that when the fondaparinux dose is increased, bleeding risk is increased. Further research is warranted on whether the bleeding rate can be reduced by reducing the fondaparinux dose, for example, 2 mg or 1.5 mg sc once daily, without an effect on its efficacy in VTE prevention. Several recent studies on 1.5 mg once daily fondaparinux used for VTE prophylaxis for patients with renal dysfunction (Ageno 2012; Delavenne 2012; Mismetti 2012) showed that it was effective and would cause little bleeding. Pharmacokinetics studies (Delavenne 2010; Delavenne 2012) have reported interindividual variability with the same dose of fondaparinux between patients with different body weight, age and creatinine clearance. Currently, only one dose of 2.5 mg fondaparinux is used for VTE prevention. Perhaps this is not suitable for all people, and the fondaparinux dose may need to be adjusted according to body surface area, body weight, age, risk of thrombosis, renal function, etc, when used for VTE prevention.

Study flow diagram.

Risk of bias graph: review authors' judgements about each risk of bias item presented as percentages across all included studies.

Risk of bias summary: review authors' judgements about each risk of bias item for each included study.
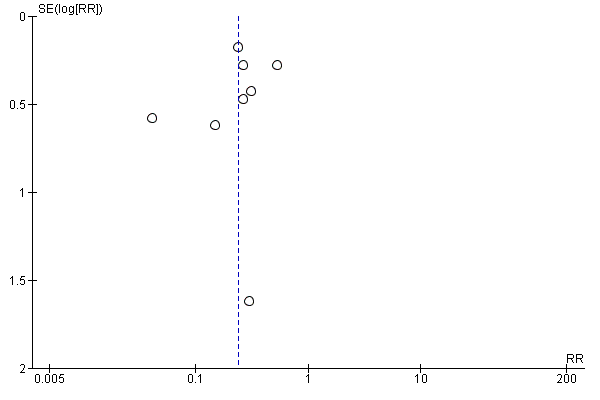
Funnel plot of comparison: 1 fondaparinux versus placebo, outcome: 1.1 total VTE.
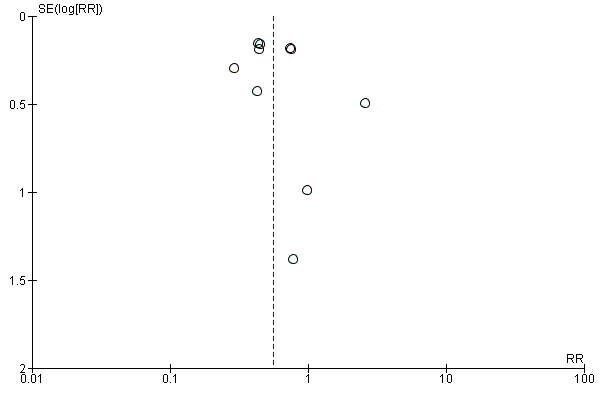
Funnel plot of comparison: 5 fondaparinux versus LMWH, outcome: 5.1 total VTE.

Comparison 1 Fondaparinux versus placebo, Outcome 1 total VTE.

Comparison 1 Fondaparinux versus placebo, Outcome 2 symptomatic VTE.
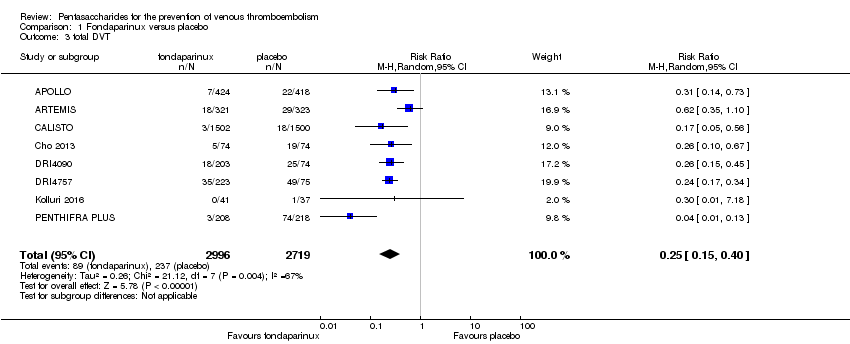
Comparison 1 Fondaparinux versus placebo, Outcome 3 total DVT.
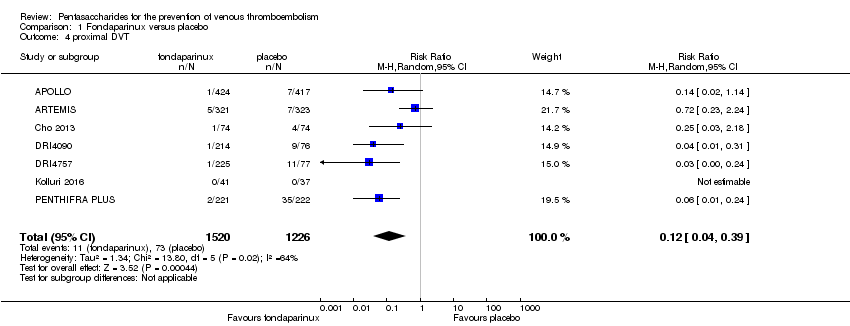
Comparison 1 Fondaparinux versus placebo, Outcome 4 proximal DVT.
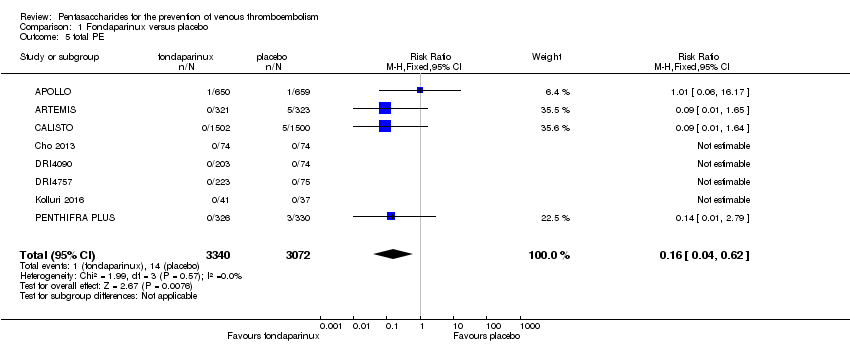
Comparison 1 Fondaparinux versus placebo, Outcome 5 total PE.
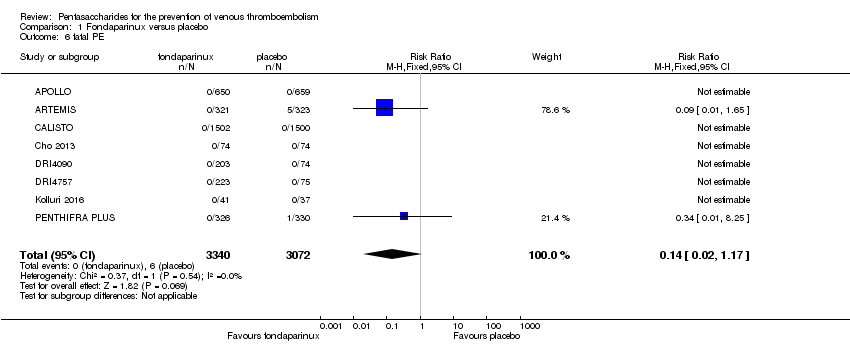
Comparison 1 Fondaparinux versus placebo, Outcome 6 fatal PE.

Comparison 1 Fondaparinux versus placebo, Outcome 7 non‐fatal PE.

Comparison 1 Fondaparinux versus placebo, Outcome 8 major bleeding.

Comparison 1 Fondaparinux versus placebo, Outcome 9 fatal bleeding.
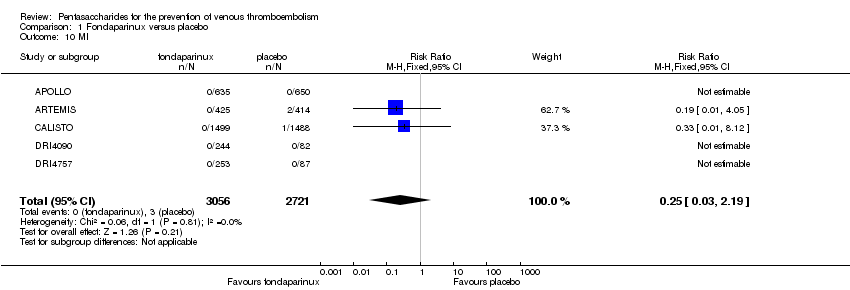
Comparison 1 Fondaparinux versus placebo, Outcome 10 MI.
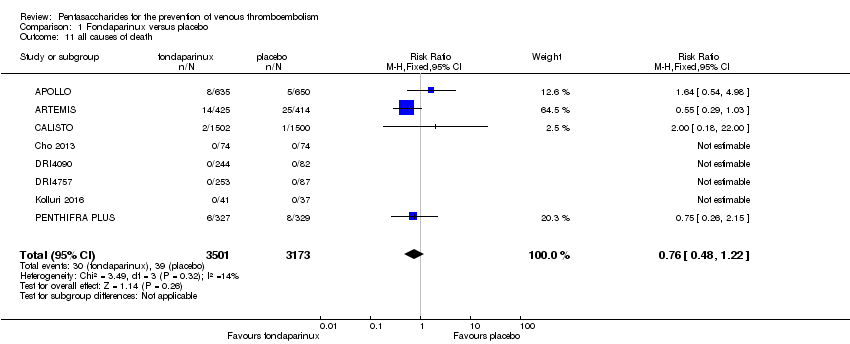
Comparison 1 Fondaparinux versus placebo, Outcome 11 all causes of death.

Comparison 1 Fondaparinux versus placebo, Outcome 12 other serious adverse effects.

Comparison 2 Fondaparinux versus placebo sensitivity analysis inserting Yokote 2011, Outcome 1 total VTE.

Comparison 2 Fondaparinux versus placebo sensitivity analysis inserting Yokote 2011, Outcome 2 symptomatic VTE.

Comparison 2 Fondaparinux versus placebo sensitivity analysis inserting Yokote 2011, Outcome 3 total DVT.
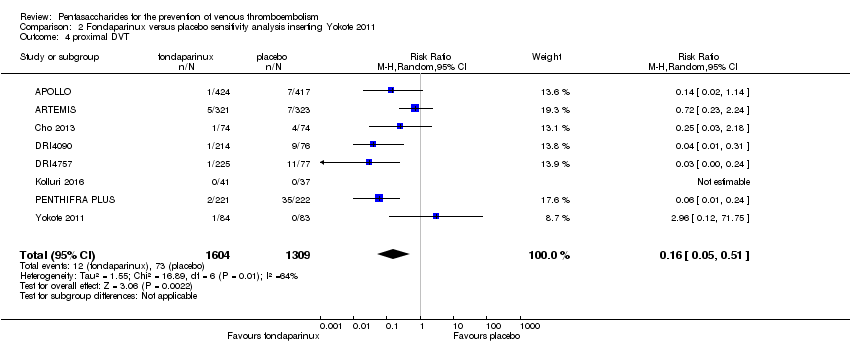
Comparison 2 Fondaparinux versus placebo sensitivity analysis inserting Yokote 2011, Outcome 4 proximal DVT.

Comparison 2 Fondaparinux versus placebo sensitivity analysis inserting Yokote 2011, Outcome 5 total PE.

Comparison 2 Fondaparinux versus placebo sensitivity analysis inserting Yokote 2011, Outcome 6 fatal PE.

Comparison 2 Fondaparinux versus placebo sensitivity analysis inserting Yokote 2011, Outcome 7 non‐fatal PE.

Comparison 2 Fondaparinux versus placebo sensitivity analysis inserting Yokote 2011, Outcome 8 major bleeding.

Comparison 2 Fondaparinux versus placebo sensitivity analysis inserting Yokote 2011, Outcome 9 fatal bleeding.

Comparison 2 Fondaparinux versus placebo sensitivity analysis inserting Yokote 2011, Outcome 10 all causes of death.
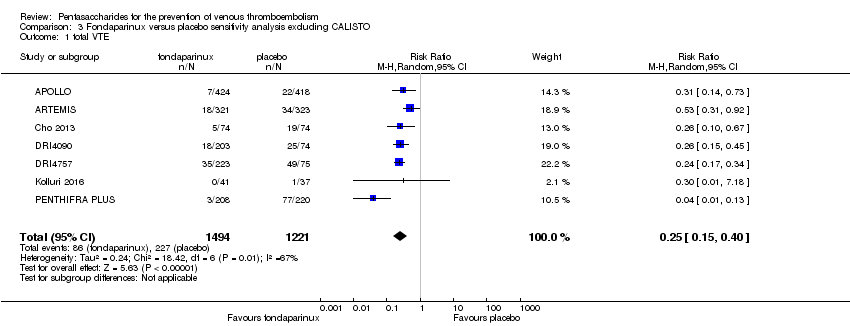
Comparison 3 Fondaparinux versus placebo sensitivity analysis excluding CALISTO, Outcome 1 total VTE.
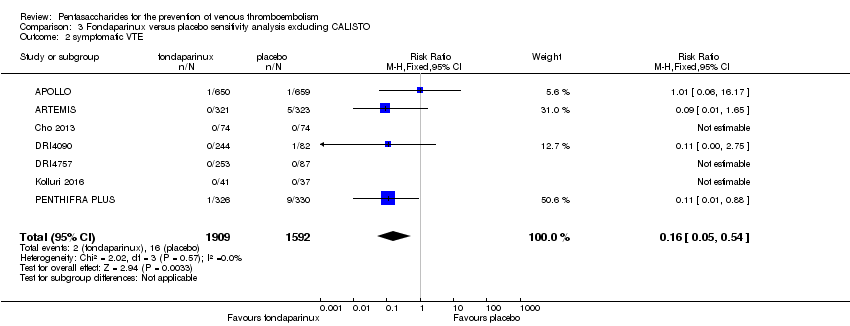
Comparison 3 Fondaparinux versus placebo sensitivity analysis excluding CALISTO, Outcome 2 symptomatic VTE.

Comparison 3 Fondaparinux versus placebo sensitivity analysis excluding CALISTO, Outcome 3 total DVT.

Comparison 3 Fondaparinux versus placebo sensitivity analysis excluding CALISTO, Outcome 4 proximal DVT.

Comparison 3 Fondaparinux versus placebo sensitivity analysis excluding CALISTO, Outcome 5 total PE.
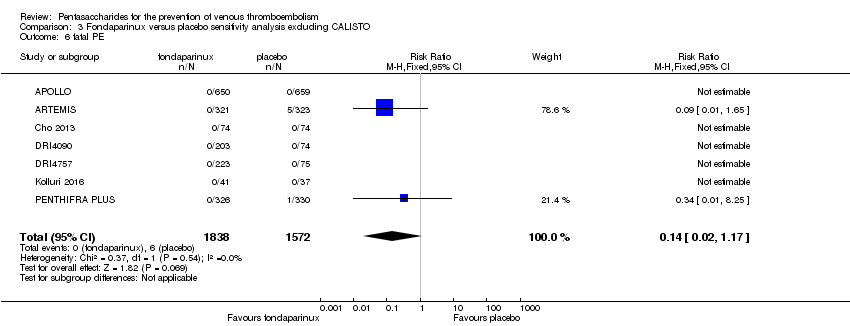
Comparison 3 Fondaparinux versus placebo sensitivity analysis excluding CALISTO, Outcome 6 fatal PE.

Comparison 3 Fondaparinux versus placebo sensitivity analysis excluding CALISTO, Outcome 7 non‐fatal PE.
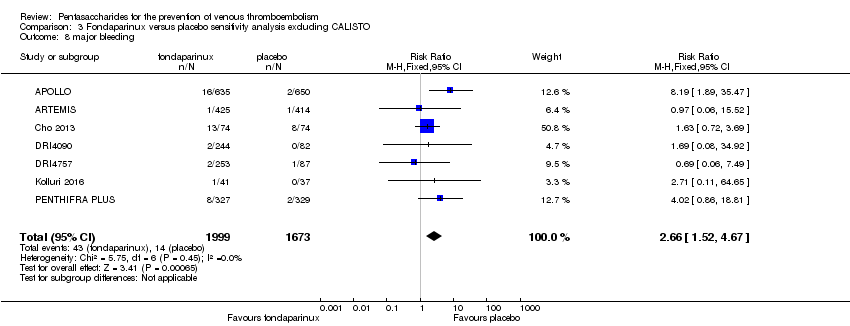
Comparison 3 Fondaparinux versus placebo sensitivity analysis excluding CALISTO, Outcome 8 major bleeding.
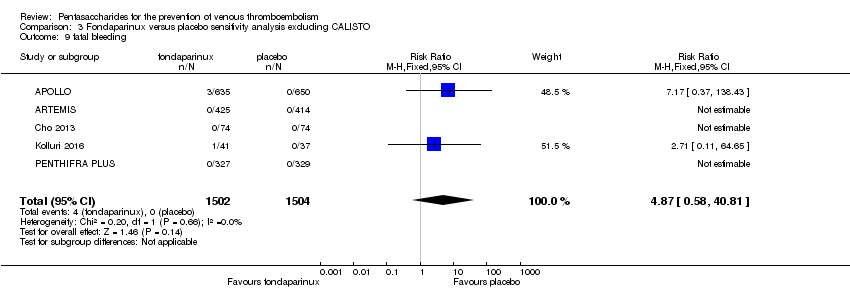
Comparison 3 Fondaparinux versus placebo sensitivity analysis excluding CALISTO, Outcome 9 fatal bleeding.

Comparison 3 Fondaparinux versus placebo sensitivity analysis excluding CALISTO, Outcome 10 MI.

Comparison 3 Fondaparinux versus placebo sensitivity analysis excluding CALISTO, Outcome 11 all causes of death.
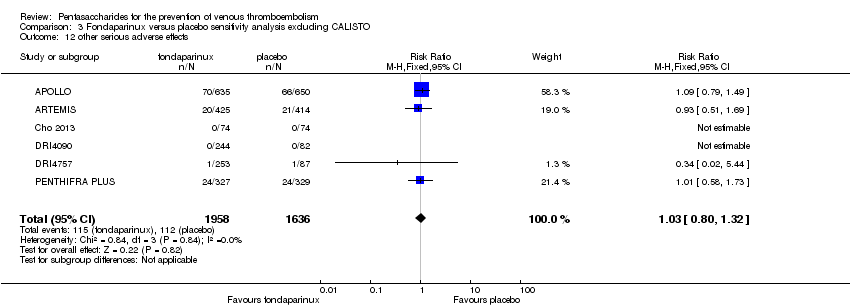
Comparison 3 Fondaparinux versus placebo sensitivity analysis excluding CALISTO, Outcome 12 other serious adverse effects.
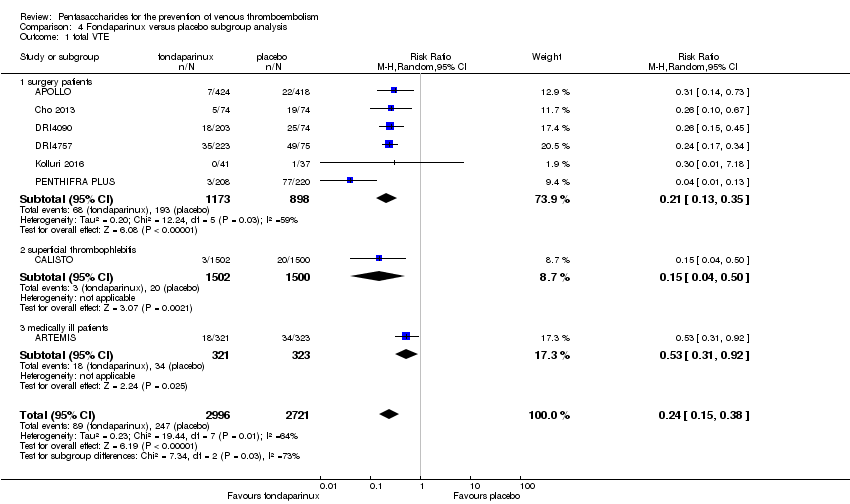
Comparison 4 Fondaparinux versus placebo subgroup analysis, Outcome 1 total VTE.
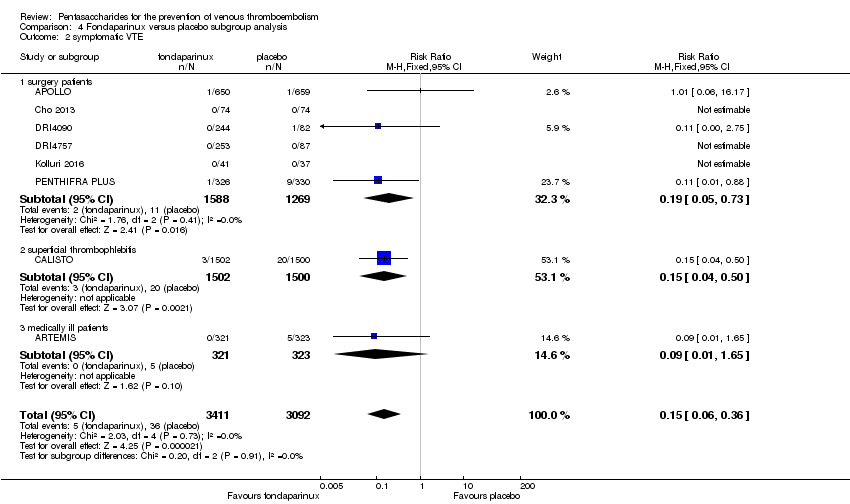
Comparison 4 Fondaparinux versus placebo subgroup analysis, Outcome 2 symptomatic VTE.

Comparison 4 Fondaparinux versus placebo subgroup analysis, Outcome 3 total DVT.

Comparison 4 Fondaparinux versus placebo subgroup analysis, Outcome 4 proximal DVT.

Comparison 4 Fondaparinux versus placebo subgroup analysis, Outcome 5 total PE.

Comparison 4 Fondaparinux versus placebo subgroup analysis, Outcome 6 fatal PE.
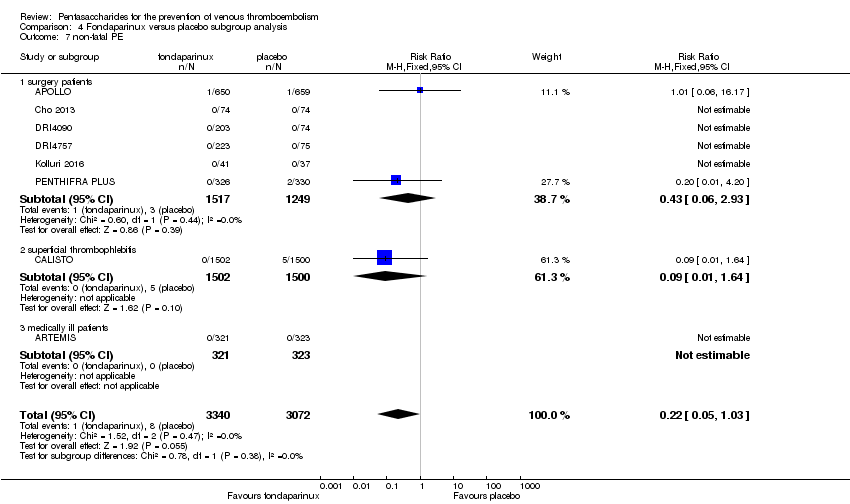
Comparison 4 Fondaparinux versus placebo subgroup analysis, Outcome 7 non‐fatal PE.

Comparison 4 Fondaparinux versus placebo subgroup analysis, Outcome 8 major bleeding.

Comparison 4 Fondaparinux versus placebo subgroup analysis, Outcome 9 fatal bleeding.

Comparison 4 Fondaparinux versus placebo subgroup analysis, Outcome 10 MI.

Comparison 4 Fondaparinux versus placebo subgroup analysis, Outcome 11 all causes of death.

Comparison 4 Fondaparinux versus placebo subgroup analysis, Outcome 12 other serious adverse effects.

Comparison 5 Fondaparinux versus LMWH, Outcome 1 total VTE.
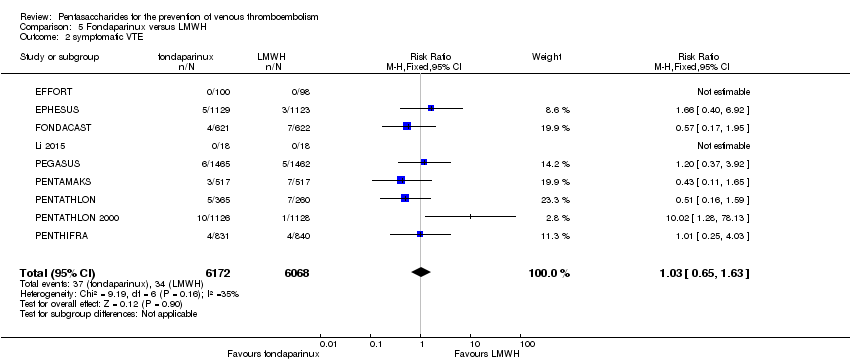
Comparison 5 Fondaparinux versus LMWH, Outcome 2 symptomatic VTE.

Comparison 5 Fondaparinux versus LMWH, Outcome 3 total DVT.

Comparison 5 Fondaparinux versus LMWH, Outcome 4 proximal DVT.

Comparison 5 Fondaparinux versus LMWH, Outcome 5 total PE.

Comparison 5 Fondaparinux versus LMWH, Outcome 6 fatal PE.

Comparison 5 Fondaparinux versus LMWH, Outcome 7 non‐fatal PE.

Comparison 5 Fondaparinux versus LMWH, Outcome 8 major bleeding.
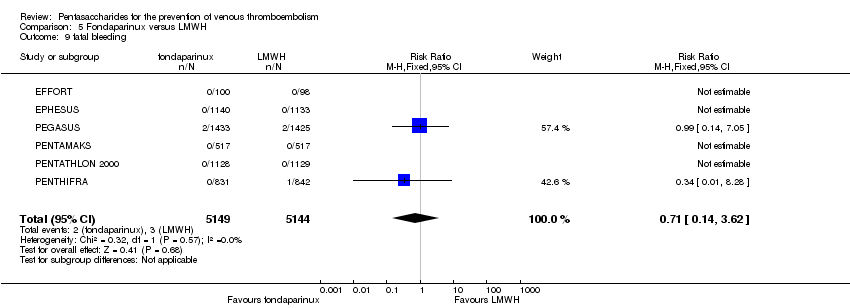
Comparison 5 Fondaparinux versus LMWH, Outcome 9 fatal bleeding.
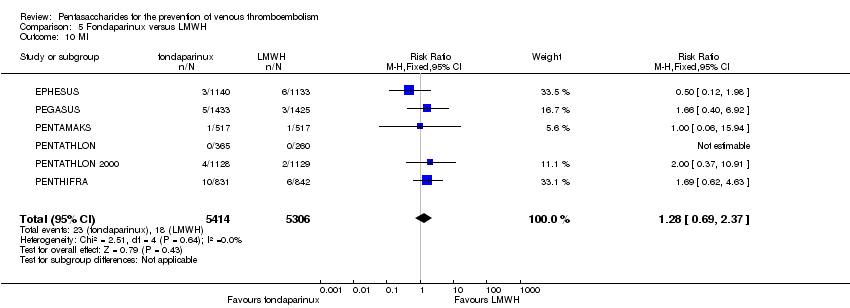
Comparison 5 Fondaparinux versus LMWH, Outcome 10 MI.

Comparison 5 Fondaparinux versus LMWH, Outcome 11 all causes of death.
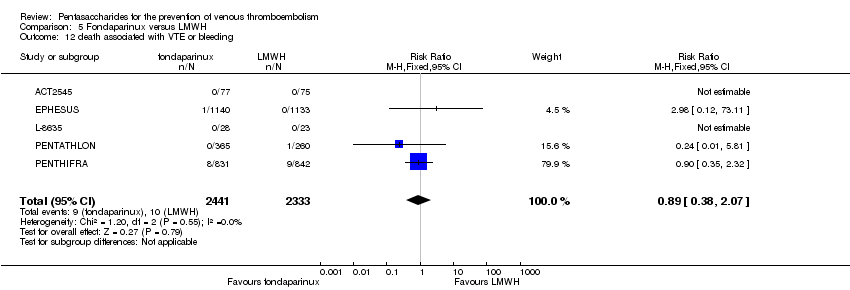
Comparison 5 Fondaparinux versus LMWH, Outcome 12 death associated with VTE or bleeding.
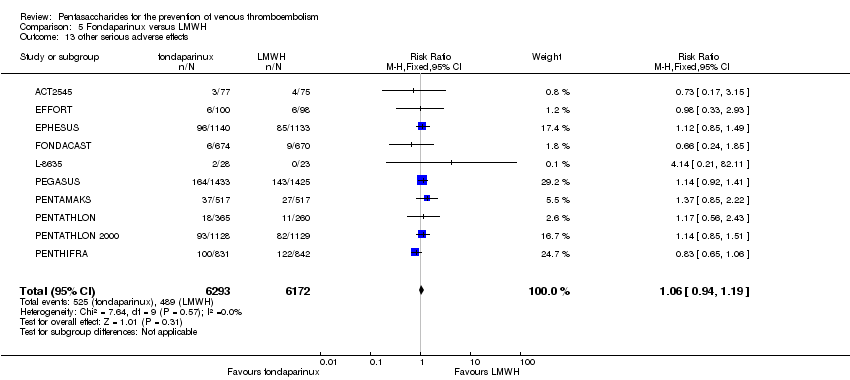
Comparison 5 Fondaparinux versus LMWH, Outcome 13 other serious adverse effects.

Comparison 6 Fondaparinux versus LMWH sensitivity analysis, Outcome 1 total VTE.
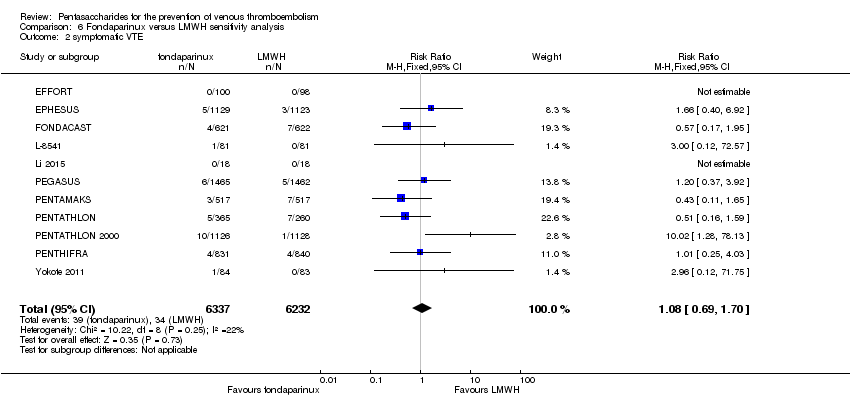
Comparison 6 Fondaparinux versus LMWH sensitivity analysis, Outcome 2 symptomatic VTE.

Comparison 6 Fondaparinux versus LMWH sensitivity analysis, Outcome 3 total DVT.
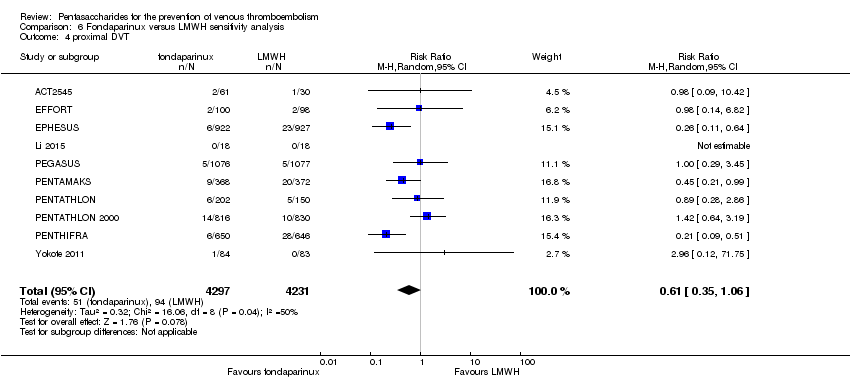
Comparison 6 Fondaparinux versus LMWH sensitivity analysis, Outcome 4 proximal DVT.

Comparison 6 Fondaparinux versus LMWH sensitivity analysis, Outcome 5 total PE.
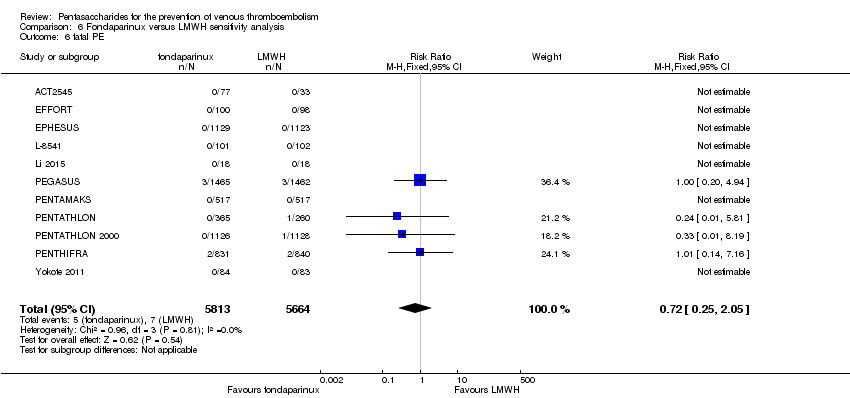
Comparison 6 Fondaparinux versus LMWH sensitivity analysis, Outcome 6 fatal PE.
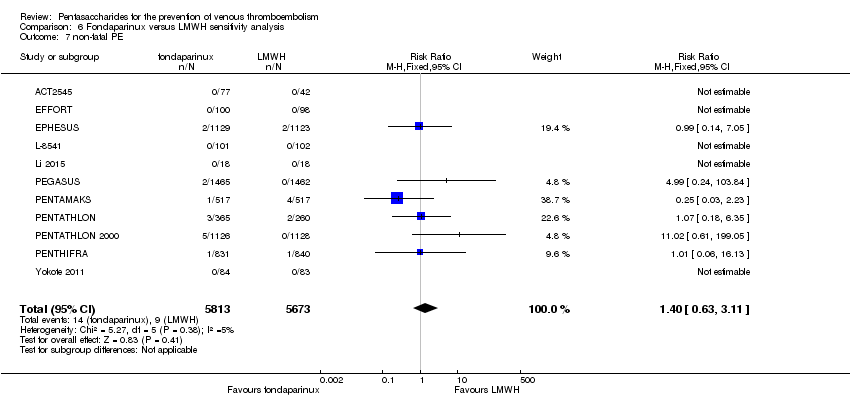
Comparison 6 Fondaparinux versus LMWH sensitivity analysis, Outcome 7 non‐fatal PE.

Comparison 6 Fondaparinux versus LMWH sensitivity analysis, Outcome 8 major bleeding.

Comparison 6 Fondaparinux versus LMWH sensitivity analysis, Outcome 9 fatal bleeding.
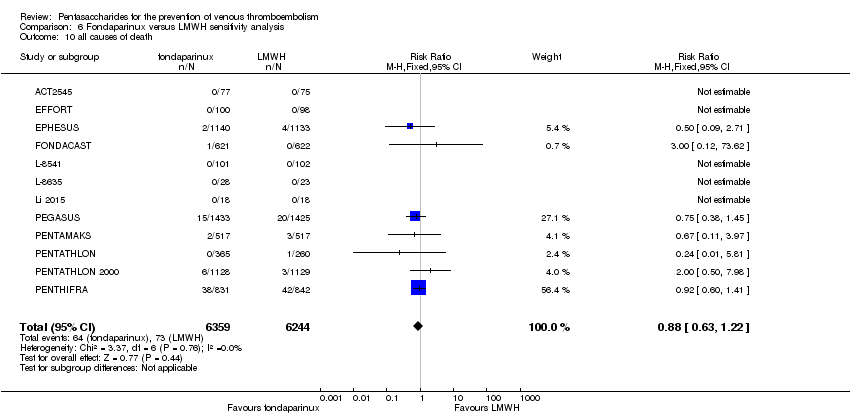
Comparison 6 Fondaparinux versus LMWH sensitivity analysis, Outcome 10 all causes of death.

Comparison 6 Fondaparinux versus LMWH sensitivity analysis, Outcome 11 other serious adverse effects.
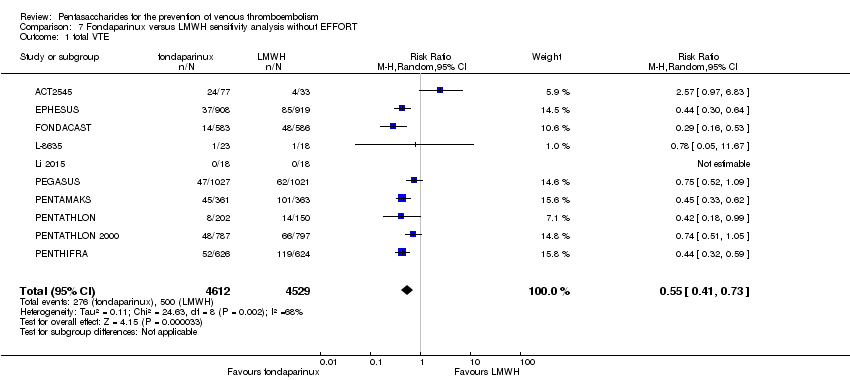
Comparison 7 Fondaparinux versus LMWH sensitivity analysis without EFFORT, Outcome 1 total VTE.
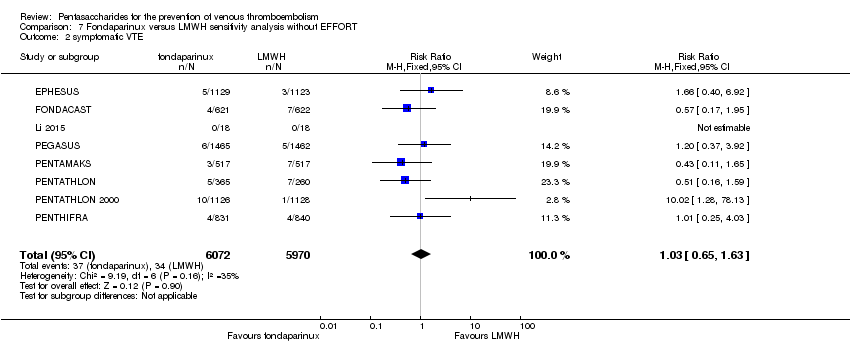
Comparison 7 Fondaparinux versus LMWH sensitivity analysis without EFFORT, Outcome 2 symptomatic VTE.

Comparison 7 Fondaparinux versus LMWH sensitivity analysis without EFFORT, Outcome 3 total DVT.

Comparison 7 Fondaparinux versus LMWH sensitivity analysis without EFFORT, Outcome 4 proximal DVT.
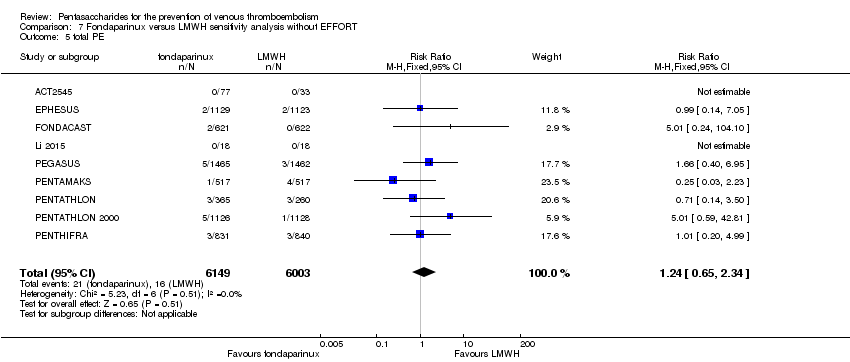
Comparison 7 Fondaparinux versus LMWH sensitivity analysis without EFFORT, Outcome 5 total PE.
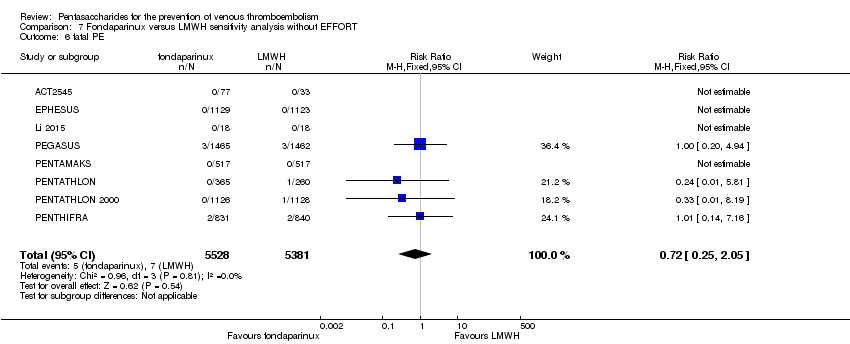
Comparison 7 Fondaparinux versus LMWH sensitivity analysis without EFFORT, Outcome 6 fatal PE.
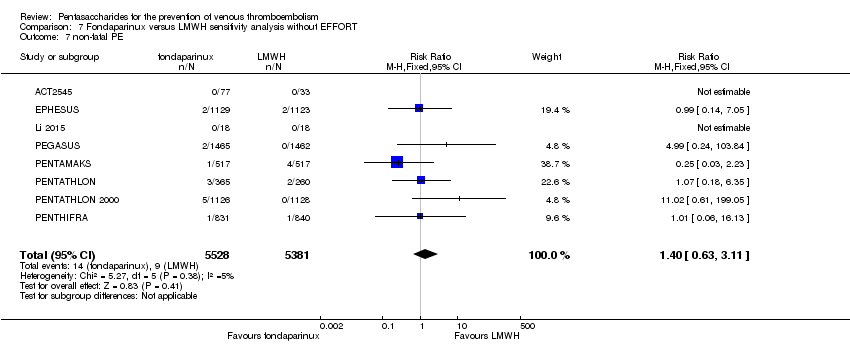
Comparison 7 Fondaparinux versus LMWH sensitivity analysis without EFFORT, Outcome 7 non‐fatal PE.

Comparison 7 Fondaparinux versus LMWH sensitivity analysis without EFFORT, Outcome 8 major bleeding.

Comparison 7 Fondaparinux versus LMWH sensitivity analysis without EFFORT, Outcome 9 fatal bleeding.
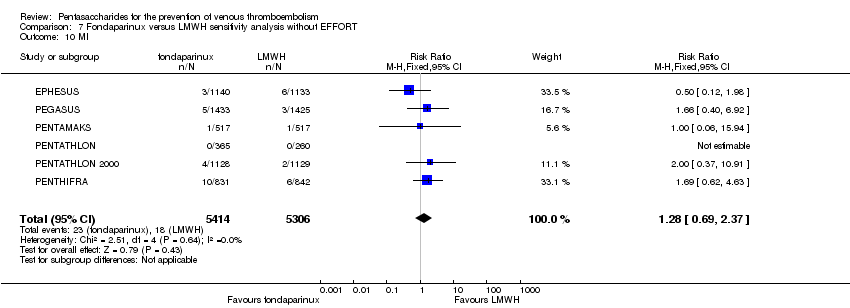
Comparison 7 Fondaparinux versus LMWH sensitivity analysis without EFFORT, Outcome 10 MI.
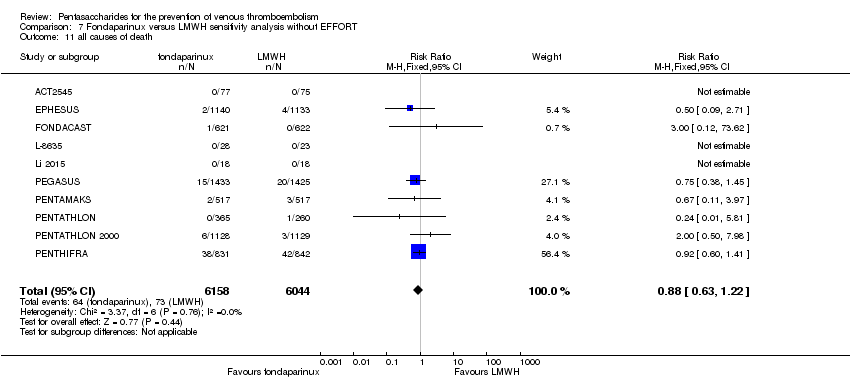
Comparison 7 Fondaparinux versus LMWH sensitivity analysis without EFFORT, Outcome 11 all causes of death.

Comparison 7 Fondaparinux versus LMWH sensitivity analysis without EFFORT, Outcome 12 death associated with VTE or bleeding.

Comparison 7 Fondaparinux versus LMWH sensitivity analysis without EFFORT, Outcome 13 other serious adverse effects.
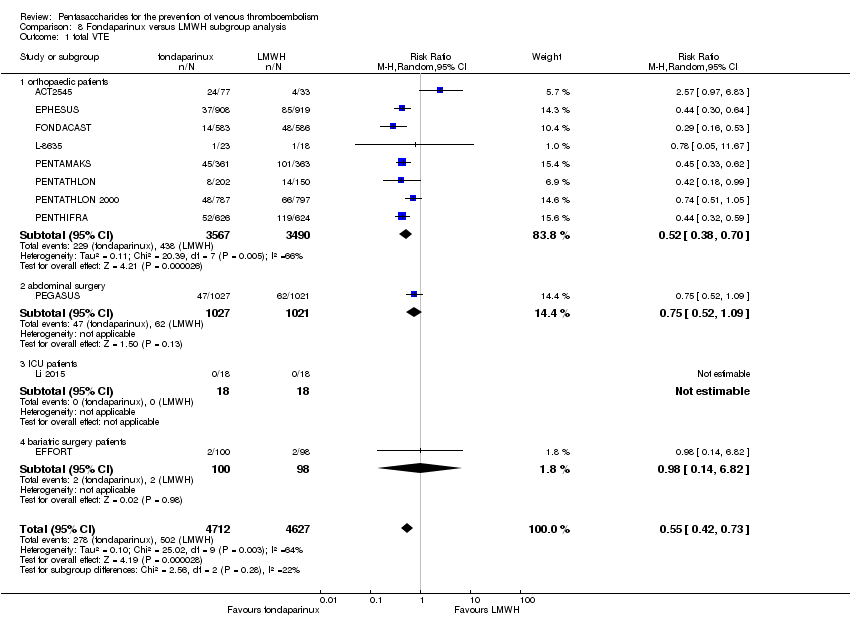
Comparison 8 Fondaparinux versus LMWH subgroup analysis, Outcome 1 total VTE.

Comparison 8 Fondaparinux versus LMWH subgroup analysis, Outcome 2 symptomatic VTE.
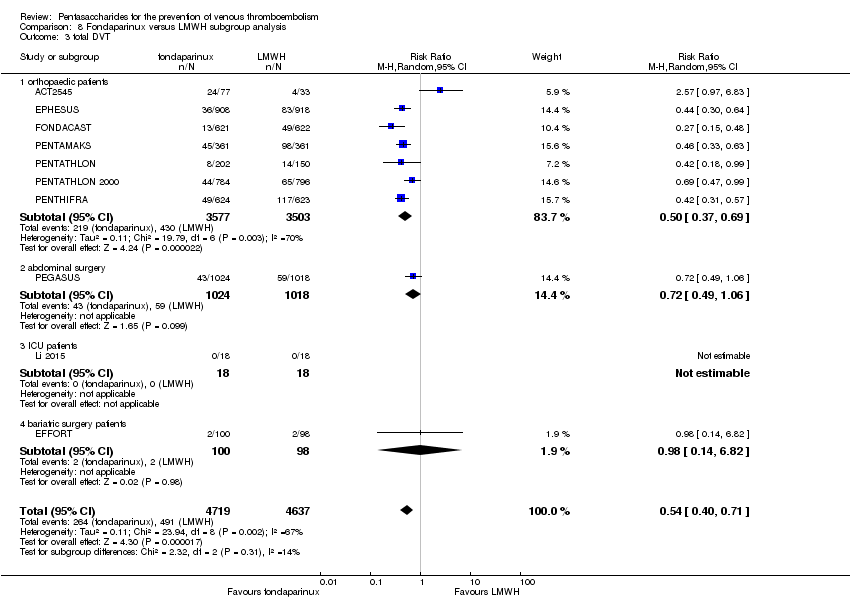
Comparison 8 Fondaparinux versus LMWH subgroup analysis, Outcome 3 total DVT.

Comparison 8 Fondaparinux versus LMWH subgroup analysis, Outcome 4 proximal DVT.

Comparison 8 Fondaparinux versus LMWH subgroup analysis, Outcome 5 total PE.

Comparison 8 Fondaparinux versus LMWH subgroup analysis, Outcome 6 fatal PE.

Comparison 8 Fondaparinux versus LMWH subgroup analysis, Outcome 7 non‐fatal PE.
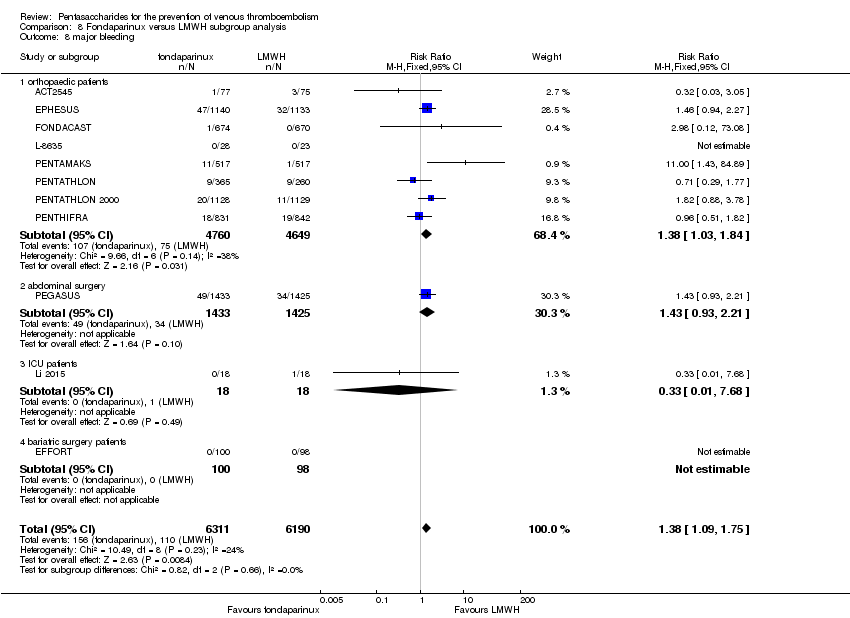
Comparison 8 Fondaparinux versus LMWH subgroup analysis, Outcome 8 major bleeding.
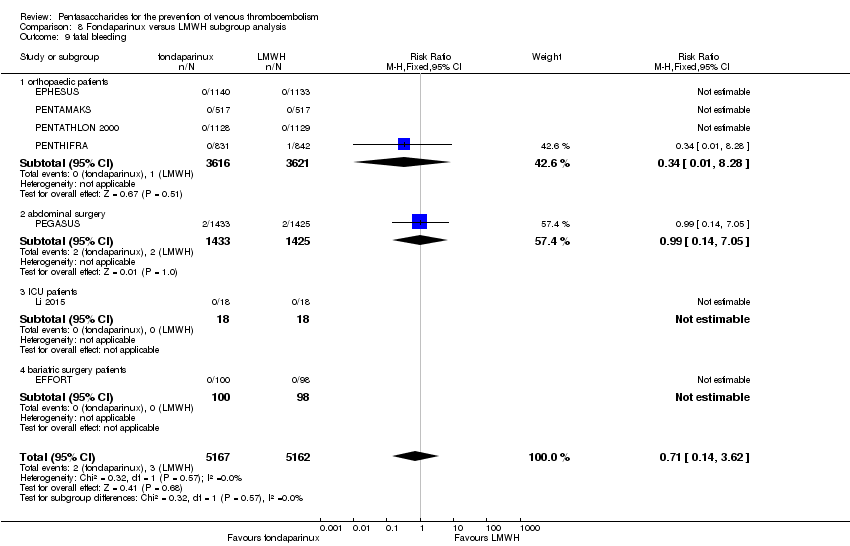
Comparison 8 Fondaparinux versus LMWH subgroup analysis, Outcome 9 fatal bleeding.

Comparison 8 Fondaparinux versus LMWH subgroup analysis, Outcome 10 MI.
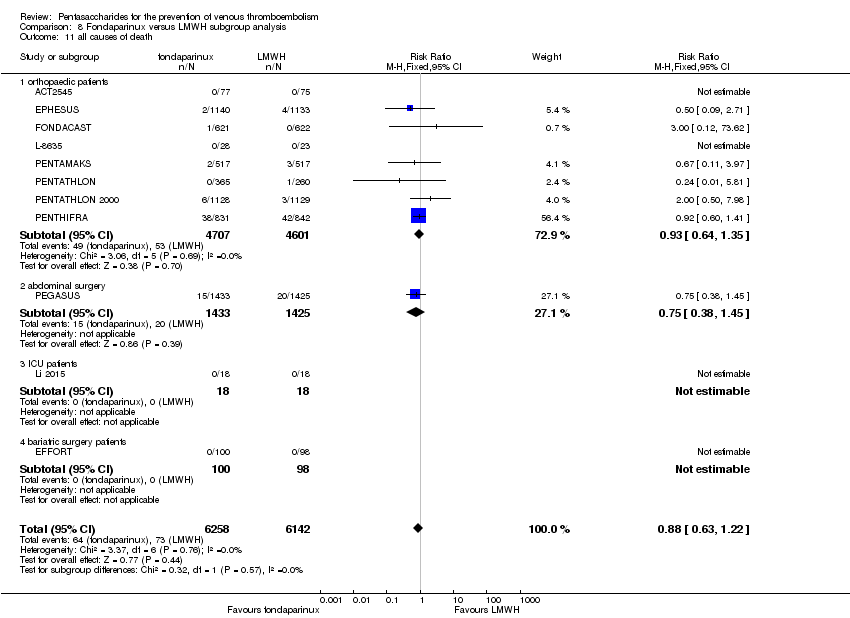
Comparison 8 Fondaparinux versus LMWH subgroup analysis, Outcome 11 all causes of death.
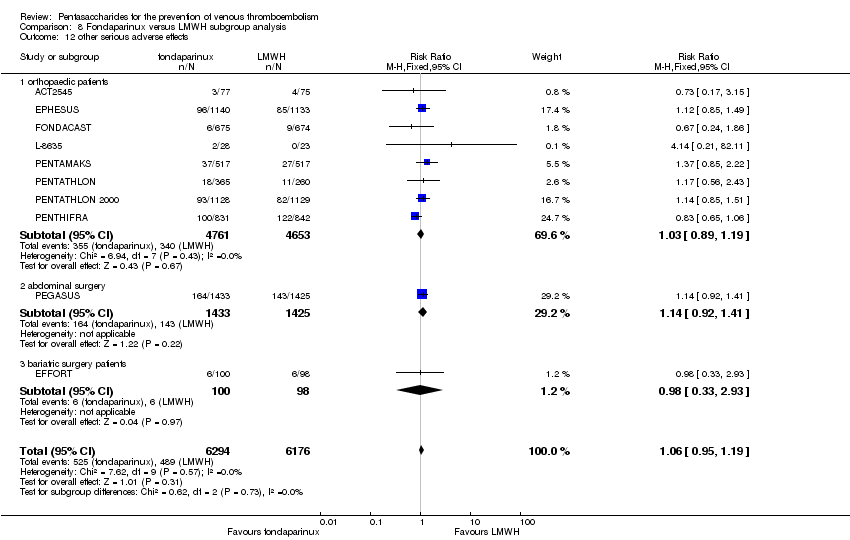
Comparison 8 Fondaparinux versus LMWH subgroup analysis, Outcome 12 other serious adverse effects.

Comparison 9 Fondaparinux versus variable dose warfarin, Outcome 1 total VTE.

Comparison 9 Fondaparinux versus variable dose warfarin, Outcome 2 symptomatic VTE.

Comparison 9 Fondaparinux versus variable dose warfarin, Outcome 3 total DVT.
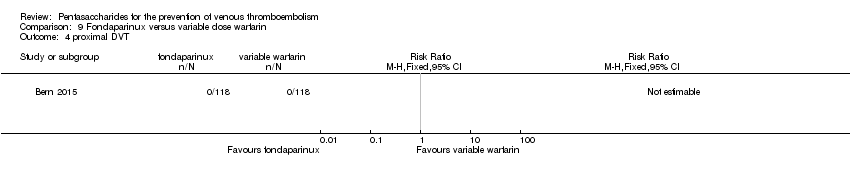
Comparison 9 Fondaparinux versus variable dose warfarin, Outcome 4 proximal DVT.

Comparison 9 Fondaparinux versus variable dose warfarin, Outcome 5 total PE.
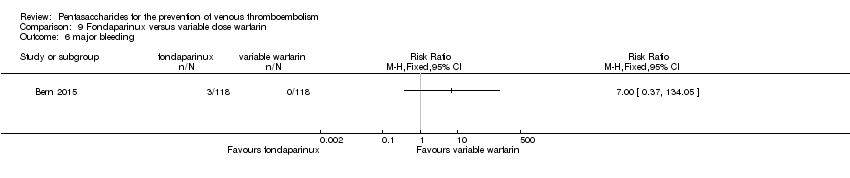
Comparison 9 Fondaparinux versus variable dose warfarin, Outcome 6 major bleeding.

Comparison 9 Fondaparinux versus variable dose warfarin, Outcome 7 all causes of death.

Comparison 10 Fondaparinux versus 1 mg warfarin, Outcome 1 total VTE.
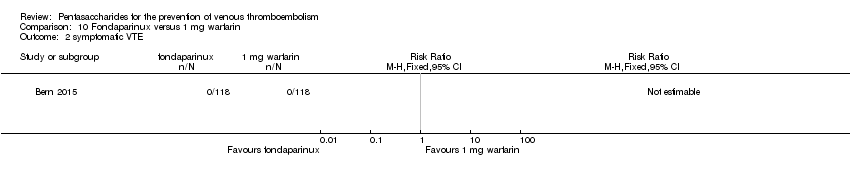
Comparison 10 Fondaparinux versus 1 mg warfarin, Outcome 2 symptomatic VTE.
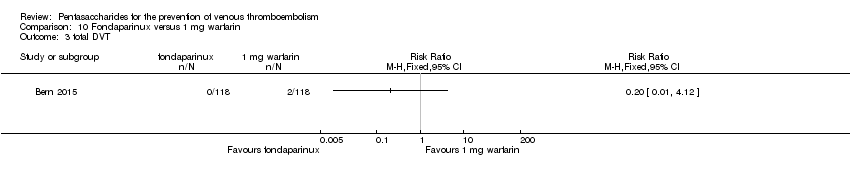
Comparison 10 Fondaparinux versus 1 mg warfarin, Outcome 3 total DVT.

Comparison 10 Fondaparinux versus 1 mg warfarin, Outcome 4 proximal DVT.

Comparison 10 Fondaparinux versus 1 mg warfarin, Outcome 5 total PE.
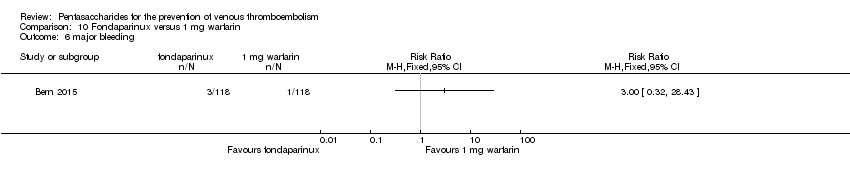
Comparison 10 Fondaparinux versus 1 mg warfarin, Outcome 6 major bleeding.

Comparison 10 Fondaparinux versus 1 mg warfarin, Outcome 7 all causes of death.
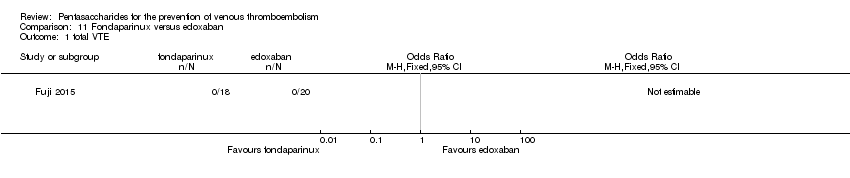
Comparison 11 Fondaparinux versus edoxaban, Outcome 1 total VTE.

Comparison 11 Fondaparinux versus edoxaban, Outcome 2 major bleeding.

Comparison 11 Fondaparinux versus edoxaban, Outcome 3 all causes of death.

Comparison 12 Fondaparinux versus mechanical thromboprophylaxis, Outcome 1 total VTE.

Comparison 12 Fondaparinux versus mechanical thromboprophylaxis, Outcome 2 symptomatic VTE.

Comparison 12 Fondaparinux versus mechanical thromboprophylaxis, Outcome 3 total DVT.

Comparison 12 Fondaparinux versus mechanical thromboprophylaxis, Outcome 4 proximal DVT.
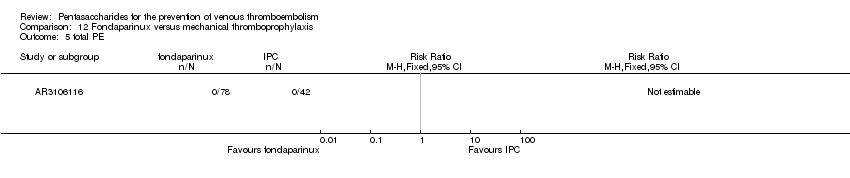
Comparison 12 Fondaparinux versus mechanical thromboprophylaxis, Outcome 5 total PE.

Comparison 12 Fondaparinux versus mechanical thromboprophylaxis, Outcome 6 major bleeding.
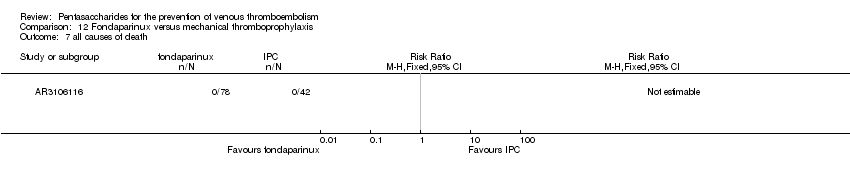
Comparison 12 Fondaparinux versus mechanical thromboprophylaxis, Outcome 7 all causes of death.

Comparison 12 Fondaparinux versus mechanical thromboprophylaxis, Outcome 8 other serious adverse effects.
| Fondaparinux versus placebo for the prevention of venous thromboembolism | ||||||
| Patient or population: people requiring prevention of venous thromboembolism | ||||||
| Outcomes | Illustrative comparative risks* (95% CI) | Relative effect | Number of participants | Quality of the evidence | Comments | |
| Assumed risk | Corresponding risk | |||||
| Placebo | Fondaparinux | |||||
| Total VTE | Study population | RR 0.24 | 5717 | ⊕⊕⊕⊝ | ||
| 91 per 1000 | 22 per 1000 | |||||
| Moderate | ||||||
| 181 per 1000 | 43 per 1000 | |||||
| Symptomatic VTE | Study population | RR 0.15 | 6503 | ⊕⊕⊕⊕ | ||
| 12 per 1000 | 2 per 1000 | |||||
| Moderate | ||||||
| 7 per 1000 | 1 per 1000 | |||||
| Total DVT | Study population | RR 0.25 | 5715 | ⊕⊕⊕⊝ | ||
| 87 per 1000 | 22 per 1000 | |||||
| Moderate | ||||||
| 173 per 1000 | 43 per 1000 | |||||
| Proximal DVT | Study population | RR 0.12 | 2746 | ⊕⊕⊕⊝ | ||
| 60 per 1000 | 7 per 1000 | |||||
| Moderate | ||||||
| 54 per 1000 | 6 per 1000 | |||||
| Total PE | Study population | RR 0.16 | 6412 | ⊕⊕⊕⊕ | ||
| 5 per 1000 | 1 per 1000 | |||||
| Moderate | ||||||
| 1 per 1000 | 0 per 1000 | |||||
| Major bleeding | Study population | RR 2.56 | 6659 | ⊕⊕⊕⊝ | ||
| 5 per 1000 | 12 per 1000 | |||||
| Moderate | ||||||
| 3 per 1000 | 8 per 1000 | |||||
| All causes of death | Study population | RR 0.76 | 6674 | ⊕⊕⊕⊝ | ||
| 12 per 1000 | 9 per 1000 | |||||
| Moderate | ||||||
| 0 per 1000 | 0 per 1000 | |||||
| *The basis for the assumed risk (e.g. median control group risk across studies) is provided in footnotes. The corresponding risk (and its 95% confidence interval) is based on the assumed risk in the comparison group and the relative effect of the intervention (and its 95% CI). | ||||||
| GRADE Working Group grades of evidence | ||||||
| 1 Data were pooled with a random‐effects model owing to heterogeneity ‐ downgraded by one level. | ||||||
| Fondaparinux versus LMWH for the prevention of venous thromboembolism | ||||||
| Patient or population: people requiring prevention of venous thromboembolism | ||||||
| Outcomes | Illustrative comparative risks* (95% CI) | Relative effect | Number of participants | Quality of the evidence | Comments | |
| Assumed risk | Corresponding risk | |||||
| LMWH | Fondaparinux | |||||
| Total VTE | Study population | RR 0.55 | 9339 | ⊕⊕⊕⊝ | ||
| 108 per 1000 | 60 per 1000 | |||||
| Moderate | ||||||
| 83 per 1000 | 46 per 1000 | |||||
| Symptomatic VTE | Study population | RR 1.03 | 12240 | ⊕⊕⊕⊝ | ||
| 6 per 1000 | 6 per 1000 | |||||
| Moderate | ||||||
| 3 per 1000 | 3 per 1000 | |||||
| Total DVT | Study population | RR 0.54 | 9356 | ⊕⊕⊕⊝ | ||
| 106 per 1000 | 57 per 1000 | |||||
| Moderate | ||||||
| 86 per 1000 | 46 per 1000 | |||||
| Proximal DVT | Study population | RR 0.58 | 8361 | ⊕⊕⊝⊝ | ||
| 23 per 1000 | 13 per 1000 | |||||
| Moderate | ||||||
| 25 per 1000 | 14 per 1000 | |||||
| Total PE | Study population | RR 1.24 | 12350 | ⊕⊕⊕⊝ | ||
| 3 per 1000 | 3 per 1000 | |||||
| Moderate | ||||||
| 1 per 1000 | 1 per 1000 | |||||
| Major bleeding | Study population | RR 1.38 | 12501 | ⊕⊕⊕⊕ | ||
| 18 per 1000 | 25 per 1000 | |||||
| Moderate | ||||||
| 23 per 1000 | 32 per 1000 | |||||
| All causes of death | Study population | RR 0.88 | 12400 | ⊕⊕⊕⊝ | ||
| 12 per 1000 | 10 per 1000 | |||||
| Moderate | ||||||
| 3 per 1000 | 3 per 1000 | |||||
| *The basis for the assumed risk (e.g. median control group risk across studies) is provided in footnotes. The corresponding risk (and its 95% confidence interval) is based on the assumed risk in the comparison group and the relative effect of the intervention (and its 95% CI). | ||||||
| GRADE Working Group grades of evidence | ||||||
| 1 Data were pooled with the random‐effects model because of heterogeneity ‐ downgraded by one level. | ||||||
| Fondaparinux versus variable dose warfarin for the prevention of venous thromboembolism | ||||||
| Patient or population: patients requiring prevention of venous thromboembolism | ||||||
| Outcomes | Illustrative comparative risks* (95% CI) | Relative effect | Number of participants | Quality of the evidence | Comments | |
| Assumed risk | Corresponding risk | |||||
| Variable dose warfarin | Fondaparinux | |||||
| Total VTE | See comment | See comment | Not estimable | 236 | ⊕⊝⊝⊝ | No VTE events recorded |
| Symptomatic VTE | See comment | See comment | Not estimable | 236 | ⊕⊝⊝⊝ | No VTE events recorded |
| Total DVT | See comment | See comment | Not estimable | 236 | ⊕⊝⊝⊝ | No DVT events recorded |
| Proximal DVT | See comment | See comment | Not estimable | 236 | ⊕⊝⊝⊝ | No proximal DVT events recorded |
| Total PE | See comment | See comment | Not estimable | 236 | ⊕⊝⊝⊝ | No PE events recorded |
| Major bleeding | Study population | RR 7 | 236 | ⊕⊝⊝⊝ | ||
| No cases of bleeding (0/118) were reported in the variable warfarin group. Three cases (3/118) of bleeding were reported in the fondaparinux group. | ||||||
| All causes of death | See comment | See comment | Not estimable | 236 | ⊕⊝⊝⊝ | No deaths recorded |
| *The basis for the assumed risk (e.g. median control group risk across studies) is provided in footnotes. The corresponding risk (and its 95% confidence interval) is based on the assumed risk in the comparison group and the relative effect of the intervention (and its 95% CI). | ||||||
| GRADE Working Group grades of evidence | ||||||
| 1 One study was included in this comparison; the study sample was small, and the events were rare ‐ downgraded by three levels. | ||||||
| Fondaparinux versus 1 mg warfarin for the prevention of venous thromboembolism | ||||||
| Patient or population: people requiring prevention of venous thromboembolism | ||||||
| Outcomes | Illustrative comparative risks* (95% CI) | Relative effect | Number of participants | Quality of the evidence | Comments | |
| Assumed risk | Corresponding risk | |||||
| 1 mg warfarin | Fondaparinux | |||||
| Total VTE | Study population | RR 0.2 | 236 | ⊕⊝⊝⊝ | ||
| 17 per 1000 | 3 per 1000 | |||||
| Moderate | ||||||
| 17 per 1000 | 3 per 1000 | |||||
| Symptomatic VTE | See comment | See comment | Not estimable | 236 | ⊕⊝⊝⊝ | No systematic VTE events recorded |
| Total DVT | Study population | RR 0.2 | 236 | ⊕⊝⊝⊝ | ||
| 17 per 1000 | 3 per 1000 | |||||
| Moderate | ||||||
| 17 per 1000 | 3 per 1000 | |||||
| Proximal DVT | See comment | See comment | Not estimable | 236 | ⊕⊝⊝⊝ | No proximal DVT events recorded |
| Total PE | See comment | See comment | Not estimable | 236 | ⊕⊝⊝⊝ | No PE events recorded |
| Major bleeding | Study population | RR 3 | 236 | ⊕⊝⊝⊝ | ||
| 8 per 1000 | 25 per 1000 | |||||
| Moderate | ||||||
| 9 per 1000 | 27 per 1000 | |||||
| All causes of death | See comment | See comment | Not estimable | 236 | ⊕⊝⊝⊝ | No deaths recorded |
| *The basis for the assumed risk (e.g. median control group risk across studies) is provided in footnotes. The corresponding risk (and its 95% confidence interval) is based on the assumed risk in the comparison group and the relative effect of the intervention (and its 95% CI). | ||||||
| GRADE Working Group grades of evidence | ||||||
| 1 One study was included in this comparison; the study sample was small, and the events were rare ‐ downgraded by three levels. | ||||||
| Fondaparinux versus edoxaban for the prevention of venous thromboembolism | ||||||
| Patient or population: people requiring prevention of venous thromboembolism | ||||||
| Outcomes | Illustrative comparative risks* (95% CI) | Relative effect | Number of participants | Quality of the evidence | Comments | |
| Assumed risk | Corresponding risk | |||||
| Edoxaban | Fondaparinux | |||||
| Total VTE | See comment | See comment | Not estimable | 38 | ⊕⊝⊝⊝ | No VTE events recorded |
| Symptomatic VTE | See comment | See comment | Not estimable | 38 | ⊕⊝⊝⊝ | No VTE events recorded |
| Total DVT | See comment | See comment | Not estimable | 38 | ⊕⊝⊝⊝ | No DVT events recorded |
| Proximal DVT | See comment | See comment | 38 | Proximal DVT not an outcome of this study | ||
| Total PE | See comment | See comment | Not estimable | 38 | ⊕⊝⊝⊝ | No PE events recorded |
| Major bleeding | See comment | See comment | Not estimable | 38 | ⊕⊝⊝⊝ | No major bleeding events recorded |
| All causes of death | See comment | See comment | Not estimable | 38 | ⊕⊝⊝⊝ | No deaths recorded |
| *The basis for the assumed risk (e.g. median control group risk across studies) is provided in footnotes. The corresponding risk (and its 95% confidence interval) is based on the assumed risk in the comparison group and the relative effect of the intervention (and its 95% CI). | ||||||
| GRADE Working Group grades of evidence | ||||||
| 1 One study was included in this comparison; the study sample was small, and no events were recorded ‐ downgraded by three levels. | ||||||
| Fondaparinux versus mechanical thromboprophylaxis for the prevention of venous thromboembolism | ||||||
| Patient or population: people requiring prevention of venous thromboembolism | ||||||
| Outcomes | Illustrative comparative risks* (95% CI) | Relative effect | Number of participants | Quality of the evidence | Comments | |
| Assumed risk | Corresponding risk | |||||
| Mechanical thromboprophylaxis | Fondaparinux | |||||
| Total VTE | Study population | RR 0.61 | 99 | ⊕⊕⊝⊝ | ||
| 176 per 1000 | 108 per 1000 | |||||
| Moderate | ||||||
| 177 per 1000 | 108 per 1000 | |||||
| Symptomatic VTE | See comment | See comment | Not estimable | 120 | ⊕⊕⊝⊝ | No cases of symptomatic VTE recorded |
| Total DVT | Study population | RR 0.63 | 100 | ⊕⊕⊝⊝ | ||
| 171 per 1000 | 108 per 1000 | |||||
| Moderate | ||||||
| 171 per 1000 | 108 per 1000 | |||||
| Proximal DVT | See comment | See comment | Not estimable | 105 | ⊕⊕⊝⊝ | No cases of proximal DVT recorded |
| Total PE | See comment | See comment | Not estimable | 120 | ⊕⊕⊝⊝ | No cases of PE recorded |
| Major bleeding | See comment | See comment | Not estimable | 120 | ⊕⊕⊝⊝ | No cases of major bleeding recorded |
| All causes of death | See comment | See comment | Not estimable | 120 | ⊕⊕⊝⊝ | No deaths recorded |
| *The basis for the assumed risk (e.g. median control group risk across studies) is provided in footnotes. The corresponding risk (and its 95% confidence interval) is based on the assumed risk in the comparison group and the relative effect of the intervention (and its 95% CI). | ||||||
| GRADE Working Group grades of evidence | ||||||
| 1 One study included in this comparison, small study sample, funded by pharmaceutical company, very short follow‐up ‐ downgraded by two levels. | ||||||
| Outcome or subgroup title | No. of studies | No. of participants | Statistical method | Effect size |
| 1 total VTE Show forest plot | 8 | 5717 | Risk Ratio (M‐H, Random, 95% CI) | 0.24 [0.15, 0.38] |
| 2 symptomatic VTE Show forest plot | 8 | 6503 | Risk Ratio (M‐H, Fixed, 95% CI) | 0.15 [0.06, 0.36] |
| 3 total DVT Show forest plot | 8 | 5715 | Risk Ratio (M‐H, Random, 95% CI) | 0.25 [0.15, 0.40] |
| 4 proximal DVT Show forest plot | 7 | 2746 | Risk Ratio (M‐H, Random, 95% CI) | 0.12 [0.04, 0.39] |
| 5 total PE Show forest plot | 8 | 6412 | Risk Ratio (M‐H, Fixed, 95% CI) | 0.16 [0.04, 0.62] |
| 6 fatal PE Show forest plot | 8 | 6412 | Risk Ratio (M‐H, Fixed, 95% CI) | 0.14 [0.02, 1.17] |
| 7 non‐fatal PE Show forest plot | 8 | 6412 | Risk Ratio (M‐H, Fixed, 95% CI) | 0.22 [0.05, 1.03] |
| 8 major bleeding Show forest plot | 8 | 6659 | Risk Ratio (M‐H, Fixed, 95% CI) | 2.56 [1.48, 4.44] |
| 9 fatal bleeding Show forest plot | 6 | 5993 | Risk Ratio (M‐H, Fixed, 95% CI) | 4.87 [0.58, 40.81] |
| 10 MI Show forest plot | 5 | 5777 | Risk Ratio (M‐H, Fixed, 95% CI) | 0.25 [0.03, 2.19] |
| 11 all causes of death Show forest plot | 8 | 6674 | Risk Ratio (M‐H, Fixed, 95% CI) | 0.76 [0.48, 1.22] |
| 12 other serious adverse effects Show forest plot | 7 | 6581 | Risk Ratio (M‐H, Fixed, 95% CI) | 0.98 [0.77, 1.24] |
| Outcome or subgroup title | No. of studies | No. of participants | Statistical method | Effect size |
| 1 total VTE Show forest plot | 9 | 5884 | Risk Ratio (M‐H, Random, 95% CI) | 0.27 [0.17, 0.43] |
| 2 symptomatic VTE Show forest plot | 9 | 6670 | Risk Ratio (M‐H, Fixed, 95% CI) | 0.19 [0.09, 0.42] |
| 3 total DVT Show forest plot | 9 | 5882 | Risk Ratio (M‐H, Random, 95% CI) | 0.28 [0.17, 0.45] |
| 4 proximal DVT Show forest plot | 8 | 2913 | Risk Ratio (M‐H, Random, 95% CI) | 0.16 [0.05, 0.51] |
| 5 total PE Show forest plot | 9 | 6579 | Risk Ratio (M‐H, Fixed, 95% CI) | 0.16 [0.04, 0.62] |
| 6 fatal PE Show forest plot | 9 | 6579 | Risk Ratio (M‐H, Fixed, 95% CI) | 0.14 [0.02, 1.17] |
| 7 non‐fatal PE Show forest plot | 9 | 6579 | Risk Ratio (M‐H, Fixed, 95% CI) | 0.22 [0.05, 1.03] |
| 8 major bleeding Show forest plot | 9 | 6829 | Risk Ratio (M‐H, Fixed, 95% CI) | 2.56 [1.48, 4.44] |
| 9 fatal bleeding Show forest plot | 7 | 6163 | Risk Ratio (M‐H, Fixed, 95% CI) | 4.87 [0.58, 40.81] |
| 10 all causes of death Show forest plot | 8 | 6766 | Risk Ratio (M‐H, Fixed, 95% CI) | 0.76 [0.48, 1.22] |
| Outcome or subgroup title | No. of studies | No. of participants | Statistical method | Effect size |
| 1 total VTE Show forest plot | 7 | 2715 | Risk Ratio (M‐H, Random, 95% CI) | 0.25 [0.15, 0.40] |
| 2 symptomatic VTE Show forest plot | 7 | 3501 | Risk Ratio (M‐H, Fixed, 95% CI) | 0.16 [0.05, 0.54] |
| 3 total DVT Show forest plot | 7 | 2713 | Risk Ratio (M‐H, Random, 95% CI) | 0.25 [0.15, 0.43] |
| 4 proximal DVT Show forest plot | 7 | 2746 | Risk Ratio (M‐H, Random, 95% CI) | 0.12 [0.04, 0.39] |
| 5 total PE Show forest plot | 7 | 3412 | Risk Ratio (M‐H, Fixed, 95% CI) | 0.20 [0.04, 0.92] |
| 6 fatal PE Show forest plot | 7 | 3410 | Risk Ratio (M‐H, Fixed, 95% CI) | 0.14 [0.02, 1.17] |
| 7 non‐fatal PE Show forest plot | 7 | 3410 | Risk Ratio (M‐H, Fixed, 95% CI) | 0.43 [0.06, 2.93] |
| 8 major bleeding Show forest plot | 7 | 3672 | Risk Ratio (M‐H, Fixed, 95% CI) | 2.66 [1.52, 4.67] |
| 9 fatal bleeding Show forest plot | 5 | 3006 | Risk Ratio (M‐H, Fixed, 95% CI) | 4.87 [0.58, 40.81] |
| 10 MI Show forest plot | 4 | 2790 | Risk Ratio (M‐H, Fixed, 95% CI) | 0.19 [0.01, 4.05] |
| 11 all causes of death Show forest plot | 7 | 3672 | Risk Ratio (M‐H, Fixed, 95% CI) | 0.73 [0.45, 1.18] |
| 12 other serious adverse effects Show forest plot | 6 | 3594 | Risk Ratio (M‐H, Fixed, 95% CI) | 1.03 [0.80, 1.32] |
| Outcome or subgroup title | No. of studies | No. of participants | Statistical method | Effect size |
| 1 total VTE Show forest plot | 8 | 5717 | Risk Ratio (M‐H, Random, 95% CI) | 0.24 [0.15, 0.38] |
| 1.1 surgery patients | 6 | 2071 | Risk Ratio (M‐H, Random, 95% CI) | 0.21 [0.13, 0.35] |
| 1.2 superficial thrombophlebitis | 1 | 3002 | Risk Ratio (M‐H, Random, 95% CI) | 0.15 [0.04, 0.50] |
| 1.3 medically ill patients | 1 | 644 | Risk Ratio (M‐H, Random, 95% CI) | 0.53 [0.31, 0.92] |
| 2 symptomatic VTE Show forest plot | 8 | 6503 | Risk Ratio (M‐H, Fixed, 95% CI) | 0.15 [0.06, 0.36] |
| 2.1 surgery patients | 6 | 2857 | Risk Ratio (M‐H, Fixed, 95% CI) | 0.19 [0.05, 0.73] |
| 2.2 superficial thrombophlebitis | 1 | 3002 | Risk Ratio (M‐H, Fixed, 95% CI) | 0.15 [0.04, 0.50] |
| 2.3 medically ill patients | 1 | 644 | Risk Ratio (M‐H, Fixed, 95% CI) | 0.09 [0.01, 1.65] |
| 3 total DVT Show forest plot | 8 | 5715 | Risk Ratio (M‐H, Random, 95% CI) | 0.25 [0.15, 0.40] |
| 3.1 surgery patients | 6 | 2069 | Risk Ratio (M‐H, Random, 95% CI) | 0.21 [0.13, 0.35] |
| 3.2 superficial thrombophlebitis | 1 | 3002 | Risk Ratio (M‐H, Random, 95% CI) | 0.17 [0.05, 0.56] |
| 3.3 medically ill patients | 1 | 644 | Risk Ratio (M‐H, Random, 95% CI) | 0.62 [0.35, 1.10] |
| 4 proximal DVT Show forest plot | 7 | 2745 | Risk Ratio (M‐H, Fixed, 95% CI) | 0.12 [0.07, 0.22] |
| 4.1 surgery patients | 6 | 2101 | Risk Ratio (M‐H, Fixed, 95% CI) | 0.07 [0.03, 0.15] |
| 4.2 medically ill patients | 1 | 644 | Risk Ratio (M‐H, Fixed, 95% CI) | 0.72 [0.23, 2.24] |
| 5 total PE Show forest plot | 8 | 6412 | Risk Ratio (M‐H, Fixed, 95% CI) | 0.16 [0.04, 0.62] |
| 5.1 surgery patients | 6 | 2766 | Risk Ratio (M‐H, Fixed, 95% CI) | 0.34 [0.05, 2.14] |
| 5.2 superficial thrombophlebitis | 1 | 3002 | Risk Ratio (M‐H, Fixed, 95% CI) | 0.09 [0.01, 1.64] |
| 5.3 medically ill patients | 1 | 644 | Risk Ratio (M‐H, Fixed, 95% CI) | 0.09 [0.01, 1.65] |
| 6 fatal PE Show forest plot | 8 | 6412 | Risk Ratio (M‐H, Fixed, 95% CI) | 0.14 [0.02, 1.17] |
| 6.1 surgery patients | 6 | 2766 | Risk Ratio (M‐H, Fixed, 95% CI) | 0.34 [0.01, 8.25] |
| 6.2 superficial thrombophlebitis | 1 | 3002 | Risk Ratio (M‐H, Fixed, 95% CI) | 0.0 [0.0, 0.0] |
| 6.3 medically ill patients | 1 | 644 | Risk Ratio (M‐H, Fixed, 95% CI) | 0.09 [0.01, 1.65] |
| 7 non‐fatal PE Show forest plot | 8 | 6412 | Risk Ratio (M‐H, Fixed, 95% CI) | 0.22 [0.05, 1.03] |
| 7.1 surgery patients | 6 | 2766 | Risk Ratio (M‐H, Fixed, 95% CI) | 0.43 [0.06, 2.93] |
| 7.2 superficial thrombophlebitis | 1 | 3002 | Risk Ratio (M‐H, Fixed, 95% CI) | 0.09 [0.01, 1.64] |
| 7.3 medically ill patients | 1 | 644 | Risk Ratio (M‐H, Fixed, 95% CI) | 0.0 [0.0, 0.0] |
| 8 major bleeding Show forest plot | 8 | 6659 | Risk Ratio (M‐H, Fixed, 95% CI) | 2.56 [1.48, 4.44] |
| 8.1 surgery patients | 6 | 2833 | Risk Ratio (M‐H, Fixed, 95% CI) | 2.78 [1.56, 4.95] |
| 8.2 superficial thrombophlebitis | 1 | 2987 | Risk Ratio (M‐H, Fixed, 95% CI) | 0.99 [0.06, 15.86] |
| 8.3 medically ill patients | 1 | 839 | Risk Ratio (M‐H, Fixed, 95% CI) | 0.97 [0.06, 15.52] |
| 9 fatal bleeding Show forest plot | 6 | 5993 | Risk Ratio (M‐H, Fixed, 95% CI) | 4.87 [0.58, 40.81] |
| 9.1 surgery patients | 4 | 2167 | Risk Ratio (M‐H, Fixed, 95% CI) | 4.87 [0.58, 40.81] |
| 9.2 superficial thrombophlebitis | 1 | 2987 | Risk Ratio (M‐H, Fixed, 95% CI) | 0.0 [0.0, 0.0] |
| 9.3 medically ill patients | 1 | 839 | Risk Ratio (M‐H, Fixed, 95% CI) | 0.0 [0.0, 0.0] |
| 10 MI Show forest plot | 5 | 5777 | Risk Ratio (M‐H, Fixed, 95% CI) | 0.25 [0.03, 2.19] |
| 10.1 surgery patients | 3 | 1951 | Risk Ratio (M‐H, Fixed, 95% CI) | 0.0 [0.0, 0.0] |
| 10.2 superficial thrombophlebitis | 1 | 2987 | Risk Ratio (M‐H, Fixed, 95% CI) | 0.33 [0.01, 8.12] |
| 10.3 medically ill patients | 1 | 839 | Risk Ratio (M‐H, Fixed, 95% CI) | 0.19 [0.01, 4.05] |
| 11 all causes of death Show forest plot | 8 | 6674 | Risk Ratio (M‐H, Fixed, 95% CI) | 0.76 [0.48, 1.22] |
| 11.1 surgery patients | 6 | 2833 | Risk Ratio (M‐H, Fixed, 95% CI) | 1.09 [0.52, 2.31] |
| 11.2 superficial thrombophlebitis | 1 | 3002 | Risk Ratio (M‐H, Fixed, 95% CI) | 2.00 [0.18, 22.00] |
| 11.3 medically ill patients | 1 | 839 | Risk Ratio (M‐H, Fixed, 95% CI) | 0.55 [0.29, 1.03] |
| 12 other serious adverse effects Show forest plot | 7 | 6581 | Risk Ratio (M‐H, Fixed, 95% CI) | 0.98 [0.77, 1.24] |
| 12.1 surgery patients | 5 | 2755 | Risk Ratio (M‐H, Fixed, 95% CI) | 1.05 [0.80, 1.38] |
| 12.2 superficial thrombophlebitis | 1 | 2987 | Risk Ratio (M‐H, Fixed, 95% CI) | 0.62 [0.28, 1.36] |
| 12.3 medically ill patients | 1 | 839 | Risk Ratio (M‐H, Fixed, 95% CI) | 0.93 [0.51, 1.69] |
| Outcome or subgroup title | No. of studies | No. of participants | Statistical method | Effect size |
| 1 total VTE Show forest plot | 11 | 9339 | Risk Ratio (M‐H, Random, 95% CI) | 0.55 [0.42, 0.73] |
| 2 symptomatic VTE Show forest plot | 9 | 12240 | Risk Ratio (M‐H, Fixed, 95% CI) | 1.03 [0.65, 1.63] |
| 3 total DVT Show forest plot | 10 | 9356 | Risk Ratio (M‐H, Random, 95% CI) | 0.54 [0.40, 0.71] |
| 4 proximal DVT Show forest plot | 9 | 8361 | Risk Ratio (M‐H, Random, 95% CI) | 0.58 [0.33, 1.02] |
| 5 total PE Show forest plot | 10 | 12350 | Risk Ratio (M‐H, Fixed, 95% CI) | 1.24 [0.65, 2.34] |
| 6 fatal PE Show forest plot | 9 | 11107 | Risk Ratio (M‐H, Fixed, 95% CI) | 0.72 [0.25, 2.05] |
| 7 non‐fatal PE Show forest plot | 9 | 11107 | Risk Ratio (M‐H, Fixed, 95% CI) | 1.40 [0.63, 3.11] |
| 8 major bleeding Show forest plot | 11 | 12501 | Risk Ratio (M‐H, Fixed, 95% CI) | 1.38 [1.09, 1.75] |
| 9 fatal bleeding Show forest plot | 6 | 10293 | Risk Ratio (M‐H, Fixed, 95% CI) | 0.71 [0.14, 3.62] |
| 10 MI Show forest plot | 6 | 10720 | Risk Ratio (M‐H, Fixed, 95% CI) | 1.28 [0.69, 2.37] |
| 11 all causes of death Show forest plot | 11 | 12400 | Risk Ratio (M‐H, Fixed, 95% CI) | 0.88 [0.63, 1.22] |
| 12 death associated with VTE or bleeding Show forest plot | 5 | 4774 | Risk Ratio (M‐H, Fixed, 95% CI) | 0.89 [0.38, 2.07] |
| 13 other serious adverse effects Show forest plot | 10 | 12465 | Risk Ratio (M‐H, Fixed, 95% CI) | 1.06 [0.94, 1.19] |
| Outcome or subgroup title | No. of studies | No. of participants | Statistical method | Effect size |
| 1 total VTE Show forest plot | 13 | 9709 | Risk Ratio (M‐H, Random, 95% CI) | 0.57 [0.43, 0.74] |
| 2 symptomatic VTE Show forest plot | 11 | 12569 | Risk Ratio (M‐H, Fixed, 95% CI) | 1.08 [0.69, 1.70] |
| 3 total DVT Show forest plot | 12 | 9726 | Risk Ratio (M‐H, Random, 95% CI) | 0.55 [0.42, 0.72] |
| 4 proximal DVT Show forest plot | 10 | 8528 | Risk Ratio (M‐H, Random, 95% CI) | 0.61 [0.35, 1.06] |
| 5 total PE Show forest plot | 12 | 12720 | Risk Ratio (M‐H, Fixed, 95% CI) | 1.24 [0.65, 2.34] |
| 6 fatal PE Show forest plot | 11 | 11477 | Risk Ratio (M‐H, Fixed, 95% CI) | 0.72 [0.25, 2.05] |
| 7 non‐fatal PE Show forest plot | 11 | 11486 | Risk Ratio (M‐H, Fixed, 95% CI) | 1.40 [0.63, 3.11] |
| 8 major bleeding Show forest plot | 13 | 12874 | Risk Ratio (M‐H, Fixed, 95% CI) | 1.34 [1.06, 1.68] |
| 9 fatal bleeding Show forest plot | 8 | 10499 | Risk Ratio (M‐H, Fixed, 95% CI) | 0.71 [0.14, 3.62] |
| 10 all causes of death Show forest plot | 12 | 12603 | Risk Ratio (M‐H, Fixed, 95% CI) | 0.88 [0.63, 1.22] |
| 11 other serious adverse effects Show forest plot | 11 | 12707 | Risk Ratio (M‐H, Fixed, 95% CI) | 1.06 [0.95, 1.20] |
| Outcome or subgroup title | No. of studies | No. of participants | Statistical method | Effect size |
| 1 total VTE Show forest plot | 10 | 9141 | Risk Ratio (M‐H, Random, 95% CI) | 0.55 [0.41, 0.73] |
| 2 symptomatic VTE Show forest plot | 8 | 12042 | Risk Ratio (M‐H, Fixed, 95% CI) | 1.03 [0.65, 1.63] |
| 3 total DVT Show forest plot | 9 | 9158 | Risk Ratio (M‐H, Random, 95% CI) | 0.53 [0.40, 0.71] |
| 4 proximal DVT Show forest plot | 8 | 8163 | Risk Ratio (M‐H, Random, 95% CI) | 0.56 [0.31, 1.03] |
| 5 total PE Show forest plot | 9 | 12152 | Risk Ratio (M‐H, Fixed, 95% CI) | 1.24 [0.65, 2.34] |
| 6 fatal PE Show forest plot | 8 | 10909 | Risk Ratio (M‐H, Fixed, 95% CI) | 0.72 [0.25, 2.05] |
| 7 non‐fatal PE Show forest plot | 8 | 10909 | Risk Ratio (M‐H, Fixed, 95% CI) | 1.40 [0.63, 3.11] |
| 8 major bleeding Show forest plot | 10 | 12303 | Risk Ratio (M‐H, Fixed, 95% CI) | 1.38 [1.09, 1.75] |
| 9 fatal bleeding Show forest plot | 5 | 10095 | Risk Ratio (M‐H, Fixed, 95% CI) | 0.71 [0.14, 3.62] |
| 10 MI Show forest plot | 6 | 10720 | Risk Ratio (M‐H, Fixed, 95% CI) | 1.28 [0.69, 2.37] |
| 11 all causes of death Show forest plot | 10 | 12202 | Risk Ratio (M‐H, Fixed, 95% CI) | 0.88 [0.63, 1.22] |
| 12 death associated with VTE or bleeding Show forest plot | 5 | 4774 | Risk Ratio (M‐H, Fixed, 95% CI) | 0.89 [0.38, 2.07] |
| 13 other serious adverse effects Show forest plot | 9 | 12267 | Risk Ratio (M‐H, Fixed, 95% CI) | 1.06 [0.95, 1.20] |
| Outcome or subgroup title | No. of studies | No. of participants | Statistical method | Effect size |
| 1 total VTE Show forest plot | 11 | 9339 | Risk Ratio (M‐H, Random, 95% CI) | 0.55 [0.42, 0.73] |
| 1.1 orthopaedic patients | 8 | 7057 | Risk Ratio (M‐H, Random, 95% CI) | 0.52 [0.38, 0.70] |
| 1.2 abdominal surgery | 1 | 2048 | Risk Ratio (M‐H, Random, 95% CI) | 0.75 [0.52, 1.09] |
| 1.3 ICU patients | 1 | 36 | Risk Ratio (M‐H, Random, 95% CI) | 0.0 [0.0, 0.0] |
| 1.4 bariatric surgery patients | 1 | 198 | Risk Ratio (M‐H, Random, 95% CI) | 0.98 [0.14, 6.82] |
| 2 symptomatic VTE Show forest plot | 9 | 12240 | Risk Ratio (M‐H, Fixed, 95% CI) | 1.03 [0.65, 1.63] |
| 2.1 orthopaedic patients | 6 | 9079 | Risk Ratio (M‐H, Fixed, 95% CI) | 1.00 [0.61, 1.65] |
| 2.2 abdominal surgery | 1 | 2927 | Risk Ratio (M‐H, Fixed, 95% CI) | 1.20 [0.37, 3.92] |
| 2.3 ICU patients | 1 | 36 | Risk Ratio (M‐H, Fixed, 95% CI) | 0.0 [0.0, 0.0] |
| 2.4 bariatric surgery patients | 1 | 198 | Risk Ratio (M‐H, Fixed, 95% CI) | 0.0 [0.0, 0.0] |
| 3 total DVT Show forest plot | 10 | 9356 | Risk Ratio (M‐H, Random, 95% CI) | 0.54 [0.40, 0.71] |
| 3.1 orthopaedic patients | 7 | 7080 | Risk Ratio (M‐H, Random, 95% CI) | 0.50 [0.37, 0.69] |
| 3.2 abdominal surgery | 1 | 2042 | Risk Ratio (M‐H, Random, 95% CI) | 0.72 [0.49, 1.06] |
| 3.3 ICU patients | 1 | 36 | Risk Ratio (M‐H, Random, 95% CI) | 0.0 [0.0, 0.0] |
| 3.4 bariatric surgery patients | 1 | 198 | Risk Ratio (M‐H, Random, 95% CI) | 0.98 [0.14, 6.82] |
| 4 proximal DVT Show forest plot | 9 | 8361 | Risk Ratio (M‐H, Random, 95% CI) | 0.58 [0.33, 1.02] |
| 4.1 orthopaedic patients | 6 | 5974 | Risk Ratio (M‐H, Random, 95% CI) | 0.52 [0.26, 1.02] |
| 4.2 abdominal surgery | 1 | 2153 | Risk Ratio (M‐H, Random, 95% CI) | 1.00 [0.29, 3.45] |
| 4.3 ICU patients | 1 | 36 | Risk Ratio (M‐H, Random, 95% CI) | 0.0 [0.0, 0.0] |
| 4.4 bariatric surgery patients | 1 | 198 | Risk Ratio (M‐H, Random, 95% CI) | 0.98 [0.14, 6.82] |
| 5 total PE Show forest plot | 10 | 12350 | Risk Ratio (M‐H, Fixed, 95% CI) | 1.24 [0.65, 2.34] |
| 5.1 orthopaedic patients | 7 | 9189 | Risk Ratio (M‐H, Fixed, 95% CI) | 1.14 [0.56, 2.34] |
| 5.2 abdominal surgery | 1 | 2927 | Risk Ratio (M‐H, Fixed, 95% CI) | 1.66 [0.40, 6.95] |
| 5.3 ICU patients | 1 | 36 | Risk Ratio (M‐H, Fixed, 95% CI) | 0.0 [0.0, 0.0] |
| 5.4 bariatric surgery patients | 1 | 198 | Risk Ratio (M‐H, Fixed, 95% CI) | 0.0 [0.0, 0.0] |
| 6 fatal PE Show forest plot | 9 | 11107 | Risk Ratio (M‐H, Fixed, 95% CI) | 0.72 [0.25, 2.05] |
| 6.1 orthopaedic patients | 6 | 7946 | Risk Ratio (M‐H, Fixed, 95% CI) | 0.56 [0.14, 2.29] |
| 6.2 abdominal surgery | 1 | 2927 | Risk Ratio (M‐H, Fixed, 95% CI) | 1.00 [0.20, 4.94] |
| 6.3 ICU patients | 1 | 36 | Risk Ratio (M‐H, Fixed, 95% CI) | 0.0 [0.0, 0.0] |
| 6.4 bariatric surgery patients | 1 | 198 | Risk Ratio (M‐H, Fixed, 95% CI) | 0.0 [0.0, 0.0] |
| 7 non‐fatal PE Show forest plot | 9 | 11107 | Risk Ratio (M‐H, Fixed, 95% CI) | 1.40 [0.63, 3.11] |
| 7.1 orthopaedic patients | 6 | 7946 | Risk Ratio (M‐H, Fixed, 95% CI) | 1.22 [0.53, 2.83] |
| 7.2 abdominal surgery | 1 | 2927 | Risk Ratio (M‐H, Fixed, 95% CI) | 4.99 [0.24, 103.84] |
| 7.3 ICU patients | 1 | 36 | Risk Ratio (M‐H, Fixed, 95% CI) | 0.0 [0.0, 0.0] |
| 7.4 bariatric surgery | 1 | 198 | Risk Ratio (M‐H, Fixed, 95% CI) | 0.0 [0.0, 0.0] |
| 8 major bleeding Show forest plot | 11 | 12501 | Risk Ratio (M‐H, Fixed, 95% CI) | 1.38 [1.09, 1.75] |
| 8.1 orthopaedic patients | 8 | 9409 | Risk Ratio (M‐H, Fixed, 95% CI) | 1.38 [1.03, 1.84] |
| 8.2 abdominal surgery | 1 | 2858 | Risk Ratio (M‐H, Fixed, 95% CI) | 1.43 [0.93, 2.21] |
| 8.3 ICU patients | 1 | 36 | Risk Ratio (M‐H, Fixed, 95% CI) | 0.33 [0.01, 7.68] |
| 8.4 bariatric surgery patients | 1 | 198 | Risk Ratio (M‐H, Fixed, 95% CI) | 0.0 [0.0, 0.0] |
| 9 fatal bleeding Show forest plot | 7 | 10329 | Risk Ratio (M‐H, Fixed, 95% CI) | 0.71 [0.14, 3.62] |
| 9.1 orthopaedic patients | 4 | 7237 | Risk Ratio (M‐H, Fixed, 95% CI) | 0.34 [0.01, 8.28] |
| 9.2 abdominal surgery | 1 | 2858 | Risk Ratio (M‐H, Fixed, 95% CI) | 0.99 [0.14, 7.05] |
| 9.3 ICU patients | 1 | 36 | Risk Ratio (M‐H, Fixed, 95% CI) | 0.0 [0.0, 0.0] |
| 9.4 bariatric surgery patients | 1 | 198 | Risk Ratio (M‐H, Fixed, 95% CI) | 0.0 [0.0, 0.0] |
| 10 MI Show forest plot | 6 | 10720 | Risk Ratio (M‐H, Fixed, 95% CI) | 1.28 [0.69, 2.37] |
| 10.1 orthopaedic patients | 5 | 7862 | Risk Ratio (M‐H, Fixed, 95% CI) | 1.21 [0.61, 2.39] |
| 10.2 abdominal surgery | 1 | 2858 | Risk Ratio (M‐H, Fixed, 95% CI) | 1.66 [0.40, 6.92] |
| 11 all causes of death Show forest plot | 11 | 12400 | Risk Ratio (M‐H, Fixed, 95% CI) | 0.88 [0.63, 1.22] |
| 11.1 orthopaedic patients | 8 | 9308 | Risk Ratio (M‐H, Fixed, 95% CI) | 0.93 [0.64, 1.35] |
| 11.2 abdominal surgery | 1 | 2858 | Risk Ratio (M‐H, Fixed, 95% CI) | 0.75 [0.38, 1.45] |
| 11.3 ICU patients | 1 | 36 | Risk Ratio (M‐H, Fixed, 95% CI) | 0.0 [0.0, 0.0] |
| 11.4 bariatric surgery patients | 1 | 198 | Risk Ratio (M‐H, Fixed, 95% CI) | 0.0 [0.0, 0.0] |
| 12 other serious adverse effects Show forest plot | 10 | 12470 | Risk Ratio (M‐H, Fixed, 95% CI) | 1.06 [0.95, 1.19] |
| 12.1 orthopaedic patients | 8 | 9414 | Risk Ratio (M‐H, Fixed, 95% CI) | 1.03 [0.89, 1.19] |
| 12.2 abdominal surgery | 1 | 2858 | Risk Ratio (M‐H, Fixed, 95% CI) | 1.14 [0.92, 1.41] |
| 12.3 bariatric surgery patients | 1 | 198 | Risk Ratio (M‐H, Fixed, 95% CI) | 0.98 [0.33, 2.93] |
| Outcome or subgroup title | No. of studies | No. of participants | Statistical method | Effect size |
| 1 total VTE Show forest plot | 1 | Risk Ratio (M‐H, Fixed, 95% CI) | Totals not selected | |
| 2 symptomatic VTE Show forest plot | 1 | Risk Ratio (M‐H, Fixed, 95% CI) | Totals not selected | |
| 3 total DVT Show forest plot | 1 | Risk Ratio (M‐H, Fixed, 95% CI) | Totals not selected | |
| 4 proximal DVT Show forest plot | 1 | Risk Ratio (M‐H, Fixed, 95% CI) | Totals not selected | |
| 5 total PE Show forest plot | 1 | Risk Ratio (M‐H, Fixed, 95% CI) | Totals not selected | |
| 6 major bleeding Show forest plot | 1 | Risk Ratio (M‐H, Fixed, 95% CI) | Totals not selected | |
| 7 all causes of death Show forest plot | 1 | Risk Ratio (M‐H, Fixed, 95% CI) | Totals not selected | |
| Outcome or subgroup title | No. of studies | No. of participants | Statistical method | Effect size |
| 1 total VTE Show forest plot | 1 | Odds Ratio (M‐H, Fixed, 95% CI) | Totals not selected | |
| 2 major bleeding Show forest plot | 1 | Odds Ratio (M‐H, Fixed, 95% CI) | Totals not selected | |
| 3 all causes of death Show forest plot | 1 | Odds Ratio (M‐H, Fixed, 95% CI) | Totals not selected | |
| Outcome or subgroup title | No. of studies | No. of participants | Statistical method | Effect size |
| 1 total VTE Show forest plot | 1 | Risk Ratio (M‐H, Fixed, 95% CI) | Totals not selected | |
| 2 symptomatic VTE Show forest plot | 1 | Risk Ratio (M‐H, Fixed, 95% CI) | Totals not selected | |
| 3 total DVT Show forest plot | 1 | Risk Ratio (M‐H, Fixed, 95% CI) | Totals not selected | |
| 4 proximal DVT Show forest plot | 1 | Risk Ratio (M‐H, Fixed, 95% CI) | Totals not selected | |
| 5 total PE Show forest plot | 1 | Risk Ratio (M‐H, Fixed, 95% CI) | Totals not selected | |
| 6 major bleeding Show forest plot | 1 | Risk Ratio (M‐H, Fixed, 95% CI) | Totals not selected | |
| 7 all causes of death Show forest plot | 1 | Risk Ratio (M‐H, Fixed, 95% CI) | Totals not selected | |
| 8 other serious adverse effects Show forest plot | 1 | Risk Ratio (M‐H, Fixed, 95% CI) | Totals not selected | |