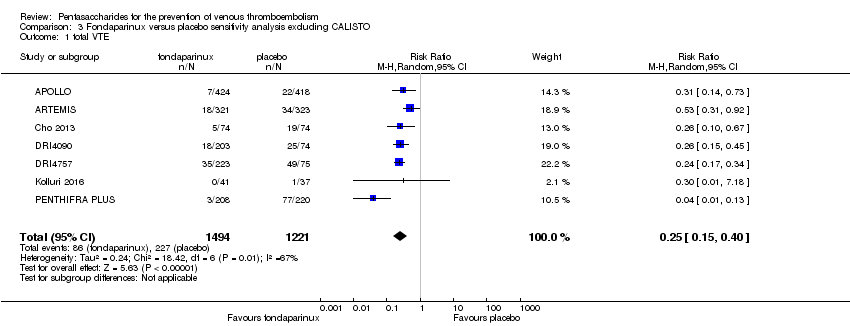
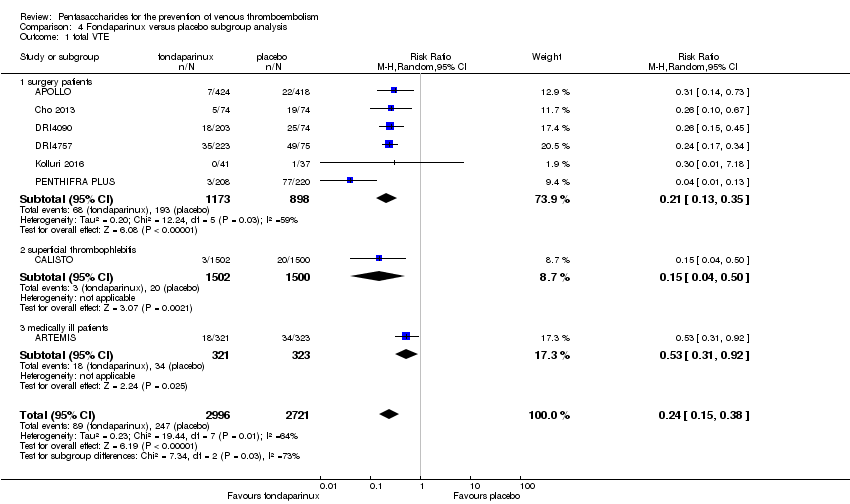
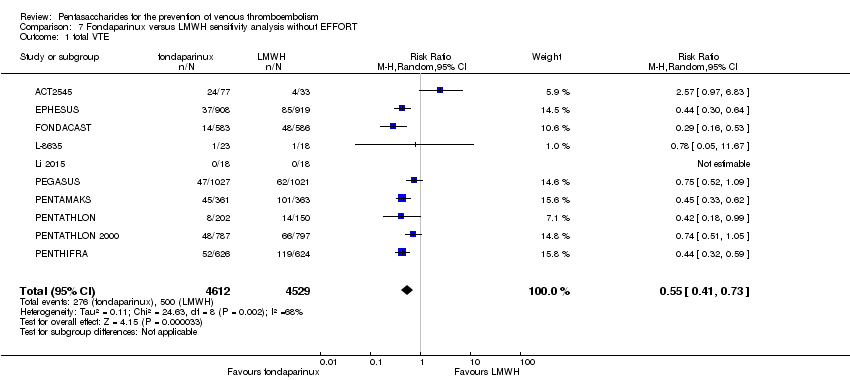
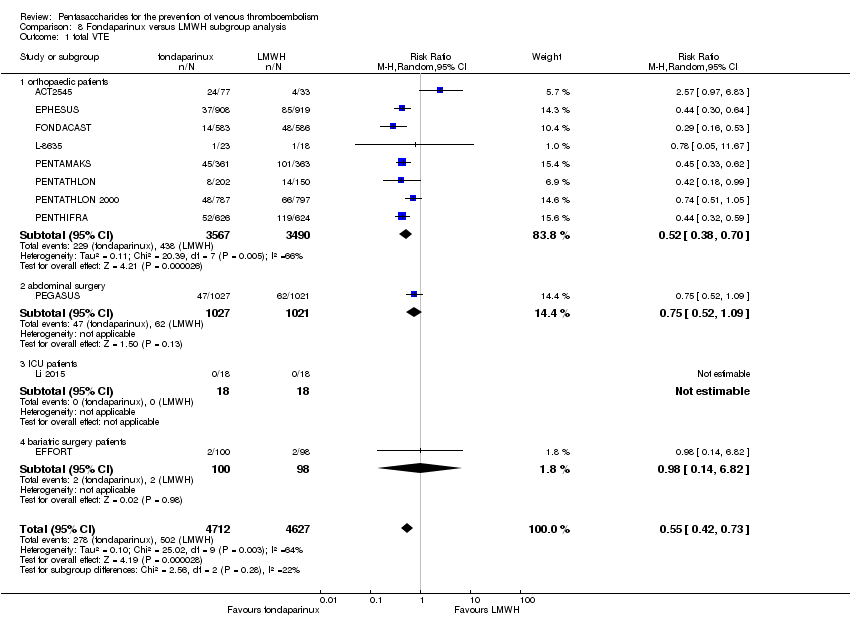
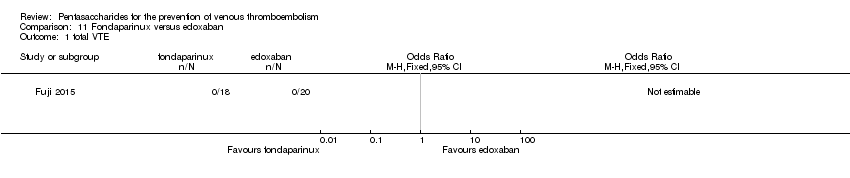
| 1 total VTE Show forest plot | 11 | 9339 | Risk Ratio (M‐H, Random, 95% CI) | 0.55 [0.42, 0.73] |
|
| 1.1 orthopaedic patients | 8 | 7057 | Risk Ratio (M‐H, Random, 95% CI) | 0.52 [0.38, 0.70] |
| 1.2 abdominal surgery | 1 | 2048 | Risk Ratio (M‐H, Random, 95% CI) | 0.75 [0.52, 1.09] |
| 1.3 ICU patients | 1 | 36 | Risk Ratio (M‐H, Random, 95% CI) | 0.0 [0.0, 0.0] |
| 1.4 bariatric surgery patients | 1 | 198 | Risk Ratio (M‐H, Random, 95% CI) | 0.98 [0.14, 6.82] |
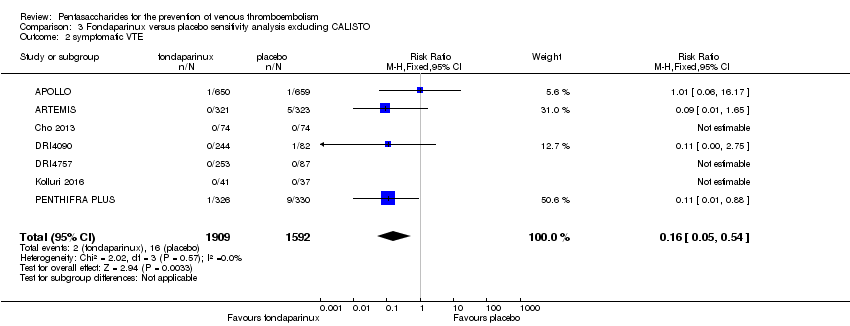
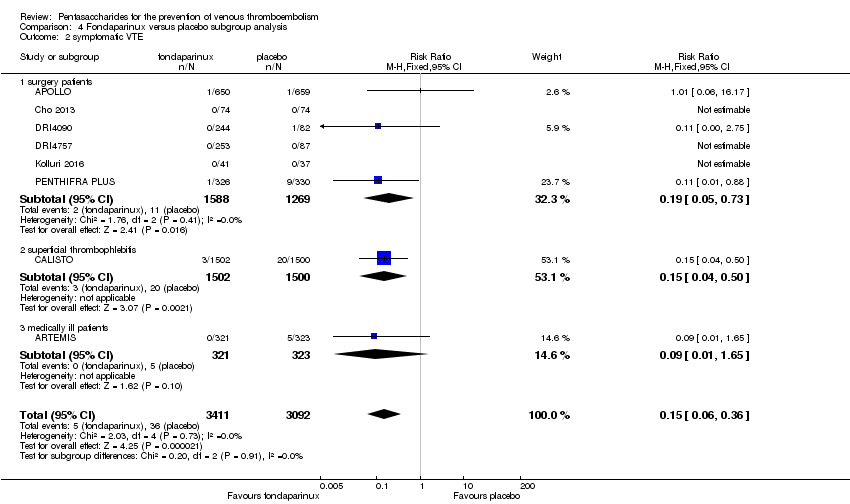
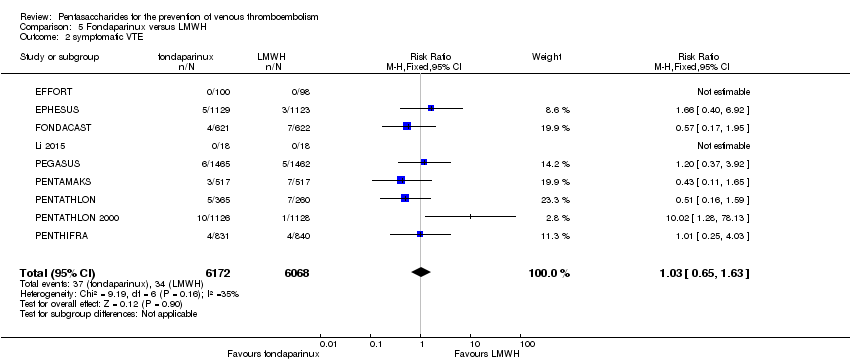
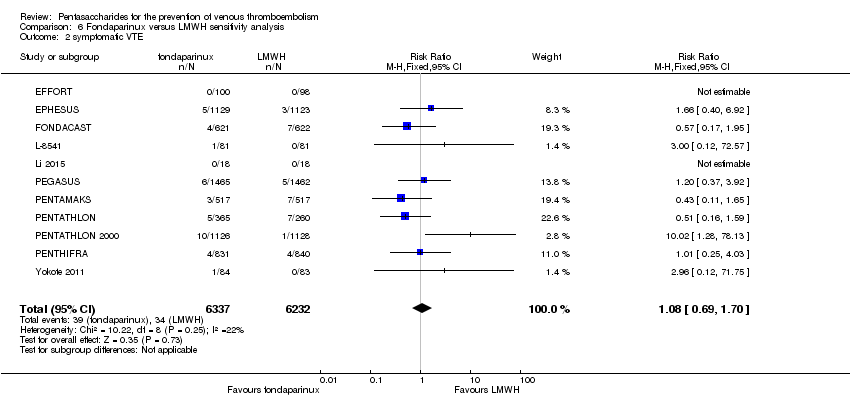
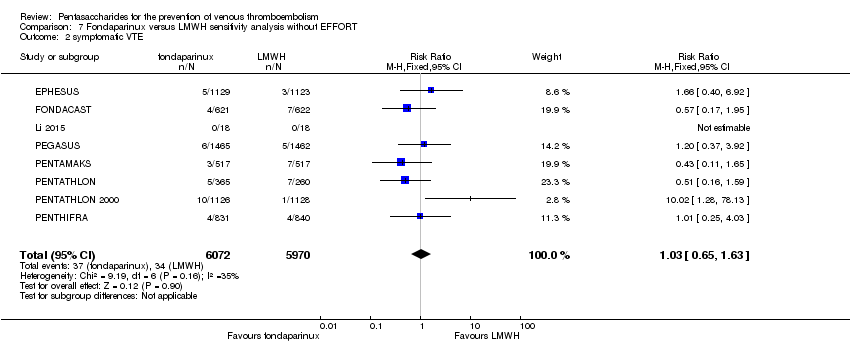
| 2 symptomatic VTE Show forest plot | 9 | 12240 | Risk Ratio (M‐H, Fixed, 95% CI) | 1.03 [0.65, 1.63] |
|
| 2.1 orthopaedic patients | 6 | 9079 | Risk Ratio (M‐H, Fixed, 95% CI) | 1.00 [0.61, 1.65] |
| 2.2 abdominal surgery | 1 | 2927 | Risk Ratio (M‐H, Fixed, 95% CI) | 1.20 [0.37, 3.92] |
| 2.3 ICU patients | 1 | 36 | Risk Ratio (M‐H, Fixed, 95% CI) | 0.0 [0.0, 0.0] |
| 2.4 bariatric surgery patients | 1 | 198 | Risk Ratio (M‐H, Fixed, 95% CI) | 0.0 [0.0, 0.0] |
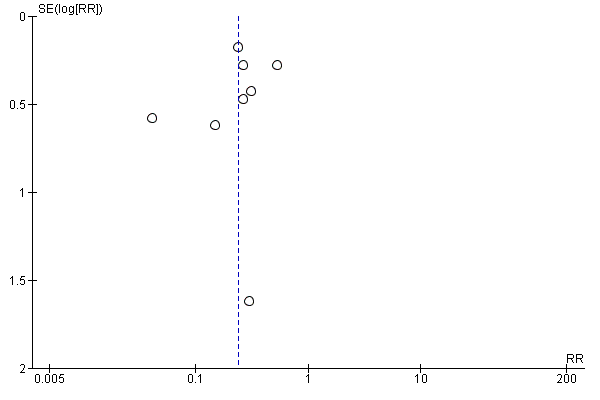
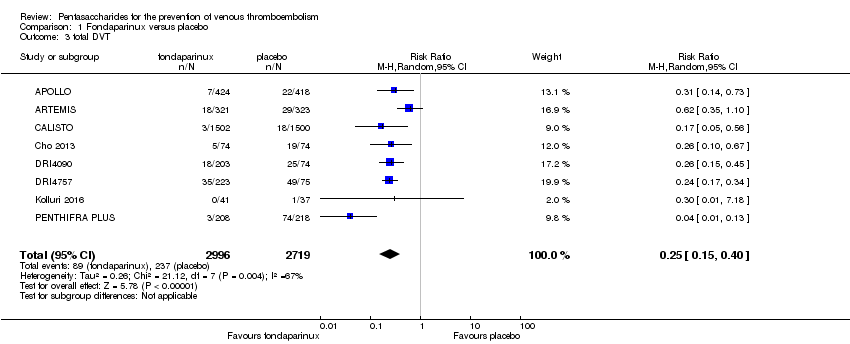
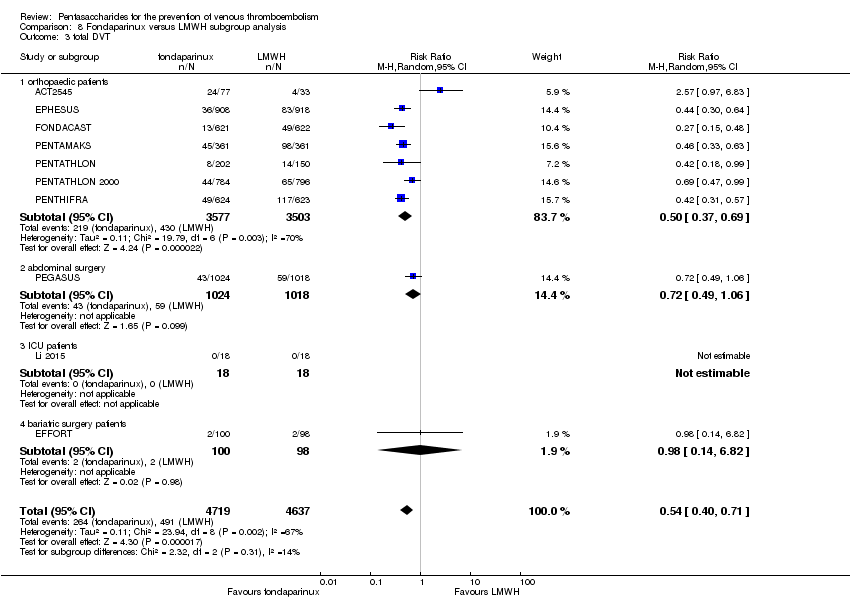
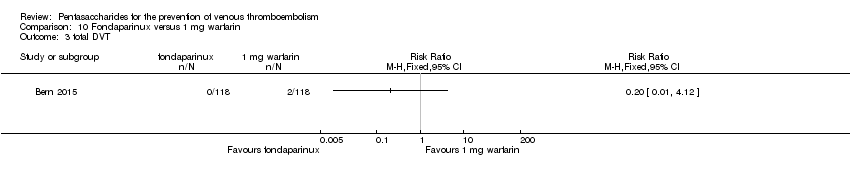
| 3 total DVT Show forest plot | 10 | 9356 | Risk Ratio (M‐H, Random, 95% CI) | 0.54 [0.40, 0.71] |
|
| 3.1 orthopaedic patients | 7 | 7080 | Risk Ratio (M‐H, Random, 95% CI) | 0.50 [0.37, 0.69] |
| 3.2 abdominal surgery | 1 | 2042 | Risk Ratio (M‐H, Random, 95% CI) | 0.72 [0.49, 1.06] |
| 3.3 ICU patients | 1 | 36 | Risk Ratio (M‐H, Random, 95% CI) | 0.0 [0.0, 0.0] |
| 3.4 bariatric surgery patients | 1 | 198 | Risk Ratio (M‐H, Random, 95% CI) | 0.98 [0.14, 6.82] |
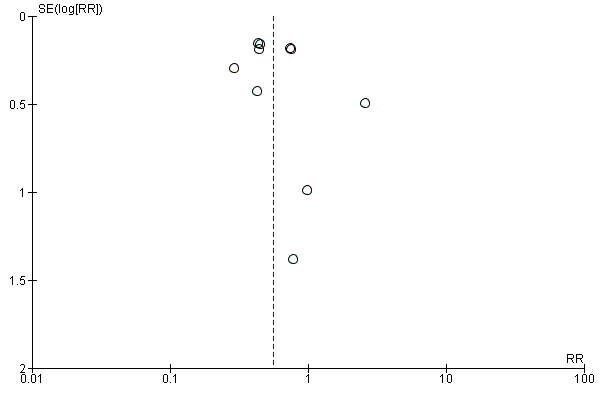
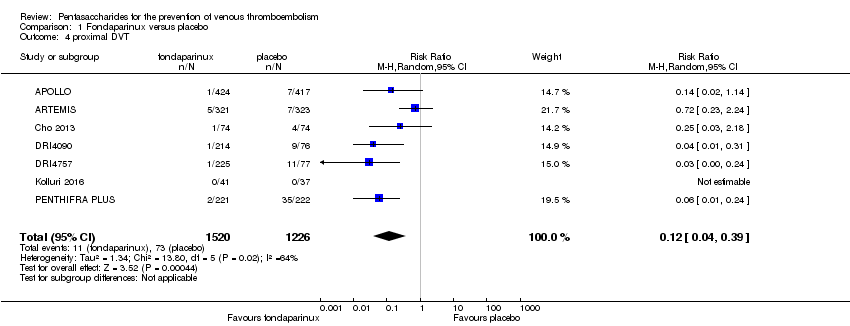
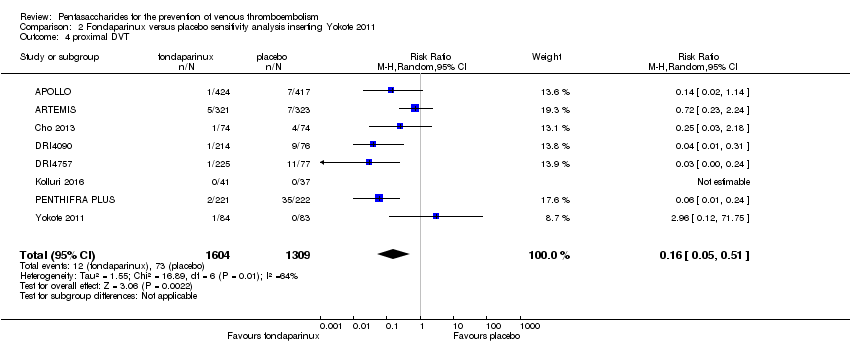
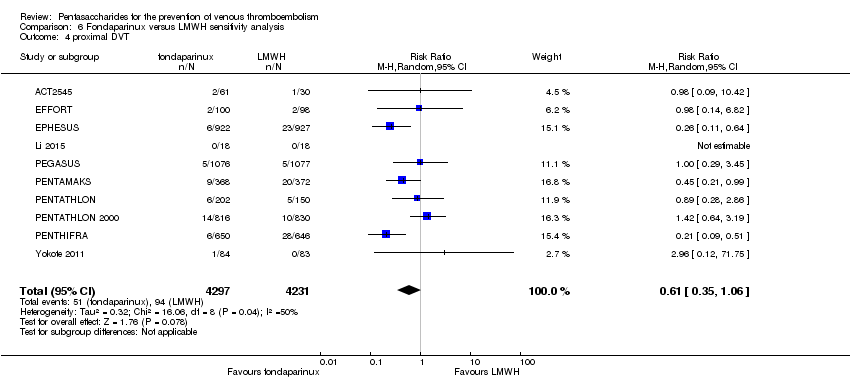
| 4 proximal DVT Show forest plot | 9 | 8361 | Risk Ratio (M‐H, Random, 95% CI) | 0.58 [0.33, 1.02] |
|
| 4.1 orthopaedic patients | 6 | 5974 | Risk Ratio (M‐H, Random, 95% CI) | 0.52 [0.26, 1.02] |
| 4.2 abdominal surgery | 1 | 2153 | Risk Ratio (M‐H, Random, 95% CI) | 1.00 [0.29, 3.45] |
| 4.3 ICU patients | 1 | 36 | Risk Ratio (M‐H, Random, 95% CI) | 0.0 [0.0, 0.0] |
| 4.4 bariatric surgery patients | 1 | 198 | Risk Ratio (M‐H, Random, 95% CI) | 0.98 [0.14, 6.82] |
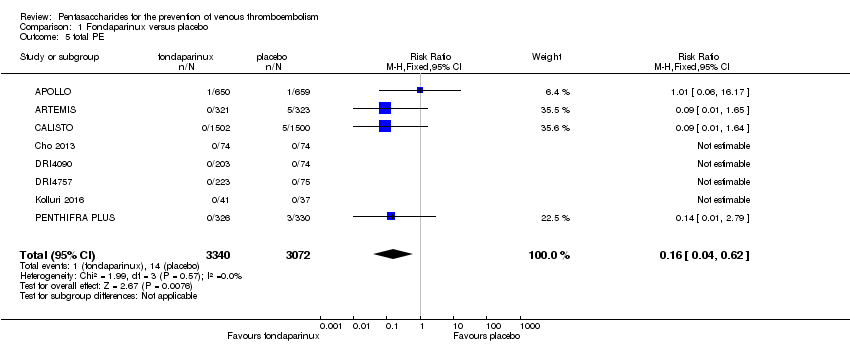
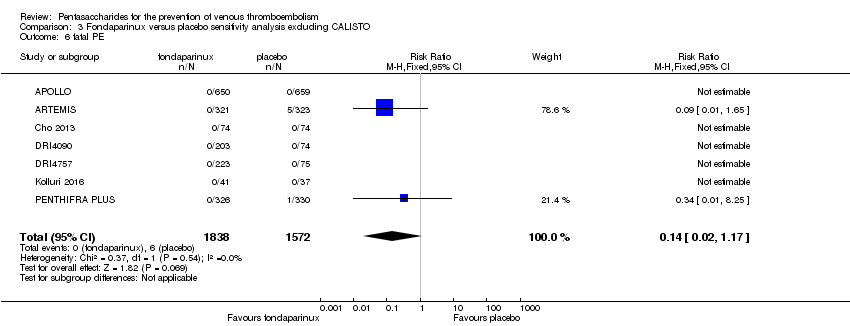
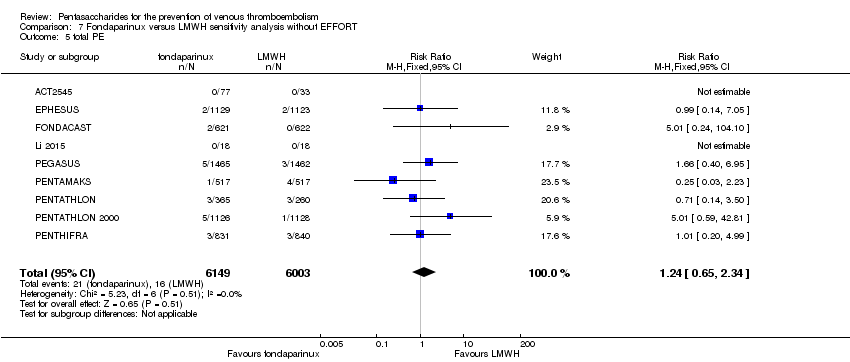
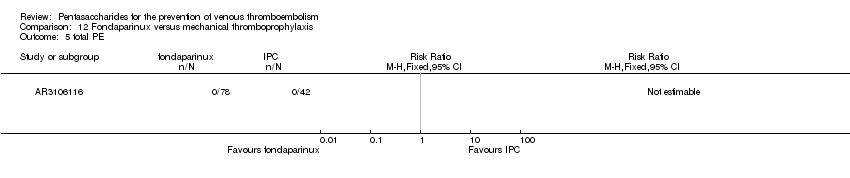
| 5 total PE Show forest plot | 10 | 12350 | Risk Ratio (M‐H, Fixed, 95% CI) | 1.24 [0.65, 2.34] |
|
| 5.1 orthopaedic patients | 7 | 9189 | Risk Ratio (M‐H, Fixed, 95% CI) | 1.14 [0.56, 2.34] |
| 5.2 abdominal surgery | 1 | 2927 | Risk Ratio (M‐H, Fixed, 95% CI) | 1.66 [0.40, 6.95] |
| 5.3 ICU patients | 1 | 36 | Risk Ratio (M‐H, Fixed, 95% CI) | 0.0 [0.0, 0.0] |
| 5.4 bariatric surgery patients | 1 | 198 | Risk Ratio (M‐H, Fixed, 95% CI) | 0.0 [0.0, 0.0] |
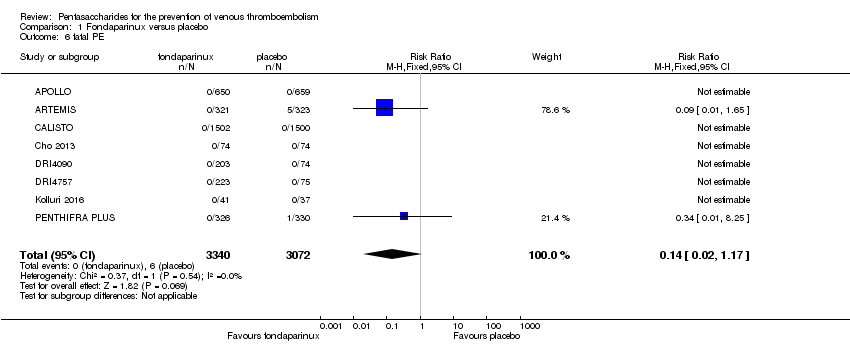
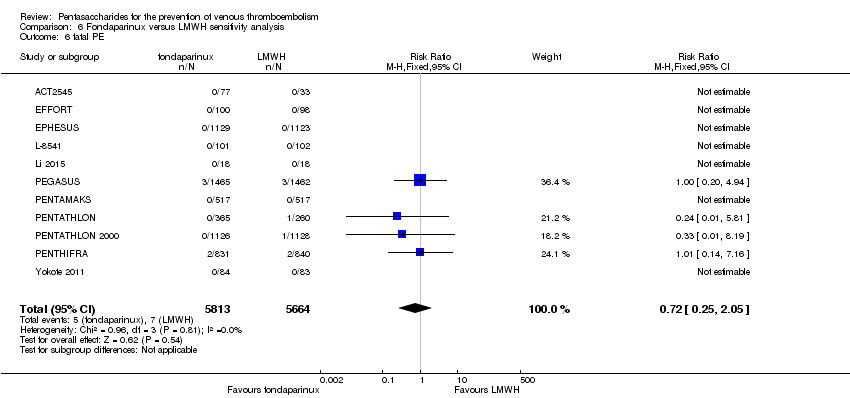
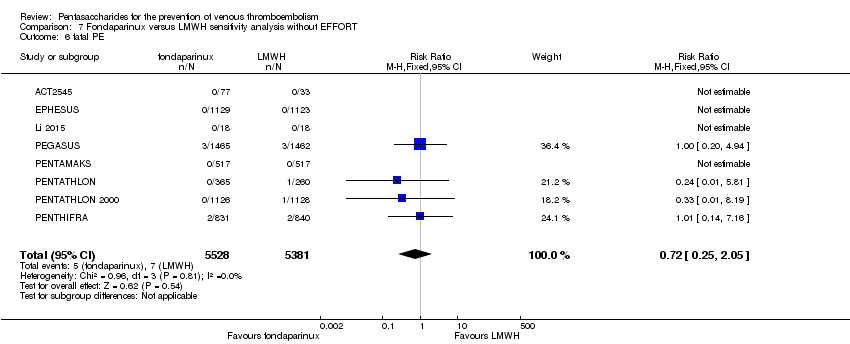
| 6 fatal PE Show forest plot | 9 | 11107 | Risk Ratio (M‐H, Fixed, 95% CI) | 0.72 [0.25, 2.05] |
|
| 6.1 orthopaedic patients | 6 | 7946 | Risk Ratio (M‐H, Fixed, 95% CI) | 0.56 [0.14, 2.29] |
| 6.2 abdominal surgery | 1 | 2927 | Risk Ratio (M‐H, Fixed, 95% CI) | 1.00 [0.20, 4.94] |
| 6.3 ICU patients | 1 | 36 | Risk Ratio (M‐H, Fixed, 95% CI) | 0.0 [0.0, 0.0] |
| 6.4 bariatric surgery patients | 1 | 198 | Risk Ratio (M‐H, Fixed, 95% CI) | 0.0 [0.0, 0.0] |
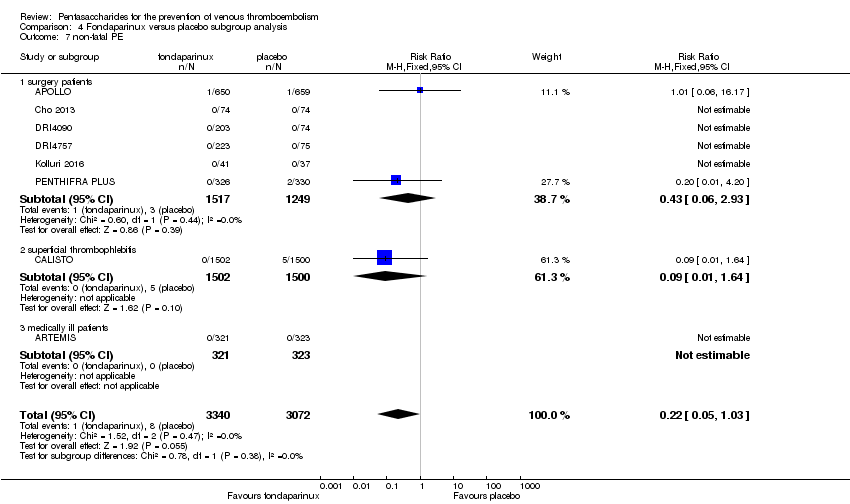
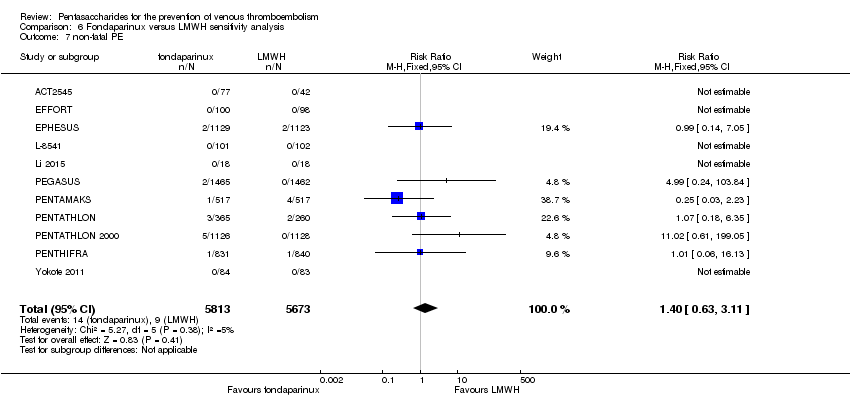
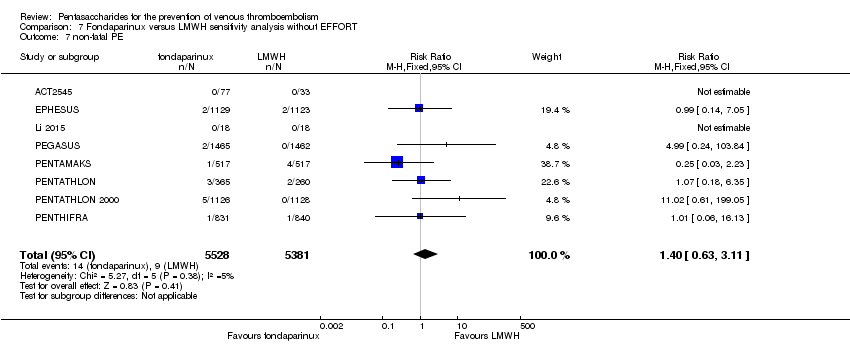
| 7 non‐fatal PE Show forest plot | 9 | 11107 | Risk Ratio (M‐H, Fixed, 95% CI) | 1.40 [0.63, 3.11] |
|
| 7.1 orthopaedic patients | 6 | 7946 | Risk Ratio (M‐H, Fixed, 95% CI) | 1.22 [0.53, 2.83] |
| 7.2 abdominal surgery | 1 | 2927 | Risk Ratio (M‐H, Fixed, 95% CI) | 4.99 [0.24, 103.84] |
| 7.3 ICU patients | 1 | 36 | Risk Ratio (M‐H, Fixed, 95% CI) | 0.0 [0.0, 0.0] |
| 7.4 bariatric surgery | 1 | 198 | Risk Ratio (M‐H, Fixed, 95% CI) | 0.0 [0.0, 0.0] |
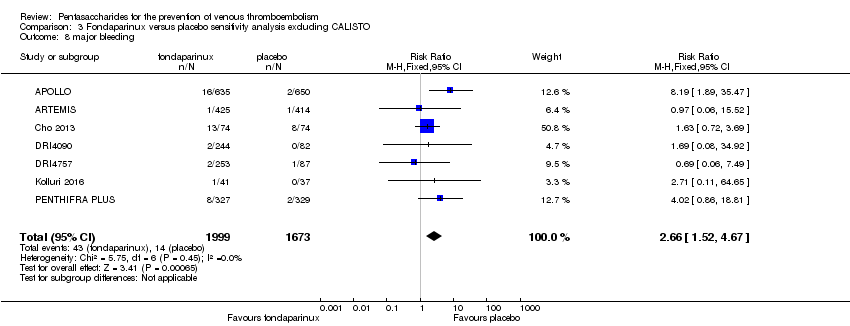
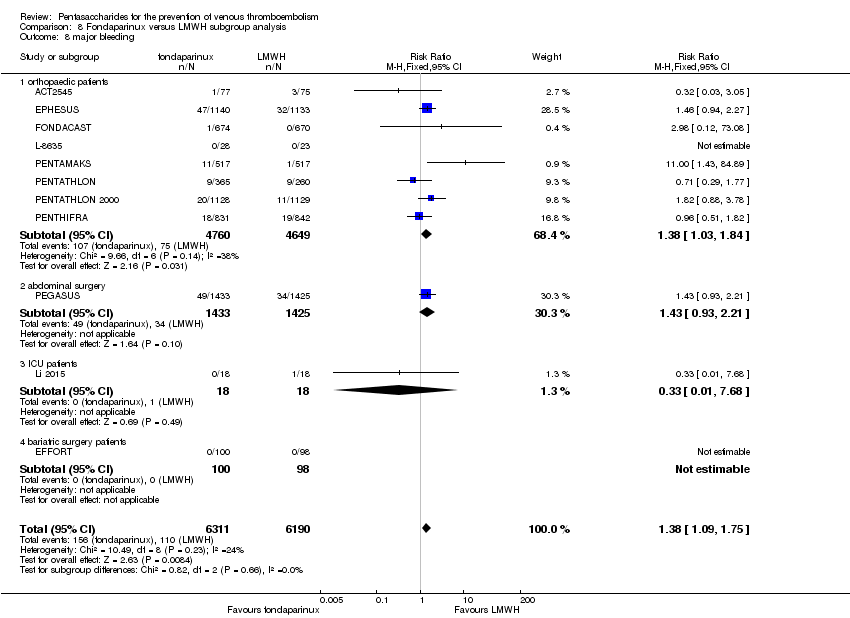
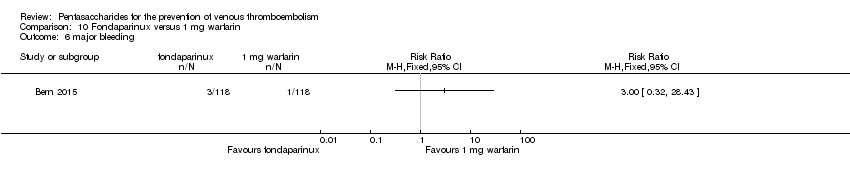
| 8 major bleeding Show forest plot | 11 | 12501 | Risk Ratio (M‐H, Fixed, 95% CI) | 1.38 [1.09, 1.75] |
|
| 8.1 orthopaedic patients | 8 | 9409 | Risk Ratio (M‐H, Fixed, 95% CI) | 1.38 [1.03, 1.84] |
| 8.2 abdominal surgery | 1 | 2858 | Risk Ratio (M‐H, Fixed, 95% CI) | 1.43 [0.93, 2.21] |
| 8.3 ICU patients | 1 | 36 | Risk Ratio (M‐H, Fixed, 95% CI) | 0.33 [0.01, 7.68] |
| 8.4 bariatric surgery patients | 1 | 198 | Risk Ratio (M‐H, Fixed, 95% CI) | 0.0 [0.0, 0.0] |
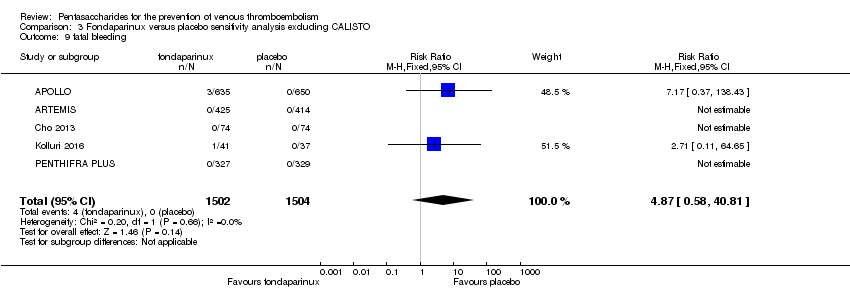
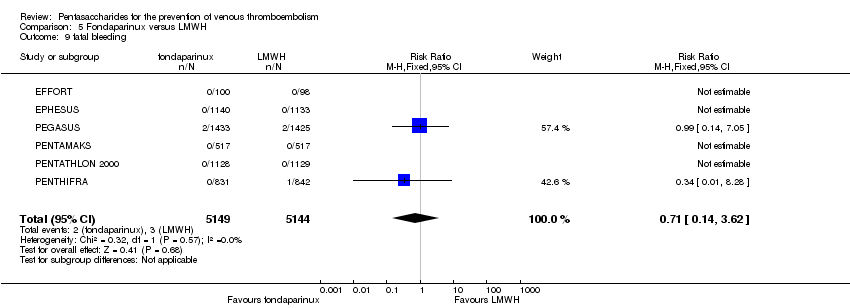
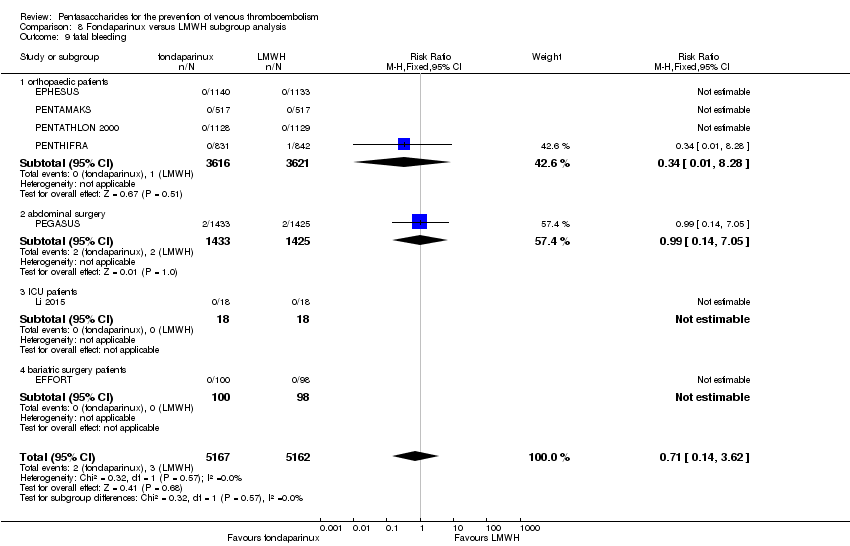
| 9 fatal bleeding Show forest plot | 7 | 10329 | Risk Ratio (M‐H, Fixed, 95% CI) | 0.71 [0.14, 3.62] |
|
| 9.1 orthopaedic patients | 4 | 7237 | Risk Ratio (M‐H, Fixed, 95% CI) | 0.34 [0.01, 8.28] |
| 9.2 abdominal surgery | 1 | 2858 | Risk Ratio (M‐H, Fixed, 95% CI) | 0.99 [0.14, 7.05] |
| 9.3 ICU patients | 1 | 36 | Risk Ratio (M‐H, Fixed, 95% CI) | 0.0 [0.0, 0.0] |
| 9.4 bariatric surgery patients | 1 | 198 | Risk Ratio (M‐H, Fixed, 95% CI) | 0.0 [0.0, 0.0] |
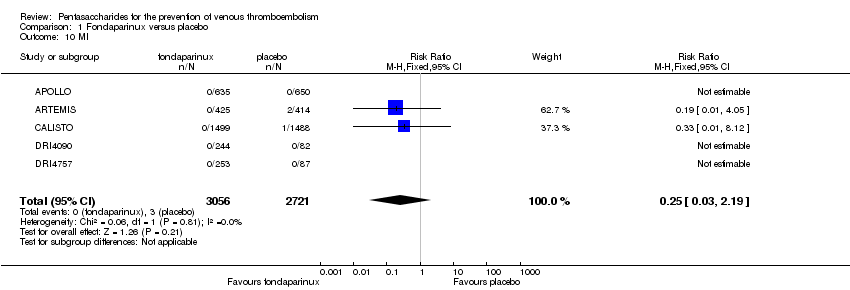
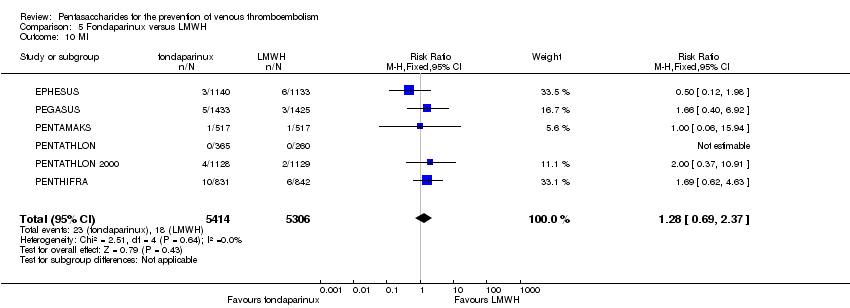
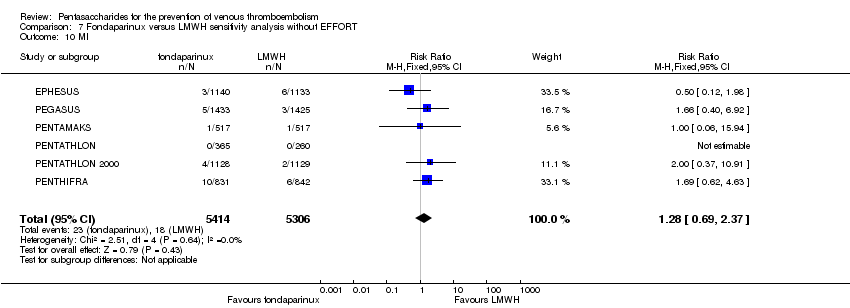
| 10 MI Show forest plot | 6 | 10720 | Risk Ratio (M‐H, Fixed, 95% CI) | 1.28 [0.69, 2.37] |
|
| 10.1 orthopaedic patients | 5 | 7862 | Risk Ratio (M‐H, Fixed, 95% CI) | 1.21 [0.61, 2.39] |
| 10.2 abdominal surgery | 1 | 2858 | Risk Ratio (M‐H, Fixed, 95% CI) | 1.66 [0.40, 6.92] |
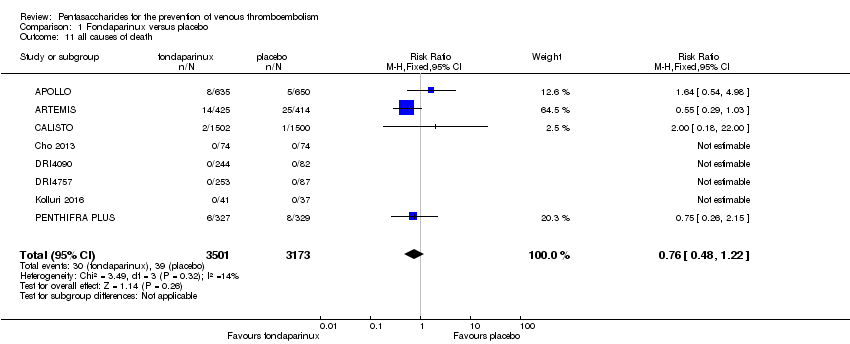
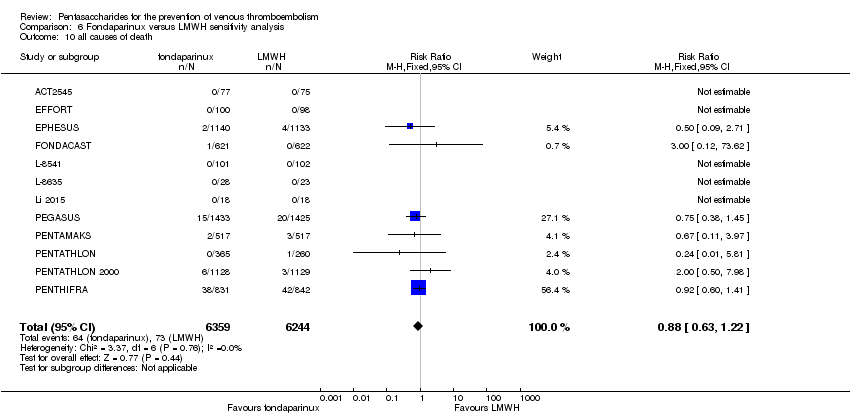
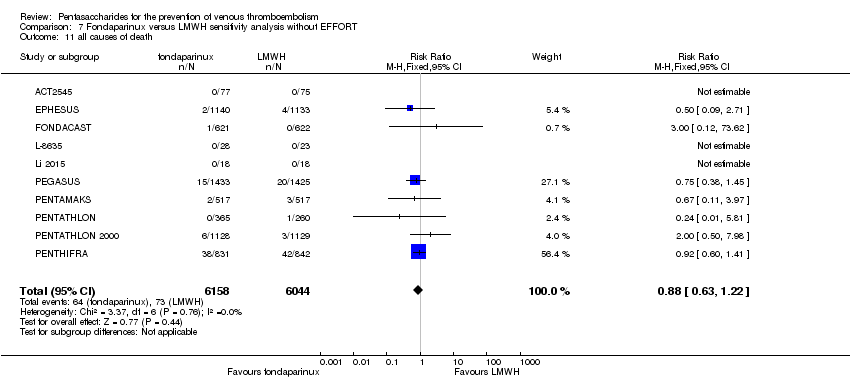
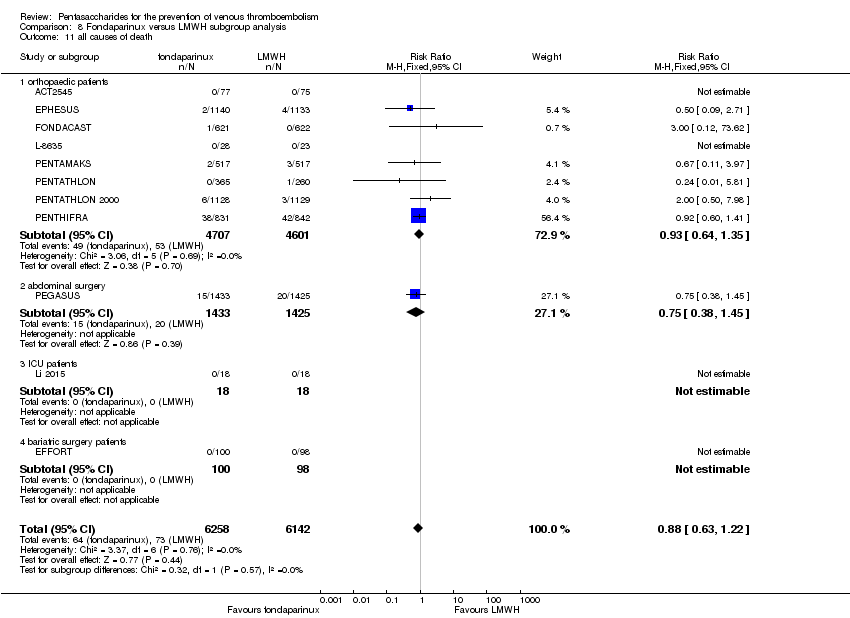
| 11 all causes of death Show forest plot | 11 | 12400 | Risk Ratio (M‐H, Fixed, 95% CI) | 0.88 [0.63, 1.22] |
|
| 11.1 orthopaedic patients | 8 | 9308 | Risk Ratio (M‐H, Fixed, 95% CI) | 0.93 [0.64, 1.35] |
| 11.2 abdominal surgery | 1 | 2858 | Risk Ratio (M‐H, Fixed, 95% CI) | 0.75 [0.38, 1.45] |
| 11.3 ICU patients | 1 | 36 | Risk Ratio (M‐H, Fixed, 95% CI) | 0.0 [0.0, 0.0] |
| 11.4 bariatric surgery patients | 1 | 198 | Risk Ratio (M‐H, Fixed, 95% CI) | 0.0 [0.0, 0.0] |
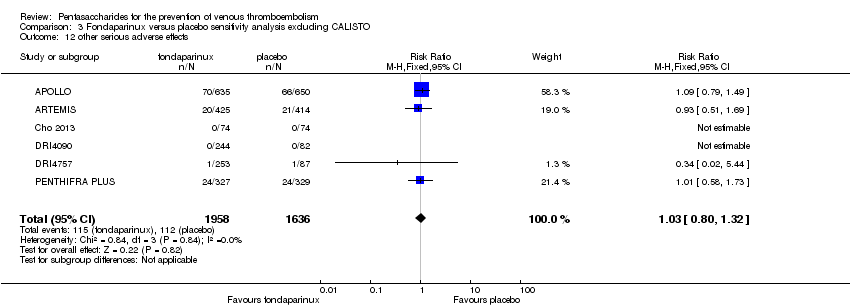
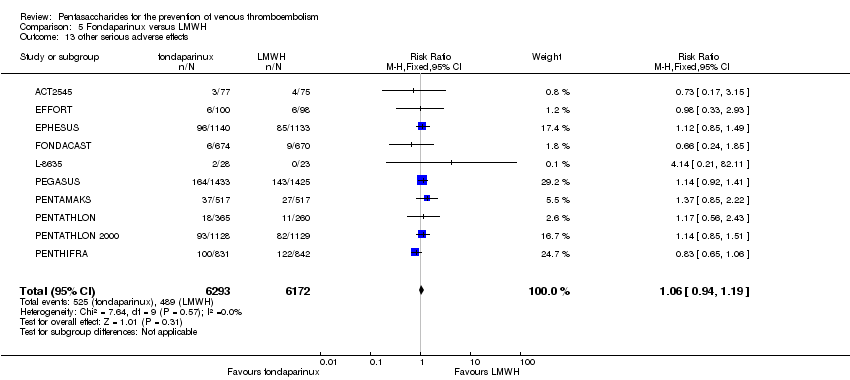
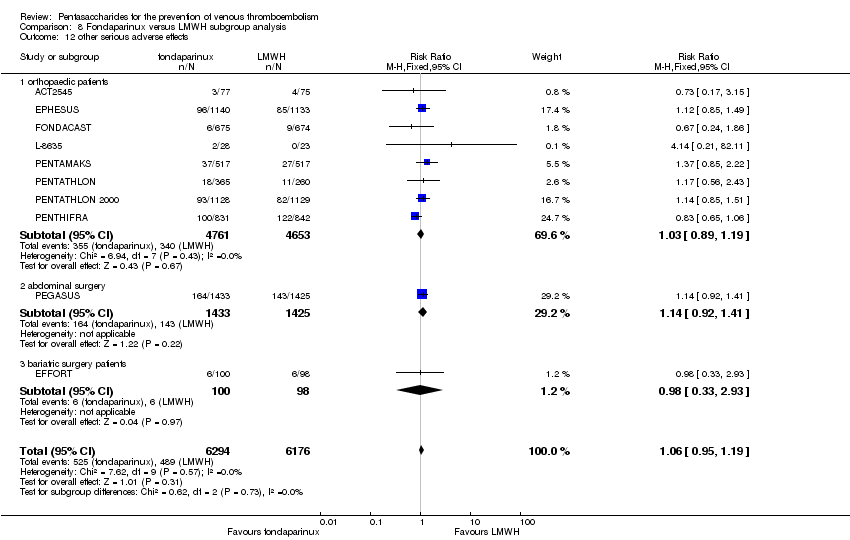
| 12 other serious adverse effects Show forest plot | 10 | 12470 | Risk Ratio (M‐H, Fixed, 95% CI) | 1.06 [0.95, 1.19] |
|
| 12.1 orthopaedic patients | 8 | 9414 | Risk Ratio (M‐H, Fixed, 95% CI) | 1.03 [0.89, 1.19] |
| 12.2 abdominal surgery | 1 | 2858 | Risk Ratio (M‐H, Fixed, 95% CI) | 1.14 [0.92, 1.41] |
| 12.3 bariatric surgery patients | 1 | 198 | Risk Ratio (M‐H, Fixed, 95% CI) | 0.98 [0.33, 2.93] |