Contenido relacionado
Revisiones y protocolos relacionados
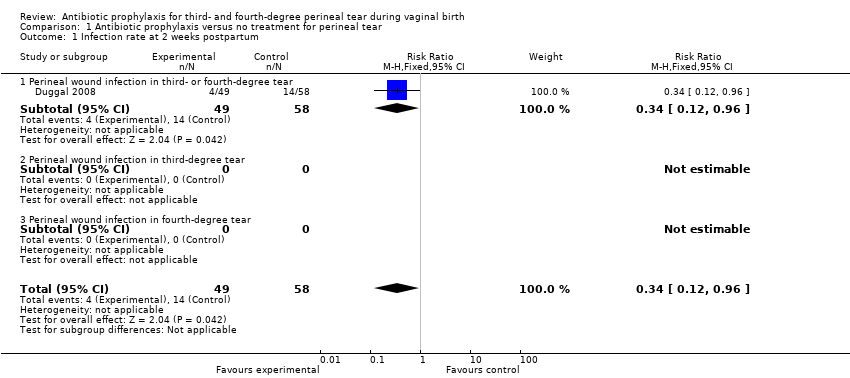
Tippawan Liabsuetrakul, Thanapan Choobun, Krantarat Peeyananjarassri, Q Monir Islam | 26 marzo 2020
Vigdis Aasheim, Anne Britt Vika Nilsen, Liv Merete Reinar, Mirjam Lukasse | 13 junio 2017
Mercedes Bonet, Erika Ota, Chioma E Chibueze, Olufemi T Oladapo | 2 noviembre 2017
Ashraf F Nabhan, Nahed E Allam, Mohamed Hamed Abdel‐Aziz Salama | 17 junio 2016
Mercedes Bonet, Erika Ota, Chioma E Chibueze, Olufemi T Oladapo | 13 noviembre 2017
Ruwan J Fernando, Abdul H Sultan, Christine Kettle, Ranee Thakar | 8 diciembre 2013
Michael M Beckmann, Owen M Stock | 30 abril 2013
Fan Zhou, Xiao Dong Wang, Jing Li, Gui Qiong Huang, Bing Xin Gao | 5 febrero 2014
Kate A Walsh, Rosalie M Grivell | 29 octubre 2015
Evelina Chapman, Ludovic Reveiz, Eduardo Illanes, Xavier Bonfill Cosp | 19 diciembre 2014