Scolaris Content Display Scolaris Content Display

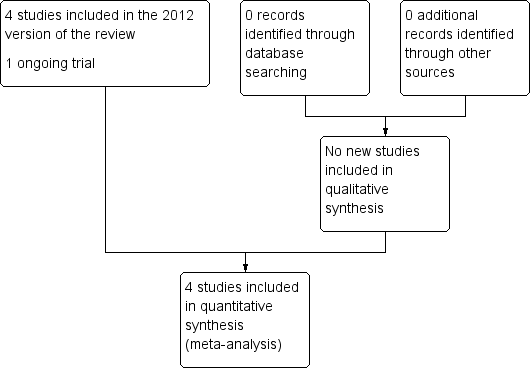
Study flow diagram
Figuras y tablas -
Figure 1

Study flow diagram

Risk of bias summary: review authors' judgements about each risk of bias item for each included study
Figuras y tablas -
Figure 2

Risk of bias summary: review authors' judgements about each risk of bias item for each included study

Comparison 1 Admission cardiotocography versus Intermittent auscultation (low‐risk women), Outcome 1 Caesarean section.
Figuras y tablas -
Analysis 1.1

Comparison 1 Admission cardiotocography versus Intermittent auscultation (low‐risk women), Outcome 1 Caesarean section.

Comparison 1 Admission cardiotocography versus Intermittent auscultation (low‐risk women), Outcome 2 Instrumental vaginal birth.
Figuras y tablas -
Analysis 1.2

Comparison 1 Admission cardiotocography versus Intermittent auscultation (low‐risk women), Outcome 2 Instrumental vaginal birth.

Comparison 1 Admission cardiotocography versus Intermittent auscultation (low‐risk women), Outcome 3 Continuous EFM during labour.
Figuras y tablas -
Analysis 1.3

Comparison 1 Admission cardiotocography versus Intermittent auscultation (low‐risk women), Outcome 3 Continuous EFM during labour.

Comparison 1 Admission cardiotocography versus Intermittent auscultation (low‐risk women), Outcome 4 Amniotomy.
Figuras y tablas -
Analysis 1.4

Comparison 1 Admission cardiotocography versus Intermittent auscultation (low‐risk women), Outcome 4 Amniotomy.

Comparison 1 Admission cardiotocography versus Intermittent auscultation (low‐risk women), Outcome 5 Oxytocin for augmentation of labour.
Figuras y tablas -
Analysis 1.5

Comparison 1 Admission cardiotocography versus Intermittent auscultation (low‐risk women), Outcome 5 Oxytocin for augmentation of labour.

Comparison 1 Admission cardiotocography versus Intermittent auscultation (low‐risk women), Outcome 6 Epidural.
Figuras y tablas -
Analysis 1.6

Comparison 1 Admission cardiotocography versus Intermittent auscultation (low‐risk women), Outcome 6 Epidural.

Comparison 1 Admission cardiotocography versus Intermittent auscultation (low‐risk women), Outcome 7 Fetal blood sampling.
Figuras y tablas -
Analysis 1.7

Comparison 1 Admission cardiotocography versus Intermittent auscultation (low‐risk women), Outcome 7 Fetal blood sampling.

Comparison 1 Admission cardiotocography versus Intermittent auscultation (low‐risk women), Outcome 8 Fetal and neonatal deaths.
Figuras y tablas -
Analysis 1.8

Comparison 1 Admission cardiotocography versus Intermittent auscultation (low‐risk women), Outcome 8 Fetal and neonatal deaths.

Comparison 1 Admission cardiotocography versus Intermittent auscultation (low‐risk women), Outcome 9 Evidence of fetal multi‐organ compromise within the first 24 hours after birth.
Figuras y tablas -
Analysis 1.9

Comparison 1 Admission cardiotocography versus Intermittent auscultation (low‐risk women), Outcome 9 Evidence of fetal multi‐organ compromise within the first 24 hours after birth.

Comparison 1 Admission cardiotocography versus Intermittent auscultation (low‐risk women), Outcome 10 Admission to neonatal intensive care.
Figuras y tablas -
Analysis 1.10

Comparison 1 Admission cardiotocography versus Intermittent auscultation (low‐risk women), Outcome 10 Admission to neonatal intensive care.

Comparison 1 Admission cardiotocography versus Intermittent auscultation (low‐risk women), Outcome 11 Apgar score < 7 at or after 5 minutes.
Figuras y tablas -
Analysis 1.11

Comparison 1 Admission cardiotocography versus Intermittent auscultation (low‐risk women), Outcome 11 Apgar score < 7 at or after 5 minutes.

Comparison 1 Admission cardiotocography versus Intermittent auscultation (low‐risk women), Outcome 12 Hypoxic ischaemic encephalopathy.
Figuras y tablas -
Analysis 1.12

Comparison 1 Admission cardiotocography versus Intermittent auscultation (low‐risk women), Outcome 12 Hypoxic ischaemic encephalopathy.

Comparison 1 Admission cardiotocography versus Intermittent auscultation (low‐risk women), Outcome 13 Neonatal seizures.
Figuras y tablas -
Analysis 1.13

Comparison 1 Admission cardiotocography versus Intermittent auscultation (low‐risk women), Outcome 13 Neonatal seizures.

Comparison 1 Admission cardiotocography versus Intermittent auscultation (low‐risk women), Outcome 14 Length of stay in neonatal intensive care (days).
Figuras y tablas -
Analysis 1.14

Comparison 1 Admission cardiotocography versus Intermittent auscultation (low‐risk women), Outcome 14 Length of stay in neonatal intensive care (days).

Comparison 1 Admission cardiotocography versus Intermittent auscultation (low‐risk women), Outcome 15 Length of stay in neonatal intensive care (hours).
Figuras y tablas -
Analysis 1.15

Comparison 1 Admission cardiotocography versus Intermittent auscultation (low‐risk women), Outcome 15 Length of stay in neonatal intensive care (hours).

Summary of findings for the main comparison. Admission cardiotocography compared to Intermittent auscultation (low‐risk women) for assessment of fetal wellbeing

Admission cardiotocography compared to Intermittent auscultation (low‐risk women) for assessment of fetal wellbeing

Patient or population: Low risk pregnant women. All of the women were in labour.
Setting: Ireland and UK
Intervention: Admission cardiotocography ‐ women received a routine 15‐minute (1 trial) or 20‐minute (3 trials) tracing.
Comparison: Intermittent auscultation (low‐risk women) ‐ women received intermittent auscultation of the fetal heart for at least one full minute (4 trials), during and after a contraction (2 trials) or after a contraction only (2 trials).

Outcomes

Anticipated absolute effects* (95% CI)

Relative effect
(95% CI)

№ of participants
(studies)

Quality of the evidence
(GRADE)

Comments

Risk with Intermittent auscultation (low‐risk women)

Risk with admission cardiotocography

Incidence of caesarean section

Study population

RR 1.20
(1.00 to 1.44)

11338
(4 RCTs)

⊕⊕⊕⊝
MODERATE 1 2

36 per 1000

44 per 1000
(36 to 52)

Incidence of operative vaginal birth

Study population

RR 1.10
(0.95 to 1.27)

11338
(4 RCTs)

⊕⊕⊝⊝
LOW 1 3

126 per 1000

139 per 1000
(120 to 160)

Perinatal mortality rate (fetal and neonatal deaths excluding lethal congenital anomalies)

Study population

RR 1.01
(0.30 to 3.47)

11339
(4 RCTs)

⊕⊕⊕⊝
MODERATE 4 5 6

1 per 1000

1 per 1000
(0 to 3)

Severe neurodevelopmental disability assessed ≥ 12 months of age

Study population

(0 RCTs)

None of the included studies reported data for the outcome

see comment

see comment

Incidence of continuous electronic fetal monitoring during labour

Study population

RR 1.30
(1.14 to 1.48)

10753
(3 RCTs)

⊕⊕⊝⊝
LOW 1 7

417 per 1000

542 per 1000
(475 to 617)

Incidence and severity of hypoxic ischaemic encephalopathy (incidence only reported)

Study population

RR 1.19
(0.37 to 3.90)

2367
(1 RCT)

⊕⊝⊝⊝
VERY LOW 1 8

4 per 1000

5 per 1000
(2 to 17)

Incidence of seizures in the neonatal period

Study population

RR 0.72
(0.32 to 1.61)

8056
(1 RCT)

⊕⊕⊝⊝
LOW 1 9

3 per 1000

2 per 1000
(1 to 6)

*The risk in the intervention group (and its 95% confidence interval) is based on the assumed risk in the comparison group and the relative effect of the intervention (and its 95% CI).

CI: Confidence interval; RR: Risk ratio; OR: Odds ratio;

GRADE Working Group grades of evidence
High quality: We are very confident that the true effect lies close to that of the estimate of the effect
Moderate quality: We are moderately confident in the effect estimate: The true effect is likely to be close to the estimate of the effect, but there is a possibility that it is substantially different
Low quality: Our confidence in the effect estimate is limited: The true effect may be substantially different from the estimate of the effect
Very low quality: We have very little confidence in the effect estimate: The true effect is likely to be substantially different from the estimate of effect

1 Most studies contributing data had design limitations: outcome may have been affected by lack of blinding as all studies judged to be at high risk of performance bias (‐1)

2 Good sample size (> 3000), no measurable heterogeneity (I² = 0%), however 95% confidence interval touches the line of no effect (not downgraded)

3 Good sample size (> 3000), though wide confidence intervals cross the line of no effect (‐1)

4 Studies contributing data had design limitations: unlikely this outcome was affected by lack of blinding (not downgraded)

5 Few events but good sample size (not downgraded)

6 Very wide confidence intervals crossing the line of no effect (‐1)

7 Statistical heterogeneity (I² = 79%) (‐1)

8 Wide confidence interval crossing the line of no effect, few events & small sample size (based on one study) (‐2)

9 Wide confidence intervals crossing the line of no effect, large sample size with data from one study (‐1)

Figuras y tablas -
Summary of findings for the main comparison. Admission cardiotocography compared to Intermittent auscultation (low‐risk women) for assessment of fetal wellbeing
Comparison 1. Admission cardiotocography versus Intermittent auscultation (low‐risk women)

Outcome or subgroup title

No. of studies

No. of participants

Statistical method

Effect size

1 Caesarean section Show forest plot

4

11338

Risk Ratio (M‐H, Random, 95% CI)

1.20 [1.00, 1.44]

2 Instrumental vaginal birth Show forest plot

4

11338

Risk Ratio (M‐H, Random, 95% CI)

1.10 [0.95, 1.27]

3 Continuous EFM during labour Show forest plot

3

10753

Risk Ratio (M‐H, Random, 95% CI)

1.30 [1.14, 1.48]

4 Amniotomy Show forest plot

2

2694

Risk Ratio (M‐H, Random, 95% CI)

1.04 [0.97, 1.12]

5 Oxytocin for augmentation of labour Show forest plot

4

11324

Risk Ratio (M‐H, Random, 95% CI)

1.05 [0.95, 1.17]

6 Epidural Show forest plot

3

10757

Risk Ratio (M‐H, Random, 95% CI)

1.11 [0.87, 1.41]

7 Fetal blood sampling Show forest plot

3

10757

Risk Ratio (M‐H, Random, 95% CI)

1.28 [1.13, 1.45]

8 Fetal and neonatal deaths Show forest plot

4

11339

Risk Ratio (M‐H, Random, 95% CI)

1.01 [0.30, 3.47]

9 Evidence of fetal multi‐organ compromise within the first 24 hours after birth Show forest plot

1

8056

Risk Ratio (M‐H, Random, 95% CI)

0.56 [0.19, 1.67]

10 Admission to neonatal intensive care Show forest plot

4

11331

Risk Ratio (M‐H, Random, 95% CI)

1.03 [0.86, 1.24]

11 Apgar score < 7 at or after 5 minutes Show forest plot

4

11324

Risk Ratio (M‐H, Random, 95% CI)

1.00 [0.54, 1.85]

12 Hypoxic ischaemic encephalopathy Show forest plot

1

2367

Risk Ratio (M‐H, Random, 95% CI)

1.19 [0.37, 3.90]

13 Neonatal seizures Show forest plot

1

8056

Risk Ratio (M‐H, Random, 95% CI)

0.72 [0.32, 1.61]

14 Length of stay in neonatal intensive care (days) Show forest plot

1

91

Mean Difference (IV, Random, 95% CI)

1.80 [‐0.59, 4.19]

15 Length of stay in neonatal intensive care (hours) Show forest plot

1

318

Mean Difference (IV, Random, 95% CI)

6.20 [‐8.70, 21.10]

Figuras y tablas -
Comparison 1. Admission cardiotocography versus Intermittent auscultation (low‐risk women)