Tratamiento quirúrgico versus no quirúrgico para las fracturas toracolumbares por estallido sin déficit neurológico
Información
- DOI:
- https://doi.org/10.1002/14651858.CD005079.pub3Copiar DOI

- Base de datos:
-
- Cochrane Database of Systematic Reviews
- Versión publicada:
-
- 06 junio 2013see what's new
- Tipo:
-
- Intervention
- Etapa:
-
- Review
- Grupo Editorial Cochrane:
-
Grupo Cochrane de Lesiones óseas, articulares y musculares
- Copyright:
-
- Copyright © 2013 The Cochrane Collaboration. Published by John Wiley & Sons, Ltd.
Cifras del artículo
Altmetric:
Citado por:
Autores
Contributions of authors
Minawaer Abudu: protocol development, searching for trials, quality assessment of trials, data extraction, data analysis, review development.
Xingyu Kong: searching for trials, quality assessment of trials, data extraction, data analysis.
Wu Taixiang: quality assessment of trials, statistical advice, review development.
Chen Xueyi: supervisor for development of the review.
Declarations of interest
None known.
Acknowledgements
We are very grateful for valuable comments and support from Bill Gillespie, Helen Handoll and Cumhur Kilincer on drafts of this updated review.
We thank Janet Wale, Peter Herbison, Rajan Madhok and Jeremy Fairbank for their comments on the first version of the review. We also thank Marc Swiontkowski for helpful comments on the protocol. We are also grateful to Lindsey Elstub, Joanne Elliott and Lesley Gillespie of the Cochrane Bone, Joint and Muscle Trauma Group.
Thanks too to Yuan Hao for preparing the first version of this updated review. In addition, the review authors who prepared the protocol and first version of the review are gratefully acknowledged: Liao Yi, Bai Jingping, Jin Cele and XiLin Baoleri.
Version history
| Published | Title | Stage | Authors | Version |
| 2013 Jun 06 | Surgical versus non‐surgical treatment for thoracolumbar burst fractures without neurological deficit | Review | Minawaer Abudou, Xueyi Chen, Xiangyu Kong, Taixiang Wu | |
| 2006 Oct 18 | Operative versus non‐operative treatment for thoracolumbar burst fractures without neurological deficit | Review | Liao Yi, Bai Jingping, Jin Gele, Taixiang Wu, XiLin Baoleri | |
| 2005 Jan 24 | Operative versus non‐operative treatment for thoracolumbar burst fractures without neurological deficit | Protocol | Liao Yi, Bai Jingping, Jin Gele, XiLin Baoleri, Wu Taixiang | |
Differences between protocol and review
-
Reappraisal of Types of outcome measures led to the downgrading of economic evaluation to a secondary outcome and removal of the secondary outcome 'correlation between the final amount of kyphosis/canal compromise and the pain reported or disability' ‐ this was still reported but not as a measure of treatment effect.
-
We assessed risk of bias instead of study methodological quality.
-
In the protocol, we planned to synthesise data but as only two trials with substantial heterogeneity were included, only limited meta‐analysis was possible.
Keywords
MeSH
Medical Subject Headings (MeSH) Keywords
Medical Subject Headings Check Words
Humans;

Risk of bias graph: review authors' judgements about each risk of bias item presented as percentages across all included studies.

Risk of bias summary: review authors' judgements about each risk of bias item for each included study.

Comparison 1 Surgical versus non‐surgical treatment, Outcome 1 Visual Analogue Pain Scores (0 to 100 mm: worst) at follow‐up.
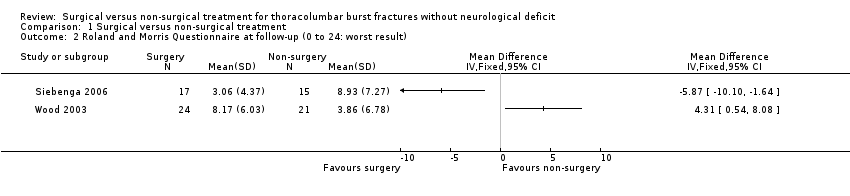
Comparison 1 Surgical versus non‐surgical treatment, Outcome 2 Roland and Morris Questionnaire at follow‐up (0 to 24: worst result).
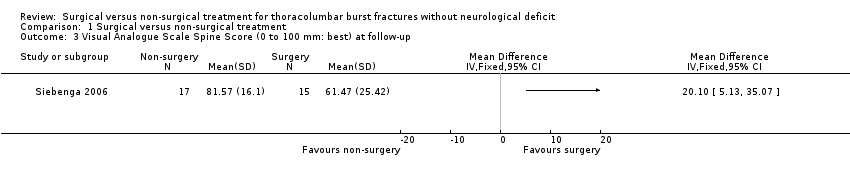
Comparison 1 Surgical versus non‐surgical treatment, Outcome 3 Visual Analogue Scale Spine Score (0 to 100 mm: best) at follow‐up.

Comparison 1 Surgical versus non‐surgical treatment, Outcome 4 Oswestry Questionnaire at minimum 24 months follow‐up.
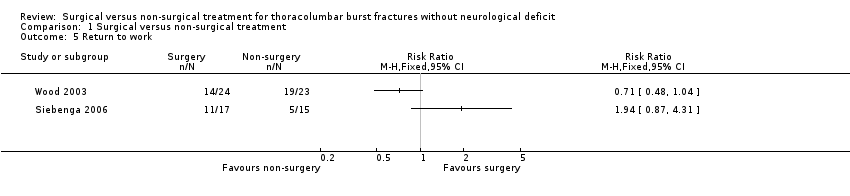
Comparison 1 Surgical versus non‐surgical treatment, Outcome 5 Return to work.
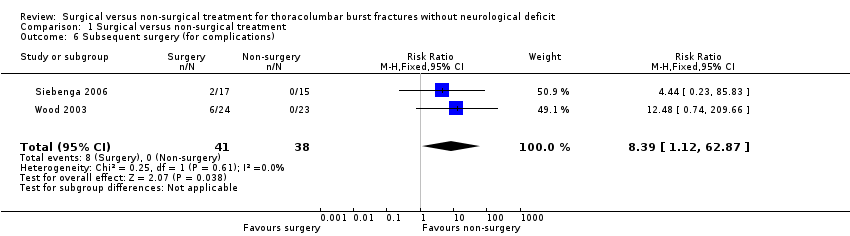
Comparison 1 Surgical versus non‐surgical treatment, Outcome 6 Subsequent surgery (for complications).
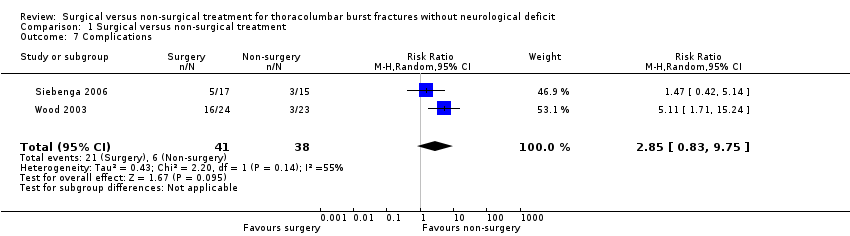
Comparison 1 Surgical versus non‐surgical treatment, Outcome 7 Complications.

Comparison 1 Surgical versus non‐surgical treatment, Outcome 8 Kyphosis at follow‐up (degrees).

Comparison 1 Surgical versus non‐surgical treatment, Outcome 9 Degree of canal compromise (% occlusion) at 2 years.
| VAS pain (0 to 100 mm: no pain) at final follow‐up | VAS spine score (0 to 100 mm: best outcome) at final follow‐up | RMDQ‐24 at final follow‐up | |||
| Surgical | Non‐surgical | Surgical | Non‐surgical | Surgical | Non‐surgical |
| 55 | 80 | 45 | 80 | 14 | 4 |
| 100 | 60 | 100 | 29 | 0 | 15 |
| 95 | 65 | 99 | 55 | 0 | 10 |
| 76 | 15 | 58 | 11 | 13 | 24 |
| 90 | 65 | 94 | 54 | 2 | 9 |
| 100 | 98 | 86 | 94 | 0 | 0 |
| 100 | 90 | 100 | 82 | 0 | 13 |
| 100 | 65 | 65 | 53 | 2 | 14 |
| 95 | 100 | 62 | 100 | 0 | 0 |
| 79 | 100 | 74 | 86 | 1 | 0 |
| 100 | 65 | 86 | 34 | 0 | 15 |
| 70 | 65 | 89 | 56 | 6 | 10 |
| 82 | 80 | 76 | 80 | 5 | 0 |
| 99 | 55 | 92 | 46 | 0 | 15 |
| 86 | 80 | 90 | 62 | 2 | 5 |
| 80 | 74 | 3 | |||
| 77 | 88 | 4 | |||
| VAS = visual analogue scale | |||||
| VAS pain (0 to 10 cm: worst) | Roland and Morris Questionnaire | Oswestry Questionnaire | |||
| Surgical | Non‐surgical | Surgical | Non‐surgical | Surgical | Non‐surgical |
| 1 | 2 | 5 | ** | 4 | ** |
| 1 | 5 | 3 | 12 | 4 | 50 |
| 1.5 | 0 | 6 | 1 | 14 | 0 |
| 5 | 2 | 16 | 0 | 20 | 2 |
| 1 | 1 | 1 | 2 | 6 | 4 |
| 5 | 5 | 10 | 3 | 24 | 12 |
| 3 | 2 | 13 | 0 | 30 | 2 |
| 0 | 0 | 1 | 0 | 2 | 0 |
| 5 | 1 | 4 | 0 | 20 | 0 |
| 2 | 1.5 | 4 | 2 | 24 | 12 |
| 2 | 0 | 6 | 0 | 20 | 0 |
| 7.5 | 0 | 19 | 1 | 40 | 0 |
| 6 | 0 | 14 | 2 | 30 | 10 |
| 1 | 1 | 0 | 0 | 0 | 2 |
| 1 | 9 | 7 | 24 | 16 | 52 |
| 4 | 0 | 2 | 0 | 8 | 0 |
| 4 | 1 | 9 | 1 | 34 | 6 |
| 3 | 8 | 6 | 20 | 18 | 20 |
| 7 | 4 | 19 | 9 | 40 | 22 |
| 6 | 1 | 15 | 2 | 48 | 22 |
| 1 | 0 | 6 | 1 | 44 | 4 |
| 6 | 0 | 19 | ** | 48 | ** |
| 1 | 1 | 5 | 1 | 0 | 4 |
| 5 | 6 | 4 | |||
| ** = missing value | |||||
| Domain | Surgery | Non‐surgery | P Value |
| Pain | 59 | 72 | 0.07 |
| Health Perception | 69 | 72 | 0.4 |
| Physical Function | 63 | 86 | 0.002 |
| Social Function | 84 | 83 | 0.8 |
| Role; Physical | 51 | 85 | 0.003 |
| Role; Emotional | 80 | 78 | 0.92 |
| Mental Health | 81 | 75 | 0.3 |
| Energy/Fatigue | 84 | 56 | 0.8 |
| Complications | ||||
| Surgical | Non‐surgical | Surgical | Non‐surgical | |
| Wound dehiscence | 2 | |||
| Instrumentation/bone failure | 2 | 1 | ||
| Wound infection | 1 deep | 2 (1 deep) | ||
| Pseudarthrosis | 1 | |||
| Neurapraxia | 1 | |||
| Ketoacidosis | 1 | |||
| Instrumentation break | 2 | 1 | ||
| Urinary tract infection | 2 | 1 | ||
| Seroma | 1 | |||
| Instrumentation removal (for complication) | 6 | 2 | ||
| Skin blisters | 1 | |||
| Severe pain at the bone harvest site | 1 | |||
| Conus medullaris syndrome | 1 | |||
| Continued use of orthosis reflecting irrational fear | 1 | |||
| Scoliosis (and signs of nerve root compression) | 1 | |||
| Total | 19 | 2 | 7 | 3 |
| Note there are repeated counts in this table. | ||||
| RMDQ‐24 | VAS spine score | VAS pain | ||||
| LSA | RSA | LSA | RSA | LSA | RSA | |
| r = ‐0.30, P = 0.09 | r= ‐0.29, P = 0.11 | r = 0.20, P = 0.29 | r = 0.17, P = 0.38 | r = 0.20, P = 0.29 | r = 0.17, P = 0.38 | |
| kyphosis and pain score | Roland and Morris questionnaire | Oswestry questionnaire | ||||
| Surgical group | r = 0.05; P = 0.8 | r = 0.05; P = 0.8 | r = 0.3; P = 0.14 | |||
| Non‐surgical group | r = 0.22; P = 0.29 | r = 0.19; P = 0.39 | r = 0.25; P = 0.27 | |||
| LSA = local sagittal angle | ||||||
| Outcome or subgroup title | No. of studies | No. of participants | Statistical method | Effect size |
| 1 Visual Analogue Pain Scores (0 to 100 mm: worst) at follow‐up Show forest plot | 2 | Mean Difference (IV, Fixed, 95% CI) | Totals not selected | |
| 2 Roland and Morris Questionnaire at follow‐up (0 to 24: worst result) Show forest plot | 2 | Mean Difference (IV, Fixed, 95% CI) | Totals not selected | |
| 3 Visual Analogue Scale Spine Score (0 to 100 mm: best) at follow‐up Show forest plot | 1 | Mean Difference (IV, Fixed, 95% CI) | Totals not selected | |
| 4 Oswestry Questionnaire at minimum 24 months follow‐up Show forest plot | 1 | Mean Difference (IV, Fixed, 95% CI) | Totals not selected | |
| 5 Return to work Show forest plot | 2 | Risk Ratio (M‐H, Fixed, 95% CI) | Totals not selected | |
| 6 Subsequent surgery (for complications) Show forest plot | 2 | 79 | Risk Ratio (M‐H, Fixed, 95% CI) | 8.39 [1.12, 62.87] |
| 7 Complications Show forest plot | 2 | 79 | Risk Ratio (M‐H, Random, 95% CI) | 2.85 [0.83, 9.75] |
| 8 Kyphosis at follow‐up (degrees) Show forest plot | 2 | Mean Difference (IV, Fixed, 95% CI) | Totals not selected | |
| 9 Degree of canal compromise (% occlusion) at 2 years Show forest plot | 1 | Mean Difference (IV, Fixed, 95% CI) | Totals not selected | |