Tratamiento quirúrgico versus no quirúrgico para las fracturas toracolumbares por estallido sin déficit neurológico
Appendices
Appendix 1. Search strategies
The Cochrane Library (Wiley Online Library)
#1 MeSH descriptor Spinal Injuries explode all trees (597)
#2 MeSH descriptor Lumbar Vertebrae, this term only (1738)
#3 MeSH descriptor Thoracic Vertebrae, this term only (255)
#4 (#2 OR #3) (1870)
#5 (#1 AND #4) (137)
#6 (burst or compression) :ti,ab,kw (3990)
#7 (#5 AND #6) (36)
#8 (thoracolumbar or (thoraco NEXT lumbar)) :ti,ab,kw (131)
#9 ((burst NEAR fract*) or (burst NEAR injur*) or (compression NEAR fract*)) :ti,ab,kw (267)
#10 (#8 AND #9) (37)
#11 (#7 OR #10) (39)
MEDLINE (Ovid Online)
1 exp Spinal Injuries/ (16163)
2 Thoracic Vertebrae/ (14419)
3 Lumbar Vertebrae/ (35605)
4 or/2‐3 (43539)
5 and/1,4 (4248)
6 burst.tw. (30639)
7 and/5‐6 (552)
8 (thoracolumbar or thoraco lumbar).tw. (5133)
9 ((burst adj5 (fract$ or injur$)) or (compression adj5 (fract$ or injur$))).tw. (5670)
10 and/8‐9 (632)
11 or/7,10 (808)
12 randomized controlled trial.pt. (336136)
13 controlled clinical trial.pt. (85111)
14 Randomized Controlled Trials/ (82897)
15 Random Allocation/ (75700)
16 Double Blind Method/ (116905)
17 Single Blind Method/ (16674)
18 or/12‐17 (563705)
19 Animals/ not Humans/ (3686416)
20 18 not 19 (521244)
21 clinical trial.pt. (473453)
22 exp Clinical Trials as topic/ (260609)
23 (clinic$ adj25 trial$).tw. (214213)
24 ((singl$ or doubl$ or trebl$ or tripl$) adj25 (blind$ or mask$)).tw. (118294)
25 Placebos/ (31302)
26 placebo$.tw. (138905)
27 random$.tw. (574532)
28 Research Design/ (67613)
29 or/21‐28 (1186313)
30 29 not 19 (1095797)
31 30 not 20 (618404)
32 Comparative Study.pt. (1602137)
33 Evaluation Studies.pt. (171413)
34 Follow Up Studies/ (454503)
35 Prospective Studies/ (326935)
36 (control$ or prospectiv$ or volunteer$).tw. (2560395)
37 or/32‐36 (4253242)
38 37 not 19 (3297829)
39 38 not (20 or 31) (2689468)
40 20 or 31 or 39 (3829116)
41 11 and 40 (348)
EMBASE (Ovid Online)
1 Spine Fracture/ or Spine Injury/ (15502)
2 Vertebra Fracture/ (8813)
3 or/1‐2 (23778)
4 Thoracolumbar Spine/ (3154)
5 and/3‐4 (1235)
6 burst.tw. (35332)
7 and/5‐6 (297)
8 (thoracolumbar or thoraco lumbar).tw. (6440)
9 (burst adj5 (fract$ or injur$)).tw. (1260)
10 and/8‐9 (571)
11 or/7,10 (589)
12 exp Randomized Controlled Trial/ (328650)
13 exp Double Blind Procedure/ (110736)
14 exp Single Blind Procedure/ (16360)
15 exp Crossover Procedure/ (34922)
16 Controlled Study/ (3858969)
17 or/12‐16 (3937818)
18 ((clinical or controlled or comparative or placebo or prospective$ or randomi#ed) adj3 (trial or study)).tw. (643947)
19 (random$ adj7 (allocat$ or allot$ or assign$ or basis$ or divid$ or order$)).tw. (156994)
20 ((singl$ or doubl$ or trebl$ or tripl$) adj7 (blind$ or mask$)).tw. (146813)
21 (cross?over$ or (cross adj1 over$)).tw. (62664)
22 ((allocat$ or allot$ or assign$ or divid$) adj3 (condition$ or experiment$ or intervention$ or treatment$ or therap$ or control$ or group$)).tw. (196768)
23 or/18‐22 (961563)
24 or/17,23 (4412295)
25 limit 24 to human (2676479)
26 and/11,25 (185)
Chinese Biomedical Literature database
1. exp Spinal Injuries/
2. Thoracic Vertebrae/
3. Lumbar Vertebrae/
4. or/2‐3
5. and/1,4
6. burst.tw.
7. and/5‐6
8. (thoracolumbar or thoraco lumbar).tw.
9. ((burst and (fract? or injur?)) or (compression and (fract? or injur?))).tw.
10. and/8‐9
11. or/7,10
12. randomised controlled trial.pt.
13. controlled clinical trial.pt.
14. Randomized Controlled Trials/
15. Random Allocation/
16. Double‐Blind Method/
17. Single‐Blind Method/
18. or/12‐17
19. Animal/ and not Human/
20. 18 and not 19
21. clinical trial.pt.
22. exp Clinical Trials/
23. (clinic? and trial?).tw.
24. ((singl? or doubl? or trebl? or tripl?) and (mask? or blind?)).tw.
25. Placebos/
26. placebo?.tw.
27. random?.tw.
28. Research Design/
29. (latin and square).tw.
30. or/21‐29
31. 30 and not 19
32. 31 and not 20
33. Comparative Study/
34. exp Evaluation Studies/
35. Follow‐Up Studies/
36. Prospective Studies/
37. (control? or prospectiv? or volunteer?).tw.
38. Cross‐Over Studies/
39. or/33‐38
40. 39 and not 19
41. 40 and not (20 or 32)
42. or/20,32,41
43. and/11,20
44. and/11,32
45. and/11,41
46. or/43‐45 (1)

Risk of bias graph: review authors' judgements about each risk of bias item presented as percentages across all included studies.

Risk of bias summary: review authors' judgements about each risk of bias item for each included study.

Comparison 1 Surgical versus non‐surgical treatment, Outcome 1 Visual Analogue Pain Scores (0 to 100 mm: worst) at follow‐up.
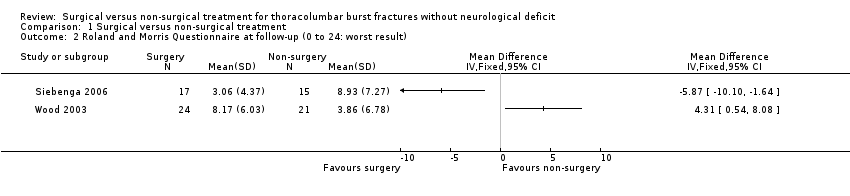
Comparison 1 Surgical versus non‐surgical treatment, Outcome 2 Roland and Morris Questionnaire at follow‐up (0 to 24: worst result).
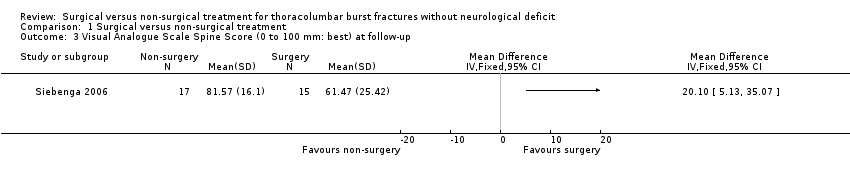
Comparison 1 Surgical versus non‐surgical treatment, Outcome 3 Visual Analogue Scale Spine Score (0 to 100 mm: best) at follow‐up.

Comparison 1 Surgical versus non‐surgical treatment, Outcome 4 Oswestry Questionnaire at minimum 24 months follow‐up.
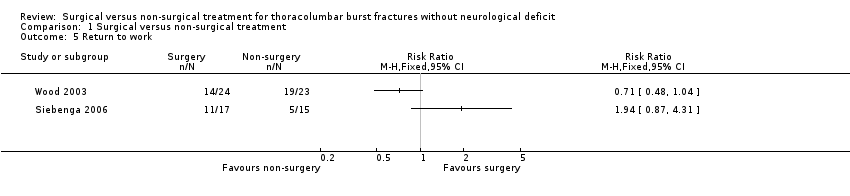
Comparison 1 Surgical versus non‐surgical treatment, Outcome 5 Return to work.
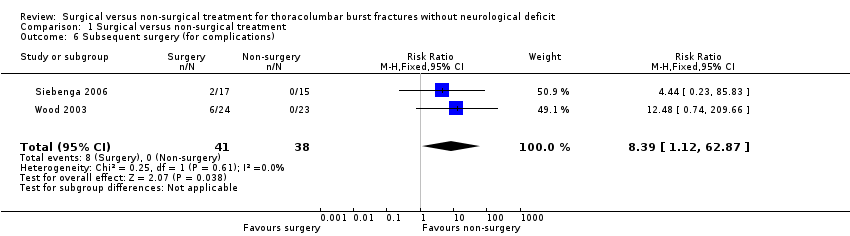
Comparison 1 Surgical versus non‐surgical treatment, Outcome 6 Subsequent surgery (for complications).
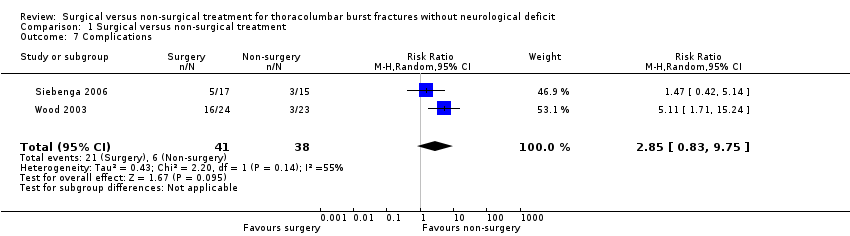
Comparison 1 Surgical versus non‐surgical treatment, Outcome 7 Complications.

Comparison 1 Surgical versus non‐surgical treatment, Outcome 8 Kyphosis at follow‐up (degrees).

Comparison 1 Surgical versus non‐surgical treatment, Outcome 9 Degree of canal compromise (% occlusion) at 2 years.
| VAS pain (0 to 100 mm: no pain) at final follow‐up | VAS spine score (0 to 100 mm: best outcome) at final follow‐up | RMDQ‐24 at final follow‐up | |||
| Surgical | Non‐surgical | Surgical | Non‐surgical | Surgical | Non‐surgical |
| 55 | 80 | 45 | 80 | 14 | 4 |
| 100 | 60 | 100 | 29 | 0 | 15 |
| 95 | 65 | 99 | 55 | 0 | 10 |
| 76 | 15 | 58 | 11 | 13 | 24 |
| 90 | 65 | 94 | 54 | 2 | 9 |
| 100 | 98 | 86 | 94 | 0 | 0 |
| 100 | 90 | 100 | 82 | 0 | 13 |
| 100 | 65 | 65 | 53 | 2 | 14 |
| 95 | 100 | 62 | 100 | 0 | 0 |
| 79 | 100 | 74 | 86 | 1 | 0 |
| 100 | 65 | 86 | 34 | 0 | 15 |
| 70 | 65 | 89 | 56 | 6 | 10 |
| 82 | 80 | 76 | 80 | 5 | 0 |
| 99 | 55 | 92 | 46 | 0 | 15 |
| 86 | 80 | 90 | 62 | 2 | 5 |
| 80 | 74 | 3 | |||
| 77 | 88 | 4 | |||
| VAS = visual analogue scale | |||||
| VAS pain (0 to 10 cm: worst) | Roland and Morris Questionnaire | Oswestry Questionnaire | |||
| Surgical | Non‐surgical | Surgical | Non‐surgical | Surgical | Non‐surgical |
| 1 | 2 | 5 | ** | 4 | ** |
| 1 | 5 | 3 | 12 | 4 | 50 |
| 1.5 | 0 | 6 | 1 | 14 | 0 |
| 5 | 2 | 16 | 0 | 20 | 2 |
| 1 | 1 | 1 | 2 | 6 | 4 |
| 5 | 5 | 10 | 3 | 24 | 12 |
| 3 | 2 | 13 | 0 | 30 | 2 |
| 0 | 0 | 1 | 0 | 2 | 0 |
| 5 | 1 | 4 | 0 | 20 | 0 |
| 2 | 1.5 | 4 | 2 | 24 | 12 |
| 2 | 0 | 6 | 0 | 20 | 0 |
| 7.5 | 0 | 19 | 1 | 40 | 0 |
| 6 | 0 | 14 | 2 | 30 | 10 |
| 1 | 1 | 0 | 0 | 0 | 2 |
| 1 | 9 | 7 | 24 | 16 | 52 |
| 4 | 0 | 2 | 0 | 8 | 0 |
| 4 | 1 | 9 | 1 | 34 | 6 |
| 3 | 8 | 6 | 20 | 18 | 20 |
| 7 | 4 | 19 | 9 | 40 | 22 |
| 6 | 1 | 15 | 2 | 48 | 22 |
| 1 | 0 | 6 | 1 | 44 | 4 |
| 6 | 0 | 19 | ** | 48 | ** |
| 1 | 1 | 5 | 1 | 0 | 4 |
| 5 | 6 | 4 | |||
| ** = missing value | |||||
| Domain | Surgery | Non‐surgery | P Value |
| Pain | 59 | 72 | 0.07 |
| Health Perception | 69 | 72 | 0.4 |
| Physical Function | 63 | 86 | 0.002 |
| Social Function | 84 | 83 | 0.8 |
| Role; Physical | 51 | 85 | 0.003 |
| Role; Emotional | 80 | 78 | 0.92 |
| Mental Health | 81 | 75 | 0.3 |
| Energy/Fatigue | 84 | 56 | 0.8 |
| Complications | ||||
| Surgical | Non‐surgical | Surgical | Non‐surgical | |
| Wound dehiscence | 2 | |||
| Instrumentation/bone failure | 2 | 1 | ||
| Wound infection | 1 deep | 2 (1 deep) | ||
| Pseudarthrosis | 1 | |||
| Neurapraxia | 1 | |||
| Ketoacidosis | 1 | |||
| Instrumentation break | 2 | 1 | ||
| Urinary tract infection | 2 | 1 | ||
| Seroma | 1 | |||
| Instrumentation removal (for complication) | 6 | 2 | ||
| Skin blisters | 1 | |||
| Severe pain at the bone harvest site | 1 | |||
| Conus medullaris syndrome | 1 | |||
| Continued use of orthosis reflecting irrational fear | 1 | |||
| Scoliosis (and signs of nerve root compression) | 1 | |||
| Total | 19 | 2 | 7 | 3 |
| Note there are repeated counts in this table. | ||||
| RMDQ‐24 | VAS spine score | VAS pain | ||||
| LSA | RSA | LSA | RSA | LSA | RSA | |
| r = ‐0.30, P = 0.09 | r= ‐0.29, P = 0.11 | r = 0.20, P = 0.29 | r = 0.17, P = 0.38 | r = 0.20, P = 0.29 | r = 0.17, P = 0.38 | |
| kyphosis and pain score | Roland and Morris questionnaire | Oswestry questionnaire | ||||
| Surgical group | r = 0.05; P = 0.8 | r = 0.05; P = 0.8 | r = 0.3; P = 0.14 | |||
| Non‐surgical group | r = 0.22; P = 0.29 | r = 0.19; P = 0.39 | r = 0.25; P = 0.27 | |||
| LSA = local sagittal angle | ||||||
| Outcome or subgroup title | No. of studies | No. of participants | Statistical method | Effect size |
| 1 Visual Analogue Pain Scores (0 to 100 mm: worst) at follow‐up Show forest plot | 2 | Mean Difference (IV, Fixed, 95% CI) | Totals not selected | |
| 2 Roland and Morris Questionnaire at follow‐up (0 to 24: worst result) Show forest plot | 2 | Mean Difference (IV, Fixed, 95% CI) | Totals not selected | |
| 3 Visual Analogue Scale Spine Score (0 to 100 mm: best) at follow‐up Show forest plot | 1 | Mean Difference (IV, Fixed, 95% CI) | Totals not selected | |
| 4 Oswestry Questionnaire at minimum 24 months follow‐up Show forest plot | 1 | Mean Difference (IV, Fixed, 95% CI) | Totals not selected | |
| 5 Return to work Show forest plot | 2 | Risk Ratio (M‐H, Fixed, 95% CI) | Totals not selected | |
| 6 Subsequent surgery (for complications) Show forest plot | 2 | 79 | Risk Ratio (M‐H, Fixed, 95% CI) | 8.39 [1.12, 62.87] |
| 7 Complications Show forest plot | 2 | 79 | Risk Ratio (M‐H, Random, 95% CI) | 2.85 [0.83, 9.75] |
| 8 Kyphosis at follow‐up (degrees) Show forest plot | 2 | Mean Difference (IV, Fixed, 95% CI) | Totals not selected | |
| 9 Degree of canal compromise (% occlusion) at 2 years Show forest plot | 1 | Mean Difference (IV, Fixed, 95% CI) | Totals not selected | |