Tratamiento quirúrgico versus no quirúrgico para las fracturas toracolumbares por estallido sin déficit neurológico
Resumen
Antecedentes
Las fracturas por estallido de la columna vertebral son el resultado del fallo de las columnas anterior y media de la columna vertebral bajo cargas de compresión axial. El tratamiento conservador es a través del reposo en cama y la inmovilización una vez que los síntomas agudos se han resuelto. El tratamiento quirúrgico implica la estabilización anterior o posterior de la fractura, a veces con descompresión que implica la eliminación de fragmentos de hueso que se han introducido en el canal vertebral. Esta es una actualización de una revisión publicada por primera vez en 2006.
Objetivos
Comparar los resultados del tratamiento quirúrgico con el no quirúrgico para las fracturas toracolumbares por estallido sin déficit neurológico.
Métodos de búsqueda
Se realizaron búsquedas en el registro especializado del Grupo Cochrane de Lesiones óseas, articulares y musculares (Cochrane Bone, Joint and Muscle Trauma Group) (octubre de 2012), en el Registro Cochrane Central de Ensayos Controlados (Cochrane Central Register of Controlled Trials) (CENTRAL) (la Cochrane Library 2012, Número 8), MEDLINE (1946 a octubre de 2012), EMBASE (1980 a octubre de 2012) y en la Chinese Biomedical Literature Database (1978 a octubre de 2012). También se hicieron búsquedas en registros de ensayos y en las listas de referencias de los artículos.
Criterios de selección
Ensayos controlados aleatorios o cuasialeatorios que compararon el tratamiento quirúrgico con el no quirúrgico de las fracturas toracolumbares por estallido sin déficit neurológico.
Obtención y análisis de los datos
Dos autores de la revisión, de forma independiente, evaluaron el riesgo de sesgo y extrajeron los datos. Sólo se realizó una agrupación limitada de los datos.
Resultados principales
Se incluyeron dos ensayos que compararon el tratamiento quirúrgico con el no quirúrgico en pacientes con fracturas toracolumbares por estallido sin déficit neurológico. Éstos reclutaron un total de 87 participantes e informaron los resultados de 79 participantes en un seguimiento de dos años o más. Ambos ensayos se consideraron con riesgo incierto de sesgo de selección y alto riesgo de sesgos de realización y de detección, como resultado de la falta de cegamiento.
Los dos ensayos informaron de resultados contrastantes en cuanto al dolor y los resultados relacionados con la funcionalidad en el seguimiento final, y en la cantidad de los que retornaron al trabajo. Un ensayo encontró menos dolor (diferencia de medias [DM] ‐15,09 mm; IC del 95%: ‐27,81 a ‐2,37; escala analógica visual de 100 mm), y mejor funcionalidad según los resultados del Roland and Morris disability questionnaire (DM ‐5,87; IC del 95%: ‐10,10 a ‐1,64; 24 puntos = máxima discapacidad) en el grupo quirúrgico. Sobre la base de las mismas medidas de resultado, el otro ensayo encontró que el grupo quirúrgico presentó más dolor (DM 13,60 mm; IC del 95%: ‐0,31 a 27,51) y peor funcionalidad (DM 4,31; IC del 95%: 0,54 a 8,08). Ninguno de los dos ensayos informó de una diferencia estadísticamente significativa en el retorno al trabajo. Hubo un mayor número de participantes con complicaciones en el grupo quirúrgico de ambos ensayos (21/41 versus 6/38; RR 2,85; IC del 95%: 0,83 a 9,75; dos ensayos), y sólo los participantes de este grupo se sometieron a una cirugía posterior, que incluyó la extracción del implante ya sea por complicaciones o por rutina. Un ensayo informó que la cirugía fue cuatro veces más costosa que el tratamiento no quirúrgico.
Conclusiones de los autores
La evidencia contradictoria proporcionada por dos ensayos controlados aleatorizados pequeños y potencialmente sesgados no es suficiente para determinar si el tratamiento quirúrgico o no quirúrgico provoca un dolor más intenso y resultados funcionales superiores en los pacientes con fracturas toracolumbares por estallido sin déficit neurológico. Sin embargo, es probable que la cirugía se asocie con más complicaciones tempranas y la necesidad de una cirugía posterior, así como con mayores costos iniciales de atención médica.
Resumen en términos sencillos
Tratamiento quirúrgico versus no quirúrgico para las fracturas toracolumbares por estallido sin déficit neurológico
La región toracolumbar de la columna vertebral está compuesta por la columna torácica (espalda media) y lumbar (espalda baja). Un tipo de lesión de la columna vertebral es la fractura por estallido, en la que una vértebra (uno de los varios huesos que componen la columna vertebral) se fractura (rompe) de tal manera que pierde altura tanto en la parte trasera como en la delantera. Este tipo de fractura se produce con mayor frecuencia en los huesos situados en la unión de la columna torácica y lumbar. Estas lesiones suelen ser el resultado de un accidente de alta velocidad, como un choque de un vehículo motor. Se trata de lesiones graves, sobre todo cuando la médula espinal también está dañada, ya que puede provocar la pérdida parcial o total de las funciones sensoriales y motoras de las piernas, y la disfunción de la vejiga o el intestino. Esta revisión sólo incluyó a los pacientes cuyo tejido nervioso no estaba dañado, aunque fue posible descartar un daño posterior. Los pacientes son tratados en el hospital ya sea de manera conservadora, colocándolos en una posición acostada que reduce la tensión en esa parte de la columna vertebral y luego colocándoles un yeso o un aparato ortopédico para que puedan moverse, o quirúrgicamente, estabilizando la parte afectada de la columna vertebral mediante diversos implantes y procedimientos.
Se incluyeron los datos de dos ensayos con 87 participantes. Los ensayos compararon el tratamiento quirúrgico con el no quirúrgico para estas fracturas en la región toracolumbar de la columna vertebral. Ambos ensayos tuvieron limitaciones en sus métodos que podían reducir la fiabilidad de sus resultados. Informaron de resultados contrastantes en cuanto al dolor y la funcionalidad del paciente al menos dos años después del tratamiento. Un estudio encontró que los pacientes presentaron menos dolor y mejor funcionalidad después de la cirugía en comparación con los pacientes que no se habían sometido a una cirugía. El otro ensayo encontró lo contrario. Ambos ensayos encontraron que hubo más complicaciones tempranas en el grupo quirúrgico y sólo los participantes de este grupo se sometieron a una cirugía adicional posterior. Esto implicó la remoción del implante, ya sea para resolver una complicación o de manera rutinaria. Un ensayo informó que la cirugía fue cuatro veces más costosa que el tratamiento no quirúrgico.
La revisión concluyó que la evidencia débil proveniente de estos dos ensayos no fue suficiente para determinar si la cirugía o el tratamiento no quirúrgico fue mejor para estas fracturas. Sin embargo, es probable que la cirugía se asocie con más complicaciones tempranas y la necesidad de una cirugía posterior, así como con mayores costos iniciales de atención médica.
Authors' conclusions
Background
Description of the condition
Spinal burst fractures result from failure of both the anterior and the middle columns of the spine under axial compression loads, frequently associated with flexion loading. In the three column theory of spinal stability (Denis 1983), the anterior column is composed of the anterior part of the vertebral body and its adjacent soft tissue complex; the middle column consists of the posterior half of the vertebral body and the soft tissue complex; and the posterior column is formed by the osseous and ligamentous structures posterior to the vertebral body.
Thoracolumbar burst fractures account for up to 17% of major spinal fractures (Denis 1983). Males are at four times higher risk than females. Motor vehicle accidents are the commonest cause of injury, followed by falls and sports‐related injuries (Price 1994). Other organ system injuries occur in up to 50% of thoracolumbar trauma patients (Purcell 1981; Weinstein 1988). High‐energy injuries associated with paraplegia have a 7% first‐year mortality rate (Shikata 1990). The incidence of neurological deficit resulting from thoracolumbar burst fractures is estimated to be 50% to 60% (Denis 1983; McEvoy 1985). Most of these fractures occur in the thoracolumbar junction section of the spine, which comprises one or more thoracic vertebrae (10th, 11th and 12th thoracic: T10, T11 and T12) and one or more lumbar vertebrae (first and second lumbar: L1 and L2) according to the various definitions in the literature. Common definitions of this section are T10 to L2, T11 to L2 and T12 to L2 (Denis 1983; McEvoy 1985). The junction forms a transition zone between the relatively fixed and kyphotic thoracic spine above and the relatively mobile and lordotic lumbar spine below, which causes stress forces to concentrate upon the thoracolumbar vertebral column and predisposes this area to injury (Gertzbein 1992).
The clinical features of thoracolumbar fracture include acute back pain, limited motion, and swelling at the fracture site. Damage to the nerve root or spinal cord, or both, from protruding fragments of vertebral body may result in partial loss of sensory and motor function in the lower extremity or, in cases of severe disruption, may produce full paralysis, urinary and fecal incontinence, and permanent neurological injury. Characteristic radiological findings of the fractures include moderate to marked anterior wedging of the vertebral body, an increased interpedicular distance and narrowing of the spinal canal as a result of displacement of vertebral body fragments. Although many thoracolumbar spinal injuries do not result in paralysis, they may leave an unstable spinal segment due to disruption of bony elements and soft tissues. Late paralysis may result from the residual instability (Denis 1983).
The classification of thoracolumbar injury remains controversial. Denis 1983 proposed a classification of thoracolumbar fractures into four types, based on the three column theory, and defined three patterns of instability. The Arbeitsgemeinschaft für osteosynthesefragen (AO) classification system, developed by Müller and colleagues (OTA 1996) and subsequently updated (Marsh 2007), has also been commonly applied in clinical practice. In 2005 a new classification system, the Thoracolumbar Injury Classification and Severity Score (TLICS), was suggested by Vaccaro et al (Vaccaro 2005) in which the classification of the thoracolumbar injury is based on three injury characteristics: 1) morphology of injury determined by radiographic appearance, 2) integrity of the posterior ligamentous complex, and 3) the neurological status of the patient. The calculation of thoracolumbar injury severity score is based on these characteristics, with a higher score indicating a more severe injury.
Description of the intervention
In clinical practice, thoracolumbar burst fractures without neurological deficit are managed either non‐surgically (conservative treatment) or surgically.
Non‐surgical treatments include recumbent bed rest and postural reduction, followed by casting or bracing with early ambulation. In the traditional conservative management of unstable thoracolumbar injuries, the patient was confined to bed, with great attention paid to lordotic posture, for as long as six to eight weeks followed by gradual mobilisation (Bedbrook 1975). However, this regimen resulted in mortality rates as high as 90% (Bedbrook 1975). Holdsworth 1970 recommended postural reduction of the deformity that resulted from the burst fracture, followed by hyperextension casting and patient mobilisation. This resulted in significantly improved morbidity and mortality rates. Postural reduction can produce an indirect decompression of the spinal canal, and a well‐fitted cast or orthosis may also maintain reduction and lessen deformity while late neurologic deterioration is uncommon (Cantor 1993; Chow 1996).
Surgery generally involves open reduction and stabilisation, using either a posterior or anterior approach. Sometimes surgery also involves decompression, where bone fragments that have intruded into the vertebral canal are removed. One now dated technique using the posterior approach involved posterior reduction and stabilisation using the Harrington distraction rod system, a kind of long‐segment fixation. Dickson 1978 demonstrated that this technique produced restoration of vertebral height at the injured level, reduction of the kyphosis, and spinal canal clearance to some degree. However, the instrumentation had some drawbacks. It required fixation of an extensive area of the spine, at least two levels caudal (lower) and three levels cephalad (higher) than the fracture. In addition, it offered only semirigid fixation, thus supplemental external support was often necessary. A more modern and more popular technique for internal fixation is posterior pedicle screw fixation. As summarised in the Cochrane review on pedicle screw fixation for traumatic thoracolumbar fractures, "pedicle screw fixation can be divided into several categories based on the lengths of the fixed segments and of pedicle screws in the injured vertebra" (Cheng 2013). Cheng 2013 refer to three main categories: short‐segment fixation pedicle screw instrumentation where two pedicle screws are inserted above and below the fractured vertebra, respectively (Dick 1985); long‐segment pedicle screw instrumentation where four pedicle screws are inserted into four vertebrae, two above and two below the fractured vertebra, respectively (Tezeren 2005); and monosegmental pedicle screw instrumentation, where pedicle screws are inserted at the level of the fracture and one level adjacent depending on the location of the intact endplate (Liu 2009). Additional procedures include the use of autogenous bone grafts to fuse together adjacent segments (Wang 2006).
How the intervention might work
The goals of treatment for thoracolumbar burst fractures are to obtain early patient mobilisation and a painless, balanced, stable vertebral column with maximum spine mobility and optimal neurological function (Eskenazi 2000).
Surgical management offers the prospect of immediate stability, correction of deformity, early walking, reduced reliance on casts and braces, and theoretical protection against future neurological deterioration. However, this comes at the cost of surgery‐related morbidity and risk of surgical complications such as infection, hardware‐related problems and fixation failure (McLain 1993), and iatrogenic injury. Advocates of conservative treatment cite cohort studies demonstrating good outcomes, low progression of deformity, less back pain than surgical treatment, satisfactory work status, low incidence of neurological deterioration, progressive bony remodeling and diminution of canal compromise (Cantor 1993; Chow 1996; Weinstein 1988). Although some studies argue that the degree of kyphosis does not correlate to clinical outcomes, others have demonstrated a relationship between significant deformity (> 30 degrees) and increased pain (Gertzbein 1992; Weinstein 1988). Although in one study of non‐surgical treatment, with poor follow‐up, the incidence of late neurological deterioration was 17% (Denis 1984) others have reported much lower rates of between 0% and 3% (Cantor 1993; Chow 1996; Weinstein 1988).
Why it is important to do this review
The decision to treat thoracolumbar burst fractures without neurological deficit surgically or non‐surgically remains controversial (Gnanenthiran 2012; Okuyama 1996). Thus, an update of this systematic review that was first published in 2006 (Yi 2006) assessing the evidence from randomised controlled trials comparing different methods of treatment for patients with thoracolumbar burst fractures without neurological deficit is justified.
Objectives
To compare the outcomes of surgical with non‐surgical treatment for thoracolumbar burst fractures without neurological deficit.
Methods
Criteria for considering studies for this review
Types of studies
Randomised controlled trials and quasi‐randomised trials comparing surgical with non‐surgical treatment of thoracolumbar burst fractures without neurological deficit.
Types of participants
Adults, aged 18 years or over, with a radiologically confirmed, recent (less than three weeks) thoracolumbar burst fracture without neurological deficit.
Types of interventions
Any method of surgical treatment (for example isolated posterior stabilisation with or without decompression, or isolated anterior decompression and stabilisation) versus any method of conservative treatment (including lying down or bed rest, postural reduction followed by casting or bracing, and early ambulation).
Types of outcome measures
Primary outcomes
-
Proportion of patients who recovered according to self or clinician assessment, or both (e.g. pain assessed by visual analogue scale (VAS))
-
Proportion of patients who had an improvement in function measured on a disability or quality of life scale (e.g. Oswestry Disability Scale or Roland‐Morris Disability Questionnaire for low back pain and leg pain (RMDQ‐24))
-
Return to work
-
Rate of subsequent surgery
-
The rate of complications: 1) fatal, 2) life threatening, 3) neurological deterioration, 4) decubitus ulcers, 5) infection, 6) implant failure
Secondary outcomes
-
Sagittal plane kyphosis
-
Sagittal balance of the patient
-
Degree of spinal canal compromise
-
Mean duration of hospitalisation
-
Economic evaluation
We also collected data on the correlation between the final amount of kyphosis or canal compromise and the pain or disability reported.
Search methods for identification of studies
Electronic searches
We searched the Cochrane Bone, Joint and Muscle Trauma Group Specialised Register (September 2012), the Cochrane Central Register of Controlled Trials (CENTRAL) (The Cochrane Library 2012, Issue 8), MEDLINE (1946 to August week 5 2012), EMBASE (1980 to Week 36 2012) and the Chinese Biomedical Literature Database (CBM) (January 1978 to October 2012). No language restrictions were applied.
In MEDLINE (Ovid Online), a subject‐specific search was combined with all three phases of the Cochrane optimal trial search strategy (Higgins 2005) and modified for use in The Cochrane Library, EMBASE and the Chinese Biomedical Literature database. These search strategies can be found in Appendix 1.
We searched the WHO International Clinical Trials Registry Platform for ongoing and unpublished trials (October 2012).
Searching other resources
We searched references lists of articles and contacted authors of relevant trials.
Data collection and analysis
Selection of studies
One review author (MA) scanned the results of the search, and retrieved the full articles for all potentially relevant trials. Two review authors (MA and TXW) independently assessed each of these trials for inclusion and scrutinised each trial report for multiple publications from the same data set. We resolved any disagreement through discussion.
Data extraction and management
Two review authors (MA and TXW) independently extracted data using a piloted data extraction form. We extracted data on study characteristics including methods, participants, interventions, and outcomes. We resolved any disagreements by referring to the trial report and through discussion. Where individual patient data were available, we calculated means and standard deviations for continuous outcomes.
Assessment of risk of bias in included studies
Three review authors (MA, XYK and TXW) independently assessed the risk of bias of each trial in terms of generation of allocation sequence, allocation concealment, blinding (of participants, treatment providers and outcome assessors), completeness of outcome data, selective reporting and other bias using the criteria of the Cochrane Collaboration's 'Risk of bias' tool (Higgins 2011). Based on these criteria, risk of bias for the individual domains was assessed as: high, low or unclear. All inter‐rater differences were resolved by discussion.
Measures of treatment effect
Risk ratios and 95% confidence intervals were calculated for dichotomous outcomes, and mean differences and 95% confidence intervals were calculated for continuous outcomes.
Dealing with missing data
We tried to contact the original trial authors for missing data and information. We performed intention‐to‐treat analyses where possible. We did not impute missing standard deviations.
Assessment of heterogeneity
We assessed heterogeneity using the Cochrane Q statistic with significance set at a P value of less than 0.10. We used the I² statistic to estimate the percentage of heterogeneity between trials (Higgins 2011; Chapter 9):
-
0% to 40%, might not be important;
-
30% to 60%, may represent moderate heterogeneity;
-
50% to 90%, may represent substantial heterogeneity;
-
75% to 100%, considerable heterogeneity.
Assessment of reporting biases
When a sufficient number of trials (10 or more) become available, we plan to assess publication bias by using funnel plots.
Data synthesis
We did not pool data where there was statistically significant heterogeneity. Where it was appropriate to pool data, we initially used the fixed‐effect model. However, if substantial and unexplained heterogeneity was detected, we used the random‐effects model. We used 95% confidence intervals throughout. Should pooling of continuous outcome data based on different scales be undertaken in the future, we plan to calculate standardised mean differences.
Subgroup analysis and investigation of heterogeneity
When there are sufficient numbers of trials, we intend to explore the effects of different study characteristics to determine possible causes of heterogeneity. Subgroup analyses will be performed based on different age groups, different genders, and different types of surgery. We will investigate whether the results of subgroups are significantly different by inspecting the overlap of confidence intervals and performing the test for subgroup differences available in RevMan.
Sensitivity analysis
We planned to test the robustness of the evidence by sensitivity analysis of pooled data in three ways:
-
repeating the analysis excluding unpublished studies (if any);
-
repeating the analysis excluding studies at high or unknown risk of selection bias from inadequate methods of sequence generation and allocation concealment;
-
comparing the results of the fixed‐effect model to the random‐effects model (robust evidence should not be reversed by changing the model).
Results
Description of studies
Results of the search
Overall, for this update (search completed October 2012) and for the previous version (search completed June 2005) of the review, a total of 597 records were screened from the following databases: Cochrane Bone, Joint and Muscle Trauma Group Specialised Register (24 records); CENTRAL (39); MEDLINE (348); EMBASE (185); and the Chinese Biomedical Literature Database (1). We did not identify any potentially eligible studies from other sources.
The search update resulted in the identification of one new included study (Siebenga 2006) and one new excluded study (Wan 2005).
In total, there are two included trials (Siebenga 2006; Wood 2003), two excluded studies (Shen 2001;Wan 2005) and no studies awaiting classification. We did not identify any ongoing trials.
Included studies
See the Characteristics of included studies for details of the two included studies.
Design
Both studies (Siebenga 2006;Wood 2003) were randomised using a parallel design. Siebenga 2006 was a multicentre study and Wood 2003 was conducted at one centre with patients recruited from three associated trauma facilities.
Sample sizes
Siebenga 2006 recruited 34 participants and reported results for 32 participants. Wood 2003 recruited 53 participants, reporting results for 47 participants.
Setting
Siebenga 2006 was conducted in Gemany and the Netherlands, and Wood 2003 was conducted in Minneapolis, USA.
Participants
Both trials recruited patients with thoracolumbar fractures without neurological deficit. Where stated, the distribution of fracture sites was T12 (8 patients), L1 (18), L2 (2), L3 (3) and L4 (1) in Siebenga 2006; and T11 (1), T12 (8), L1 (28) and L2 (10) in Wood 2003. Patient characteristics were provided only for those followed‐up in both trials. The mean age of these participants was 41.8 years in Siebenga 2006 and 41.4 years in Wood 2003. There were more males than females in both trials: 20 males and 12 females in Siebenga 2006; and 32 males and 15 females in Wood 2003.
Interventions
Siebenga 2006 compared surgical treatment with short‐segment posterior stabilisation followed by a Jewett hyperextension orthosis for three months versus non‐surgical therapy involving horizontal bed rest for a minimum of five days and a Jewett hyperextension orthosis for three months.
In Wood 2003, the participants in the surgical group were treated with posterior or anterior arthrodesis and instrumentation, while the non‐surgical intervention involved the application of a body cast or orthosis.
Outcomes
The mean length of follow‐up in Siebenga 2006 was 4.3 years (range 2.0 to 6.6 years). In Wood 2003, the mean duration of follow‐up was 44 months (range 24 to 118 months).
Siebenga 2006 reported on pain, disability, return to work, complications and subsequent surgery, kyphosis, and length of hospital stay. Individual patient data were available for visual analogue scale (VAS) pain, the VAS spine score (Knop 2001), the Roland and Morris disability questionnaire, and kyphosis.
Wood 2003 reported on pain, disability, quality of life, return to work, complications and subsequent surgery, kyphosis, canal compromise, length of hospital stay, and costs. Individual patient data were available for VAS pain, the Roland and Morris disability questionnaire, the Oswestry back‐pain questionnaire, kyphosis, and degree of canal compromise.
Excluded studies
Two studies were excluded for reasons detailed in the Characteristics of excluded studies.
Risk of bias in included studies
SeeFigure 1 and Figure 2 for summaries of the results of the risk of bias assessment.

Risk of bias graph: review authors' judgements about each risk of bias item presented as percentages across all included studies.
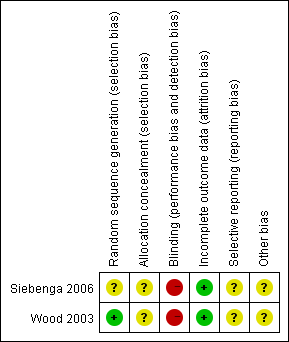
Risk of bias summary: review authors' judgements about each risk of bias item for each included study.
Allocation
Siebenga 2006 gave no details of their randomisation procedure and was judged at unclear risk of bias. Wood 2003 described a blind, computer‐generated randomisation procedure, but gave insufficient details of allocation concealment and thus was judged at unclear risk of selection bias.
Blinding
Performance bias relating to lack of blinding was inevitable in these two trials. Neither study used blinding and thus potentially each was at high risk of detection bias.
Incomplete outcome data
Two patients were lost to follow‐up in Siebenga 2006. In Wood 2003, two participants from each group were lost to follow‐up and two additional patients of the non‐surgical group died from other causes unrelated to their injuries before the final follow‐up could be performed. Both trials were judged at low risk of attrition bias.
Selective reporting
We were unable to check the registered protocol or ethics committee approval to compare the difference according to Chan's measure (Chan 2004), therefore the potential of reporting bias was unclear.
Other potential sources of bias
This was judged as unclear.
Effects of interventions
Although the two included trials had many outcomes in common, their results were significantly heterogeneous for several of these and only limited pooling was performed. As none of the primary outcomes were reported as stipulated in the Types of outcome measures, we presented alternatives from the same categories below. Final follow‐up results (minimum two years in both trials) are presented below unless stated otherwise.
Primary outcomes
Pain
Both trials used a VAS to assess the degree of pain. However, the direction of pain intensity was in opposite directions: in Siebenga 2006, pain was measured using a VAS (0 mm = worst pain imaginable; 100 mm = no pain at all); and in Wood 2003, pain was reported using a 10 cm VAS (0 = no pain; 10 cm = worst pain imaginable). The data from both trials were adjusted for presentation in the analyses so that they had the same direction of effect and scale. We calculated means and standard deviations based on the raw data given in the original articles (Table 1; Table 2).
| VAS pain (0 to 100 mm: no pain) at final follow‐up | VAS spine score (0 to 100 mm: best outcome) at final follow‐up | RMDQ‐24 at final follow‐up | |||
| Surgical | Non‐surgical | Surgical | Non‐surgical | Surgical | Non‐surgical |
| 55 | 80 | 45 | 80 | 14 | 4 |
| 100 | 60 | 100 | 29 | 0 | 15 |
| 95 | 65 | 99 | 55 | 0 | 10 |
| 76 | 15 | 58 | 11 | 13 | 24 |
| 90 | 65 | 94 | 54 | 2 | 9 |
| 100 | 98 | 86 | 94 | 0 | 0 |
| 100 | 90 | 100 | 82 | 0 | 13 |
| 100 | 65 | 65 | 53 | 2 | 14 |
| 95 | 100 | 62 | 100 | 0 | 0 |
| 79 | 100 | 74 | 86 | 1 | 0 |
| 100 | 65 | 86 | 34 | 0 | 15 |
| 70 | 65 | 89 | 56 | 6 | 10 |
| 82 | 80 | 76 | 80 | 5 | 0 |
| 99 | 55 | 92 | 46 | 0 | 15 |
| 86 | 80 | 90 | 62 | 2 | 5 |
| 80 | 74 | 3 | |||
| 77 | 88 | 4 | |||
VAS = visual analogue scale
| VAS pain (0 to 10 cm: worst) | Roland and Morris Questionnaire | Oswestry Questionnaire | |||
| Surgical | Non‐surgical | Surgical | Non‐surgical | Surgical | Non‐surgical |
| 1 | 2 | 5 | ** | 4 | ** |
| 1 | 5 | 3 | 12 | 4 | 50 |
| 1.5 | 0 | 6 | 1 | 14 | 0 |
| 5 | 2 | 16 | 0 | 20 | 2 |
| 1 | 1 | 1 | 2 | 6 | 4 |
| 5 | 5 | 10 | 3 | 24 | 12 |
| 3 | 2 | 13 | 0 | 30 | 2 |
| 0 | 0 | 1 | 0 | 2 | 0 |
| 5 | 1 | 4 | 0 | 20 | 0 |
| 2 | 1.5 | 4 | 2 | 24 | 12 |
| 2 | 0 | 6 | 0 | 20 | 0 |
| 7.5 | 0 | 19 | 1 | 40 | 0 |
| 6 | 0 | 14 | 2 | 30 | 10 |
| 1 | 1 | 0 | 0 | 0 | 2 |
| 1 | 9 | 7 | 24 | 16 | 52 |
| 4 | 0 | 2 | 0 | 8 | 0 |
| 4 | 1 | 9 | 1 | 34 | 6 |
| 3 | 8 | 6 | 20 | 18 | 20 |
| 7 | 4 | 19 | 9 | 40 | 22 |
| 6 | 1 | 15 | 2 | 48 | 22 |
| 1 | 0 | 6 | 1 | 44 | 4 |
| 6 | 0 | 19 | ** | 48 | ** |
| 1 | 1 | 5 | 1 | 0 | 4 |
| 5 | 6 | 4 | |||
** = missing value
VAS = visual analogue scale
The two trials presented opposite and significantly heterogeneous results (Chi² = 8.90, df = 1 (P = 0.003); I² = 89%) for pain and thus we did not pool their data (seeAnalysis 1.1). In Siebenga 2006, the surgically‐treated group had significantly less pain at final follow‐up (MD ‐15.09 mm, 95% CI ‐27.81 to ‐2.37). Wood 2003 found the converse, with the surgical group having more pain at final follow‐up, although the effect did not reach statistical significance (MD 13.60 mm, 95% CI ‐0.31 to 27.51).
Function measured on a disability or quality of life scale
Both trials used the Roland and Morris disability questionnaire (RMDQ‐24) to estimate the functional disability at the time of pre‐injury and at the last follow‐up. We calculated the mean and standard deviation from the raw data given in the original articles (Table 1; Table 2). The two trials presented opposite and significantly heterogeneous results (Chi² = 12.41, df = 1 (P = 0.0004); I² = 92%) and thus we did not pool their data (seeAnalysis 1.2).
In Siebenga 2006, the surgical group had a statistically significantly lower mean RMDQ‐24 score and thus less disability than the non‐surgical group at follow‐up (MD ‐5.87, 95% CI ‐10.10 to ‐1.64). In contrast, the surgical group in Wood 2003 had a statistically significantly higher mean RMDQ‐24 at follow‐up (MD 4.31, 95% CI 0.54 to 8.08).
Siebenga 2006 also reported more favourable results in the surgical group for the VAS spine score at the final follow‐up (MD 20.10 mm, 95% CI 5.13 to 35.07) (seeAnalysis 1.3).
Wood 2003 found statistically significantly higher (thus worse function) Oswestry questionnaire scores (0 to 100: worst function) at the final follow‐up evaluation in the surgical group (mean score 20.8 versus 10.7; MD 10.08; 95% CI 1.02 to 19.14) (seeAnalysis 1.4). Wood 2003 also reported significant differences in favour of the non‐surgical group for two out of eight Short Form (SF)‐36 domains at follow‐up: physical function (mean score 63 versus 86; reported P = 0.002) and role, physical (mean score 51 versus 85; reported P = 0.003). Table 3 presents the results for all eight domains.
| Domain | Surgery | Non‐surgery | P Value |
| Pain | 59 | 72 | 0.07 |
| Health Perception | 69 | 72 | 0.4 |
| Physical Function | 63 | 86 | 0.002 |
| Social Function | 84 | 83 | 0.8 |
| Role; Physical | 51 | 85 | 0.003 |
| Role; Emotional | 80 | 78 | 0.92 |
| Mental Health | 81 | 75 | 0.3 |
| Energy/Fatigue | 84 | 56 | 0.8 |
Return to work
The two trials presented contrasting and heterogeneous results (Chi² = 5.51, df = 1 (P = 0.02); I² = 82%) for return to work and thus we did not pool these data (seeAnalysis 1.5). In Siebenga 2006, 11 of 13 working patients in the surgical group returned to their previous job whereas only five of 13 participants with an employment record in the non‐surgical group resumed working. Of these five, three returned to the same profession and two changed careers for less physically demanding employment. On average, those in the surgical group returned to work sooner after their accident than those in the non‐surgical group (6.7 months (range 1 to 18 months) versus 13.8 months (range 6 to 33 months)). In Wood 2003, 10 of the 24 patients treated surgically returned to work within six months and a further four returned to work subsequently; of these, eight returned to a similar job and six changed to a less physically demanding occupation. In the non‐surgical group, 17 of 23 patients resumed work within six months and a further two returned subsequently; of these, 15 returned to a similar job.
Rate of subsequent surgery and complications
In Wood 2003, two patients in the non‐surgical group who were excluded from the analysis died from causes unrelated to their injuries before the final follow‐up could be performed.
Only surgically‐treated patients in both trials had subsequent surgery (implant removal) for complications (8/41 versus 0/38; RR 8.39, 95% CI 1.12 to 62.87) (seeAnalysis 1.6). Implant removal for the remaining surgical group patients in Siebenga 2006 was scheduled after a period of nine to 12 months. In Wood 2003, the complications rate in the surgical group was higher than in the non‐surgical group (16/24 versus 3/23; RR 5.11, 95% CI 1.71 to 15.24). Siebenga 2006 found no statistically significant difference between two groups (5/17 versus 3/15; RR 1.47, 95% CI 0.42 to 5.14). Pooled data using the random‐effects model because of heterogeneity (Chi² = 2.20, df = 1 (P = 0.14); I² = 55%) showed a non‐statistically significant trend favouring non‐surgical treatment for overall complications (21/41 versus 6/38; RR 2.85, 95% CI 0.83 to 9.75) (seeAnalysis 1.7). The specific complications reported by the two trials are described in Table 4.
| Complications | ||||
| Surgical | Non‐surgical | Surgical | Non‐surgical | |
| Wound dehiscence | 2 | |||
| Instrumentation/bone failure | 2 | 1 | ||
| Wound infection | 1 deep | 2 (1 deep) | ||
| Pseudarthrosis | 1 | |||
| Neurapraxia | 1 | |||
| Ketoacidosis | 1 | |||
| Instrumentation break | 2 | 1 | ||
| Urinary tract infection | 2 | 1 | ||
| Seroma | 1 | |||
| Instrumentation removal (for complication) | 6 | 2 | ||
| Skin blisters | 1 | |||
| Severe pain at the bone harvest site | 1 | |||
| Conus medullaris syndrome | 1 | |||
| Continued use of orthosis reflecting irrational fear | 1 | |||
| Scoliosis (and signs of nerve root compression) | 1 | |||
| Total | 19 | 2 | 7 | 3 |
Note there are repeated counts in this table.
Secondary outcomes
Sagittal plane kyphosis
Because of the considerable statistical heterogeneity between the two trials (Chi² = 8.05, df = 1 (P = 0.005); I² = 88%) we did not pool the data for local kyphosis (seeAnalysis 1.8). Siebenga 2006 reported local and regional sagittal angles; we have only reported on the former here. In the surgical group of this trial, the mean local sagittal angle decreased in the surgical group from 16.8 ° at admission to 8.6 ° at 4.3 years follow‐up. Conversely, the mean local sagittal angle increased in the non‐surgical group from 15.7 ° at admission to 19.8 ° at follow‐up. This trial found significantly less kyophotic deformity after surgery at long‐term follow‐up (MD ‐11.20 °, 95% CI ‐15.50 ° to ‐6.90 °). In the group managed surgically in Wood 2003, the mean kyphosis (according to the picture shown in the article the angles may have been the local sagittal angles) was 10.1 ° on admission and 13 ° at the time of the final follow‐up (minimum of two years). In the non‐surgical group, the mean kyphosis was 11.3 ° on admission and 13.8 ° at final follow‐up. There was no statistical difference at the time of final follow‐up between the two groups in Wood 2003 (MD ‐0.81 °, 95% CI ‐6.56 ° to 4.94 °).
Spinal canal compromise
In both groups of Wood 2003, the degree of spinal canal compromise, estimated using computer tomography, was significantly reduced at two‐year follow‐up compared with that at presentation. There was no statistically significant difference between the two treatment groups at two‐year follow‐up in canal occlusion (% of normal anteroposterior canal diameter estimated from the average of the adjacent uninjured vertebrae) (MD 2.62%, 95% CI ‐6.57% to 11.81%) (seeAnalysis 1.9). Siebenga 2006 did not report this outcome.
Correlation between the final amount of kyphosis or canal compromise and the reported pain or disability
In both trials, there was no correlation between the final amount of kyphosis and the reported pain or disability (seeTable 5).
| RMDQ‐24 | VAS spine score | VAS pain | ||||
| LSA | RSA | LSA | RSA | LSA | RSA | |
| r = ‐0.30, P = 0.09 | r= ‐0.29, P = 0.11 | r = 0.20, P = 0.29 | r = 0.17, P = 0.38 | r = 0.20, P = 0.29 | r = 0.17, P = 0.38 | |
| kyphosis and pain score | Roland and Morris questionnaire | Oswestry questionnaire | ||||
| Surgical group | r = 0.05; P = 0.8 | r = 0.05; P = 0.8 | r = 0.3; P = 0.14 | |||
| Non‐surgical group | r = 0.22; P = 0.29 | r = 0.19; P = 0.39 | r = 0.25; P = 0.27 | |||
LSA = local sagittal angle
P = P value
r = correlation coefficient
RMDQ‐24 = Roland Morris Disability Questionnaire (score 0 to 24)
RSA = regional sagittal angle
VAS = visual analogue score or scale
Mean duration of hospitalisation
In Wood 2003, the mean duration of hospitalisation was 10.7 days (range 6 to 27 days) in the surgical group and 7.9 days (range 2 to 17 days) in the non‐surgical group. In Siebenga 2006, the mean hospital stay was 14.6 days (9 to 21 days) in the surgical group and 12.2 days (6 to 25 days) in the non‐surgical group. While length of hospital stay was longer in the surgical group in both trials, there were insufficient data for testing the significance.
Economic evaluation
Wood 2003 reported that for 32 patients (15 surgical; 17 non‐surgical) who had an isolated thoracolumbar burst fracture without other substantial trauma requiring specific treatment during the initial hospitalisation, the mean charge for surgically‐treated patients was 'approximately' USD 49,063 (range USD 26,517 to USD 102,583). This was reported as significantly higher (P < 0.01) than the mean charge of USD 11,264 (USD 4686 to USD 20,891), covering hospitalisation and cast or brace treatment, for non‐surgically treated patients. No economic data were reported by Siebenga 2006.
Discussion
Summary of main results
The available evidence for comparing surgical with non‐surgical treatment for thoracolumbar fractures without neurological deficit was limited to two small trials with a total of 79 participants available at a minimum of two years follow‐up. Both trials were at risk of bias. Additionally, these trials produced contrasting results and the significant heterogeneity between the results for outcomes in common rendered meta‐analysis inappropriate for all but overall complications and surgery for complications. Siebenga 2006 found superior pain, function and return to work outcomes for the surgical group, whereas the converse was true for Wood 2003. There were greater numbers of participants with early complications in the surgical groups and only those in this group had subsequent surgery, involving implant removal either for complications or as a matter of course. One trial reported that surgery was over four times more costly than non‐surgical treatment.
Overall completeness and applicability of evidence
The available evidence is sparse and the two included trials are clinically heterogeneous. For instance, there was a difference in the range of fracture sites, although the majority fell into the same categories, and in the types of surgical and non‐surgical interventions. It is impossible to judge the applicability of the contrasting results for pain and function from the two trials. However, the risk of subsequent surgery, entailing implant removal, and of early complications and higher initial costs after surgery are likely to apply more generally.
Quality of the evidence
There were some limitations in the design, implementation and reporting of the two included trials. Notably, both were at high risk of bias relating to performance and detection. The small sample sizes, clinical heterogeneity and contrasting results for patient‐reported outcomes of pain and function of the two trials further limit the quality of the evidence.
Potential biases in the review process
There were some limitations in the review process that may have resulted in potential biases. Firstly, we restricted study inclusion to those published in English or Chinese. Secondly, we have been unsuccessful in our attempts to get missing information from the trial investigators. Thirdly, similar to the first version of this review, our presented primary outcomes differ from those listed in Types of outcome measures. This is unavoidable in terms of the available data but it also indicates that some appraisal of the outcomes may be warranted before the next update.
Agreements and disagreements with other studies or reviews
A meta‐analysis by Gnanenthiran 2012 included four trials, of which two were included in our review. One (Shen 2001) was excluded because of excessively compromised analysis, and the fourth study was not a randomised or quasi‐randomised trial. Although acknowledging the clinical and statistical heterogeneity in the four studies, Gnanenthiran 2012 decided to present the results for pain and functional outcomes. They concluded that there were no differences between the two intervention groups in pain, Roland Morris Disability Questionnaire scores, and return to work rates. Similar to our findings, they found surgery was associated with higher complication rates and costs.

Risk of bias graph: review authors' judgements about each risk of bias item presented as percentages across all included studies.

Risk of bias summary: review authors' judgements about each risk of bias item for each included study.

Comparison 1 Surgical versus non‐surgical treatment, Outcome 1 Visual Analogue Pain Scores (0 to 100 mm: worst) at follow‐up.
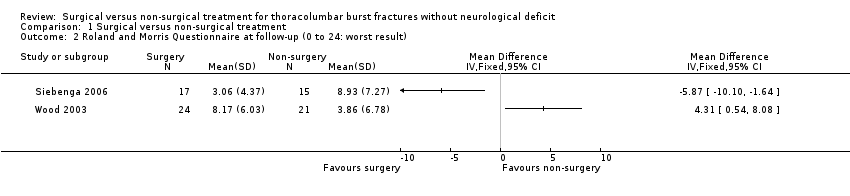
Comparison 1 Surgical versus non‐surgical treatment, Outcome 2 Roland and Morris Questionnaire at follow‐up (0 to 24: worst result).
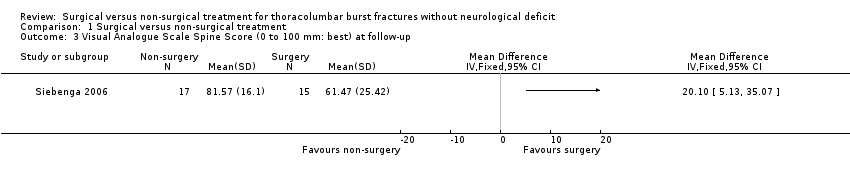
Comparison 1 Surgical versus non‐surgical treatment, Outcome 3 Visual Analogue Scale Spine Score (0 to 100 mm: best) at follow‐up.

Comparison 1 Surgical versus non‐surgical treatment, Outcome 4 Oswestry Questionnaire at minimum 24 months follow‐up.
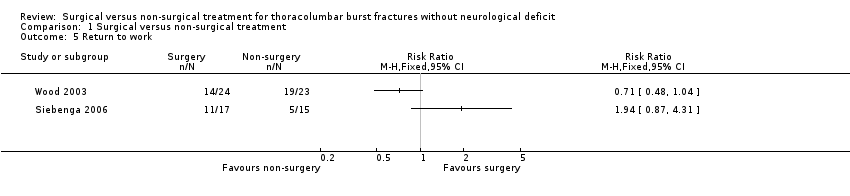
Comparison 1 Surgical versus non‐surgical treatment, Outcome 5 Return to work.
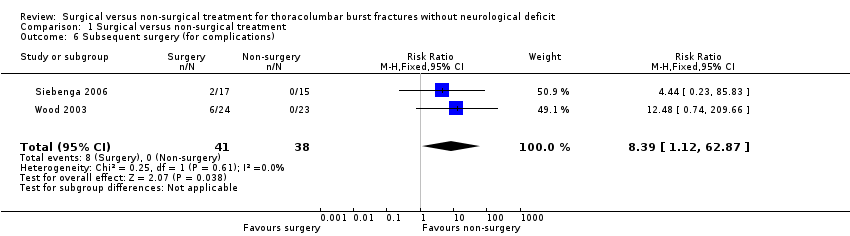
Comparison 1 Surgical versus non‐surgical treatment, Outcome 6 Subsequent surgery (for complications).
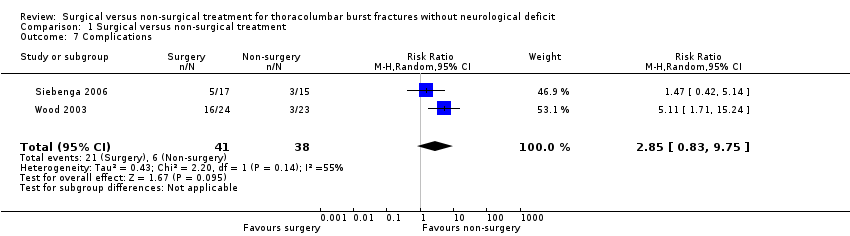
Comparison 1 Surgical versus non‐surgical treatment, Outcome 7 Complications.

Comparison 1 Surgical versus non‐surgical treatment, Outcome 8 Kyphosis at follow‐up (degrees).

Comparison 1 Surgical versus non‐surgical treatment, Outcome 9 Degree of canal compromise (% occlusion) at 2 years.
| VAS pain (0 to 100 mm: no pain) at final follow‐up | VAS spine score (0 to 100 mm: best outcome) at final follow‐up | RMDQ‐24 at final follow‐up | |||
| Surgical | Non‐surgical | Surgical | Non‐surgical | Surgical | Non‐surgical |
| 55 | 80 | 45 | 80 | 14 | 4 |
| 100 | 60 | 100 | 29 | 0 | 15 |
| 95 | 65 | 99 | 55 | 0 | 10 |
| 76 | 15 | 58 | 11 | 13 | 24 |
| 90 | 65 | 94 | 54 | 2 | 9 |
| 100 | 98 | 86 | 94 | 0 | 0 |
| 100 | 90 | 100 | 82 | 0 | 13 |
| 100 | 65 | 65 | 53 | 2 | 14 |
| 95 | 100 | 62 | 100 | 0 | 0 |
| 79 | 100 | 74 | 86 | 1 | 0 |
| 100 | 65 | 86 | 34 | 0 | 15 |
| 70 | 65 | 89 | 56 | 6 | 10 |
| 82 | 80 | 76 | 80 | 5 | 0 |
| 99 | 55 | 92 | 46 | 0 | 15 |
| 86 | 80 | 90 | 62 | 2 | 5 |
| 80 | 74 | 3 | |||
| 77 | 88 | 4 | |||
| VAS = visual analogue scale | |||||
| VAS pain (0 to 10 cm: worst) | Roland and Morris Questionnaire | Oswestry Questionnaire | |||
| Surgical | Non‐surgical | Surgical | Non‐surgical | Surgical | Non‐surgical |
| 1 | 2 | 5 | ** | 4 | ** |
| 1 | 5 | 3 | 12 | 4 | 50 |
| 1.5 | 0 | 6 | 1 | 14 | 0 |
| 5 | 2 | 16 | 0 | 20 | 2 |
| 1 | 1 | 1 | 2 | 6 | 4 |
| 5 | 5 | 10 | 3 | 24 | 12 |
| 3 | 2 | 13 | 0 | 30 | 2 |
| 0 | 0 | 1 | 0 | 2 | 0 |
| 5 | 1 | 4 | 0 | 20 | 0 |
| 2 | 1.5 | 4 | 2 | 24 | 12 |
| 2 | 0 | 6 | 0 | 20 | 0 |
| 7.5 | 0 | 19 | 1 | 40 | 0 |
| 6 | 0 | 14 | 2 | 30 | 10 |
| 1 | 1 | 0 | 0 | 0 | 2 |
| 1 | 9 | 7 | 24 | 16 | 52 |
| 4 | 0 | 2 | 0 | 8 | 0 |
| 4 | 1 | 9 | 1 | 34 | 6 |
| 3 | 8 | 6 | 20 | 18 | 20 |
| 7 | 4 | 19 | 9 | 40 | 22 |
| 6 | 1 | 15 | 2 | 48 | 22 |
| 1 | 0 | 6 | 1 | 44 | 4 |
| 6 | 0 | 19 | ** | 48 | ** |
| 1 | 1 | 5 | 1 | 0 | 4 |
| 5 | 6 | 4 | |||
| ** = missing value | |||||
| Domain | Surgery | Non‐surgery | P Value |
| Pain | 59 | 72 | 0.07 |
| Health Perception | 69 | 72 | 0.4 |
| Physical Function | 63 | 86 | 0.002 |
| Social Function | 84 | 83 | 0.8 |
| Role; Physical | 51 | 85 | 0.003 |
| Role; Emotional | 80 | 78 | 0.92 |
| Mental Health | 81 | 75 | 0.3 |
| Energy/Fatigue | 84 | 56 | 0.8 |
| Complications | ||||
| Surgical | Non‐surgical | Surgical | Non‐surgical | |
| Wound dehiscence | 2 | |||
| Instrumentation/bone failure | 2 | 1 | ||
| Wound infection | 1 deep | 2 (1 deep) | ||
| Pseudarthrosis | 1 | |||
| Neurapraxia | 1 | |||
| Ketoacidosis | 1 | |||
| Instrumentation break | 2 | 1 | ||
| Urinary tract infection | 2 | 1 | ||
| Seroma | 1 | |||
| Instrumentation removal (for complication) | 6 | 2 | ||
| Skin blisters | 1 | |||
| Severe pain at the bone harvest site | 1 | |||
| Conus medullaris syndrome | 1 | |||
| Continued use of orthosis reflecting irrational fear | 1 | |||
| Scoliosis (and signs of nerve root compression) | 1 | |||
| Total | 19 | 2 | 7 | 3 |
| Note there are repeated counts in this table. | ||||
| RMDQ‐24 | VAS spine score | VAS pain | ||||
| LSA | RSA | LSA | RSA | LSA | RSA | |
| r = ‐0.30, P = 0.09 | r= ‐0.29, P = 0.11 | r = 0.20, P = 0.29 | r = 0.17, P = 0.38 | r = 0.20, P = 0.29 | r = 0.17, P = 0.38 | |
| kyphosis and pain score | Roland and Morris questionnaire | Oswestry questionnaire | ||||
| Surgical group | r = 0.05; P = 0.8 | r = 0.05; P = 0.8 | r = 0.3; P = 0.14 | |||
| Non‐surgical group | r = 0.22; P = 0.29 | r = 0.19; P = 0.39 | r = 0.25; P = 0.27 | |||
| LSA = local sagittal angle | ||||||
| Outcome or subgroup title | No. of studies | No. of participants | Statistical method | Effect size |
| 1 Visual Analogue Pain Scores (0 to 100 mm: worst) at follow‐up Show forest plot | 2 | Mean Difference (IV, Fixed, 95% CI) | Totals not selected | |
| 2 Roland and Morris Questionnaire at follow‐up (0 to 24: worst result) Show forest plot | 2 | Mean Difference (IV, Fixed, 95% CI) | Totals not selected | |
| 3 Visual Analogue Scale Spine Score (0 to 100 mm: best) at follow‐up Show forest plot | 1 | Mean Difference (IV, Fixed, 95% CI) | Totals not selected | |
| 4 Oswestry Questionnaire at minimum 24 months follow‐up Show forest plot | 1 | Mean Difference (IV, Fixed, 95% CI) | Totals not selected | |
| 5 Return to work Show forest plot | 2 | Risk Ratio (M‐H, Fixed, 95% CI) | Totals not selected | |
| 6 Subsequent surgery (for complications) Show forest plot | 2 | 79 | Risk Ratio (M‐H, Fixed, 95% CI) | 8.39 [1.12, 62.87] |
| 7 Complications Show forest plot | 2 | 79 | Risk Ratio (M‐H, Random, 95% CI) | 2.85 [0.83, 9.75] |
| 8 Kyphosis at follow‐up (degrees) Show forest plot | 2 | Mean Difference (IV, Fixed, 95% CI) | Totals not selected | |
| 9 Degree of canal compromise (% occlusion) at 2 years Show forest plot | 1 | Mean Difference (IV, Fixed, 95% CI) | Totals not selected | |