Agonistas beta2 de acción prolongada como fármacos economizadores de corticosteroides inhalados para el asma crónica en adultos y niños
Resumen
Antecedentes
La administración de un betaagonista de acción prolongada (BAAP) junto con los corticosteroides inhalados (CSI) puede mejorar los síntomas de asma y disminuir las exacerbaciones. El agregado de BAAP también puede tener un efecto economizador de CSI y permite disminuir su dosis de mantenimiento.
Objetivos
Determinar la eficacia de agregar los BAAP al tratamiento de mantenimiento con CSI para disminuir la necesidad de CSI y mantener el control del asma crónica.
Métodos de búsqueda
Se realizaron búsquedas en el registro de ensayos del Grupo Cochrane de Vías Respiratorias (Cochrane Airways Group) y en las listas de referencias de los artículos. Fecha de la última búsqueda: noviembre de 2004
Criterios de selección
ECA con diseño de grupos paralelos que compararon una dosis menor de CSI en combinación con BAAP versus CSI solos en los pacientes asmáticos que requerían el uso diario de CSI.
Obtención y análisis de los datos
Dos autores de la revisión evaluaron la calidad de los ensayos y extrajeron los datos de forma independiente. Se estableció contacto con los autores de los estudios para confirmar los datos. Se analizaron los ensayos según las siguientes comparaciones de dosis del CSI: una dosis fija moderada/alta o una dosis reducida o disminuida progresivamente del mismo CSI.
Resultados principales
Se incluyeron en la revisión 19 publicaciones que describían 10 ensayos de adultos. Los estudios que compararon la dosis reducida (disminución media de 60%) de la combinación de CSI/BAAP con una dosis fija moderada/alta de CSI no encontraron diferencias significativas de las exacerbaciones graves que requirieron corticosteroides orales (RR 1,0; IC del 95%: 0,76 a 1,32), retiros debidos al empeoramiento del asma (RR 0,82; IC del 95%: 0,5 a 1,35) o inflamación de las vías respiratorias. Hubo también mejorías significativas del VEF1 (cambio en relación al valor inicial de la DMP 0,10; IC del 95%: 0,07 a 0,12), del FEM matutino y vespertino y del porcentaje de días sin el uso de fármacos de rescate con BAAP. Dos estudios proporcionaron resultados de una comparación de una dosis de CSI reducida/disminuida progresivamente. Más participantes que recibieron la combinación del BAAP con la dosis reducida del CSI lograron una disminución de la dosis del CSI que alcanzó significación en un estudio. En un estudio, se alcanzó una disminución significativa de 253 mcg de BDP.
Conclusiones de los autores
En adultos con asma que usan dosis de mantenimiento del CSI moderadas a altas, el agregado de un BAAP tiene un efecto economizador de CSI. El agregado de BAAP permite que más participantes con una dosis de mantenimiento mínima de CSI, la disminuyan. La magnitud precisa de la reducción de la dosis del CSI requiere un estudio adicional.
PICO
Resumen en términos sencillos
Agonistas beta2 de acción prolongada como fármacos economizadores de corticosteroides inhalados para el asma crónica en adultos y niños
La combinación de un betaagonista de acción prolongada (BAAP) con los corticosteroides inhalados (CSI) se usa con frecuencia en el asma y se ha descrito un beneficio de la administración conjunta de BAAP y CSI. Esta revisión comparó la combinación de la dosis reducida (media 60% de reducción del esteroide inhalado) de CSI/BAAP con una dosis fija moderada o alta de CSI o una dosis del CSI reducida/disminuida progresivamente. En adultos con asma que usan dosis de mantenimiento altas del CSI, el agregado de un BAAP tiene un efecto economizador del CSI. El BAAP permite una reducción de un 37% (253 mcg BDP) en sujetos con una dosis mínima de mantenimiento del CSI y de hasta 60% (300 mcg de PF) en sujetos con dosis de mantenimiento del CSI sin deterioro del control del asma.
Authors' conclusions
Background
Asthma is characterised by airway inflammation and variable expiratory airflow obstruction. Inhaled corticosteroids (ICS) and long acting beta agonists (LABA) effectively target these pathophysiological processes in asthma. The combination of LABA with ICS is used frequently in asthma and a complementary effect from adding LABA to ICS has been described. This could result from a synergistic molecular mechanism where LABA increases the nuclear translocation of active glucocorticoid receptors (Barnes 2002). An additional mechanism relates to the heterogeneity of airway inflammation in asthma where ICS effectively target eosinophilic inflammation and LABA target the airway hyper responsiveness that occurs as a consequence of non eosinophilic asthma pathology (which is relatively resistant to ICS). These complementary effects of ICS and LABA in asthma translate into improved clinical efficacy in a variety of settings. In uncontrolled asthma, the addition of LABA to ICS gives better results than ICS alone for both initial asthma therapy (Ducharme 2004), and maintenance asthma therapy (Greenstone 2004). When asthma is controlled, ICS doses can often be reduced. In this setting, LABA may provide an ICS‐sparing effect permitting greater ICS dose reduction while maintaining asthma control. However, concern has been raised that reducing ICS while using LABA may mask worsening airway inflammation (McIvor 1998), and therefore the ICS‐sparing effect of LABA needs careful examination. The aim of this review is to assess the steroid‐sparing effect of the addition of LABA to maintenance moderate or high dose ICS in stable asthmatics.
Objectives
The objective of this review is to determine the efficacy of the addition of long acting beta agonists to maintenance ICS therapy in reducing the requirement for ICS while maintaining control of chronic asthma.
Methods
Criteria for considering studies for this review
Types of studies
Randomised controlled trials of parallel design only were considered. Double, single or unblinded studies were considered.
Types of participants
Adults and children > 2 years with stable asthma maintained on regular moderate to high dose ICS ( > 400 mcg/day BDP equivalent in adults, > 200 mcg/day BDP equivalent in children) for a minimum of one month prior to study entry, and not using LABA.
Types of interventions
The active intervention was long acting beta agonist combined with an inhaled corticosteroid at a reduced or tapering dose. The ideal design to determine the minimal effective ICS dose should include a gradual decrease in ICS dose to avoid artificial overinflation of the results and ensure similar asthma control at the end of tapering in both groups.
Several comparison interventions were examined:
-
A fixed moderate or high dose of the same ICS,
-
A gradual dose reduction of the same ICS according to asthma control. This comparison controlled for the reduction in ICS maintenance dose that may be possible without additional therapy.
-
ICS alone in patients whose loss of control had been determined on reduced ICS prior to randomisation. This comparison permitted a more precise estimate of ICS dose reduction, since the minimum maintenance dose was defined before addition of LABA.
Several delivery systems were considered including metered dose inhalers (pMDI), with or without a valved holding chamber (spacer) or dry powder inhaler (DPI). Treatment duration needed to be one month or greater. Asthma control was assessed using symptom/lung function criteria at study completion in order to ascertain that control is maintained after tapering.
Types of outcome measures
1) Change in dose of ICS achieved at endpoint.
2) Any clinical outcome identifying asthma control such as:
‐ withdrawal due to worsening asthma (RR and 95% CI within 0.9 to 1.1),
‐ exacerbations requiring systemic steroids,
‐ exacerbations requiring hospital admission,
‐ lung function (change from baseline in FEV1 < 200 mL),
‐ asthma symptoms,
‐ airway hyporesponsives,
‐ rescue medication use,
‐ Emergency room (ER) visits,
‐ inflammatory mediators, and
3) Adverse events
‐ overall withdrawals
Search methods for identification of studies
The Cochrane Airways Group Specialised Register of asthma trials (derived from systematic searches of CENTRAL, MEDLINE, EMBASE, CINAHL; hand‐searched respiratory journals and meeting abstracts). A free‐text search of the Register was conducted in November 2004 using the following terms:
((inhale* AND (corticosteroid OR steroid) OR beclometh* OR triamcin* OR flutic* OR budes* OR betameth* OR flunis*) AND ((long AND (beta* OR *agonist* OR bronchodilator)) OR salmeterol OR eformoterol OR formoterol).
Full text versions of the relevant papers were obtained, and their bibliographic lists were hand searched for additional articles.
Data collection and analysis
Selection of studies
All identified abstracts were independently assessed by two reviewers. The full text version of each potential article was obtained for assessment by two independent reviewers to establish whether it met the inclusion criteria.
Data extraction and management
Authors were contacted to verify and provide further information about methodological approaches and outcomes data. 60% of authors responded to our request.
Assessment of risk of bias in included studies
Study quality was assessed with the Jadad system (Jadad 1996), allows for a score between 0 and 5 with higher scores indicating a better description of the study by two review authors independently. The Jadad system measures the clarity of the description of: randomisation (1 point, 2 points if well described and appropriate), blinding (1 point, 2 points if well described and appropriate) and treatment of withdrawals and dropouts (1 point). One point is deducted if the method of randomisation or blinding is inappropriate.
Studies were further assessed, using the Cochrane method, as low risk of bias, high risk of bias, or unclear to the actual methods used for randomisation, concealment of allocation and blinding. In this assessment, if studies are either not truly randomised (e.g. alternated) or if allocation to treatment or control groups is not truly blinded, studies are considered as being of at a high risk of bias. If the author does not fully state these methods, the study is characterised as "unclear" until the author is contacted and clarification can be made.
Data synthesis
The following comparisons were analysed:
i) ICS & LABA vs ICS alone (fixed moderate or high dose)
ii) ICS & LABA vs ICS alone (reduced/tapering dose)
iii) ICS & LABA vs ICS alone in patients whose loss of control had been determined on reduced ICS prior to randomisation.
Outcomes were analysed as continuous and/or dichotomous variables, using standard statistical techniques:
i) For continuous outcomes, the weighted mean difference (for outcomes reported in the same scale) or standardised mean difference (for outcomes reported in different scales) with 95% confidence intervals was calculated.
ii) For dichotomous outcomes, the relative risk was calculated with 95% confidence interval. The number needed to treat (NNT) was calculated from the pooled odds ratio.
Heterogeneity was examined using both a Chi‐squared test and the I square percentage. A random effects model was used when the I‐Square was ≥ 25%. Funnel plots were used to examine for publication bias.
Subgroup analysis and investigation of heterogeneity
Outcomes were analysed according to:
i) Age (children / adults)
ii) Reported asthma control at randomisation (satisfactory versus unsatisfactory)
iii) Delivery device (pMDI / DPI) for LABA
iv) Delivery device (pMDI/DPI) for ICS
v) Delivery device (single or separate inhalers for LABA / ICS)
vi) Study quality
vii) Treatment Duration (< 24 weeks vs > 24 weeks)
viii) ICS type/LABA type
Differences between subgroups were tested for using Chi‐square totals or the Peto OR and t‐test as appropriate. Where there were heterogenous results, these were explored using the subgroup analyses above. If imputed data were included, a sensitivity analysis was performed. ICS dose was reported as the dose mcg beclomethasone (BDP) equivalent ex‐valve and classified according to British Thoracic Society Guidelines as 1 mcg FP: 2 mcg BDP and 1 mcg:BUD:1 mcg BDP
Results
Description of studies
Results of the search
From electronic searches, 59 citations describing 42 RCTs were identified for possible inclusion. Ten of these met the eligibility criteria of the review. Details of individual eligible studies are given in Characteristics of included studies.
Included studies
The included trials were conducted in adults and adolescents. Three trials included participants > 12 years of age (Baranuik 1999; Busse 2003; Lemanske 2001). One trial did not state the age of the participants (Bloom 2003). Trials were analysed according to the design of the comparison intervention: a fixed moderate/high ICS dose or a reduced/tapering ICS dose.
1) Abrupt fixed reduced ICS + LABA versus fixed moderate or high dose of the same ICS
Seven trials (Baranuik 1999; Bloom 2003; Busse 2003; Dorinsky 2004; Kips 2000; Lalloo 2001; Pauwels 1997) compared treatment with a reduced ICS dose combined with a LABA to a fixed moderate to high dose of ICS alone to maintain asthma control. Asthma stability was assessed during the run in period in 6 trials ( Baranuik 1999; Bloom 2003; Busse 2003; Dorinsky 2004; Kips 2000; Pauwels 1997). Inadequate asthma control was an entry criteria for one trial (Lalloo 2001). Of these, two trials (Busse 2003; Dorinsky 2004) conducted 3 run‐in phases to establish that participants became unstable on reduced ICS doses and then regained asthma control on moderate to high dose ICS prior to randomisation. In one study (Baranuik 1999) participants were eligible for randomisation if they were symptomatic or had demonstrated a reduced FEV1 40‐65% predicted. The inclusion criterion for one study Bloom 2003 was that participants required moderate dose ICS to maintain control. In 2 trials (Kips 2000; Pauwels 1997) participants were eligible for randomisation if they demonstrated asthma stability and were compliant during a 4 week run in period on moderate to high dose ICS.
Fluticasone propionate (200 mcg/day) and salmeterol (100 mcg/day) were compared to fluticasone (500 mcg/day) alone in 4 trials (Busse 2003; Baranuik 1999; Bloom 2003; Dorinsky 2004). The remaining 3 trials (Kips 2000; Lalloo 2001; Pauwels 1997) compared budesonide (160‐200 mcg/day) and formoterol (9‐24 mcg/day) to budesonide (400‐800 mcg/day) alone. Two trials included other treatment arms that did not meet the criteria for this analysis and were not included: Baranuik 1999 included a third treatment arm of triamcinalone 1200 mcg/day and Pauwels 1997 had 4 treatment arms, two of which were not applicable for this analysis and were not included.
By design these 7 studies reduced ICS dosage with the addition of LABA by 60‐75% with a mean dose reduction of 64.3% (95%CI 57.5 to 71.1). The average ICS dose was 857 mcg/day BDP equivalent and this was compared to 309 mcg /day BDP equivalent with the addition of LABA.
Treatment periods were 12 weeks in 2 trials (Baranuik 1999; Lalloo 2001), 24 weeks in two trials (Bloom 2003; Dorinsky 2004), and 12 months in 2 trials (Kips 2000; Pauwels 1997). One trial (Busse 2003) had an initial treatment period of 12 weeks with a proportion of participants randomised for 24 weeks. Outcome data collected at 12 weeks was used for this analysis. The delivery devices used were the same for both ICS and LABA delivery in 3 trials (DPI, n= 2 and pMDI, n = 1) and a single DPI device was used in 4 trials (Busse 2003; Bloom 2003; Dorinsky 2004; Lalloo 2001).
2) Reduced or tapering ICS + LABA versus reduced or tapering dose of the same ICS according to asthma control
ICS dose reduction was evaluated in 3 trials (Nielsen 1999; Lemanske 2001; Self 1998) that compared treatment with reducing doses of ICS with and without the addition of LABA.
In one trial participants received a three‐phase run‐in ( Nielsen 1999) where their minimum acceptable ICS dose (MAD) was determined. After receiving BDP via DPI at an equivalent dose to their maintenance ICS for 2 weeks their BDP was reduced by 200 mcg/week until they became unstable according to predefined criteria and MAD determined. Those who remained stable were withdrawn from the study. Participants were restabilised on 3 x MAD for 2 weeks then randomised to placebo or salmeterol 100 mcg/day and their ICS reduction recommenced until MAD determined .
Self 1998 conducted a 4 week run‐in where participants received their usual ICS (BDP, FP or TAA) at a minimum dose of 1000 mcg/day. Those who were stable were randomised to salmeterol 200 mcg/day or placebo plus their usual ICS. After 2 weeks ICS reduction was commenced in both treatment arms at a rate of 10% every 4 weeks if the participant was stable. ICS was not reduced > 25% or below 500 mcg/day for participants with moderate/severe asthma. Participants were monitored for 12 months. ICS was optimised with pMDI and spacer and education and crisis prednisolone provided at commencement of the study.
Lemanske 2001 randomised participants remaining uncontrolled after 6 weeks triamcinalone 800 mcg/day to two arms, namely the addition of salmeterol or placebo. After 8 weeks participants in the salmeterol treatment arm were further randomised to reduced TAA 400 mcg/day for 8 weeks then placebo TAA for 8 weeks or to remain on TAA 800 mcg/day for 16 weeks, while those in the placebo arm received reduced TAA (400 mcg/day) for 8 weeks then placebo TAA for 8 weeks.
3) Reduced ICS + LABA versus ICS alone in participants who demonstrate deteriorating asthma control when ICS are reduced
In six trials (Baranuik 1999; Busse 2003; Dorinsky 2004; Lalloo 2001; Lemanske 2001; Nielsen 1999) the inclusion criteria required either a demonstrated deterioration in asthma control if ICS were reduced or that participants had inadequate asthma control on their maintenance ICS prior to randomisation. These trials are included in comparisons 1 and 2 but are also included in this analysis since their design determines the ICS dose reduction possible that is attributable to the addition of LABA. A sensitivity analysis was conducted for the different control comparison:a fixed moderate or high ICS dose or reduced or tapering ICS dose.
Excluded studies
From 42 RCTs, 32 trials were excluded for the following reasons: subjects were not previously maintained on ICS (n=1); ICS dose was not reduced in the active intervention group (n=23); subjects were ICS naive (n=1); subjects were on LABA prior to study entry (n=1); both LABA and ICS were withdrawn (n=1); were a crossover design (n=4) or LABA not added in the active intervention group (n = 1). The remaining 19 citations (9 publications and 10 abstracts) describing 10 parallel designed RCTs met the inclusion criteria for the review. Reasons for the exclusion of these studies are given in Excluded studies.
Risk of bias in included studies
For four of the studies we were unable to determine the degree to which any aspect of study design protected against bias. Allocation generation and concealment was assessed as being of a low risk of bias in five studies. In six studies blinding procedures were adequate. Using the Jadad system, 80% of the studies scored three or higher, with 50% scoring 5.
Effects of interventions
1) Abrupt fixed reduced ICS + LABA versus fixed moderate or high dose of the same ICS
Seven trials randomised 2625 participants to two treatment arms applicable for this analysis. Where appropriate, subgroup analyses were conducted for asthma control at randomisation, delivery device and study quality. All trials were conducted in adults.
Worsening Asthma
Exacerbations requiring oral corticosteroids (OCS)
The number of participants who had a severe exacerbation that required OCS was reported in two trials (Kips 2000; Pauwels 1997), both comparing budesonide and formoterol to mod/high budesonide dose and were of 12 months duration. There was no significant difference between treatment groups when these results were pooled. No heterogeneity was present. In this analysis, LABA permitted a reduction in ICS dose without an increase in exacerbations. Exacerbations requiring OCS: RR 1.0 (95% CI 0.76 to 1.32), Analysis 1.1 .
Withdrawal due to worsening asthma
Four trials reported the number of subjects who withdrew from the study due to worsening asthma. Dorinsky 2004 reported no difference in the proportion of participants who withdrew due to worsening asthma in a post hoc analysis. Two studies comparing FP/salmeterol (Bloom 2003; Busse 2003) over 24 and 12 weeks respectively and one trial comparing BUD/formoterol (Pauwels 1997) over 12 months reported data that could be pooled in a meta analysis. The pooled results of these 3 trials show no significant group difference. There was no heterogeneity (withdrawal due to worsening asthma: RR 0.82 (95% CI 0.50 to 1.35), Analysis 1.2).
Hospitalisations
Two trials reported hospitalisations for worsening asthma. Pauwels 1997 reported a similar number of hospitalisations across all treatment groups and there were no hospitalisations for either treatment group in the trial conducted by Dorinsky 2004.
Lung Function
FEV1
FEV1 was reported in six studies as litres change from baseline, percent predicted change from baseline and percent predicted at end of study. Four studies reporting litres change from baseline provided sufficient data to be pooled using a WMD. There was a significant improvement in FEV1 in favour of the reduced ICS /LABA combination with no heterogeneity.
FEV1 (L) change from baseline: WMD 0.10 L(95%CI 0.07 to 0.12), Analysis 1.3.
The pooled result for the two studies reporting FEV1 percent predicted at the end of 12 months was also significant in favour of the reduced ICS/LABA group with no heterogeneity present. FEV1 percent predicted: WMD 3.62% (95%CI 1.65 to 5.59), Analysis 1.4.
Morning Peak Expiratory Flow (PEF)
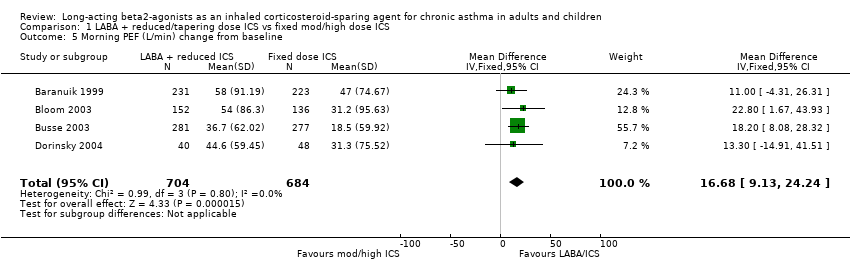
Morning PEF was reported in six studies. There was a significant improvement in morning PEF from baseline when the results of four studies all comparing FP/salmeterol combinations to FP alone were pooled. No heterogeneity was present.
Morning PEF (L/min) change from baseline: WMD 16.68 (95%CI 9.13 to 24.24), Analysis 1.5.
Evening Peak Expiratory Flow (PEF)
Five studies reported evening PEF. Three studies comparing FP/salmeterol combination reported the change in evening PEF from baseline and were pooled using a WMD. There was a small but significant improvement in evening PEF with no heterogeneity present. Evening PEF (L/min) change from baseline: WMD 12.56 (95%CI 4.9 to 20.22), Analysis 1.6.
The remaining two studies reported that evening PEF improved significantly in the BUD/formoterol group (Lalloo 2001; Kips 2000).
Rescue Medications
Six studies reported the use of rescue medications. This was reported as the change in mean puffs per day from baseline in four studies comparing FP/salmeterol to FP alone. There was a non significant reduction in rescue medication use for the reduced ICS/LABA combination and no heterogeneity.
Rescue medication use (puffs/day) change from baseline: WMD ‐0.11 (95%CI ‐0.25 to 0.03), Analysis 1.7.
Three of these studies also reported the percent rescue free days. There was a significant improvement in the percentage of days without rescue medication use for the reduced ICS/LABA group. Statistical heterogeneity was present.
Percent rescue free days change from baseline: WMD 9.21 (95%CI 1.36 to 17.05). Chi2 = 5.11, P = 0.08, I2 = 60.9%, Analysis 1.8.
When analysed by asthma control at randomisation there was no heterogeneity and significance maintained (comparison 4.08).
One study reported no difference in rescue medication use between the treatment groups (Kips 2000) and a significant reduction in day and night rescue medication use was reported for the formoterol group in another study (Pauwels 1997).
Symptoms
Percent Symptom Free Days
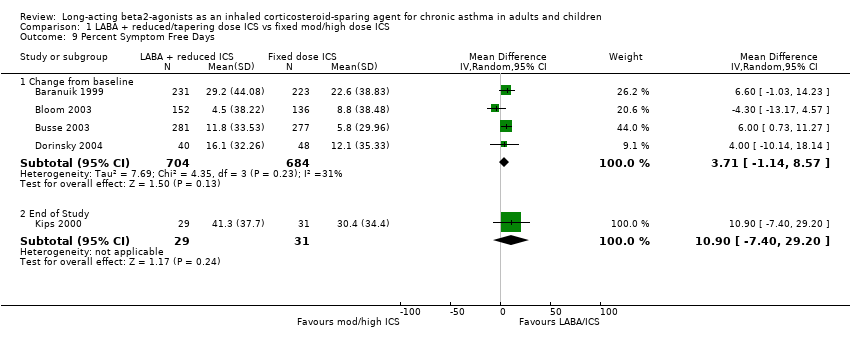
Symptom free days were reported in seven studies. There was a non significant improvement in the change in percentage of symptom free days from baseline for the FP/salmeterol treatment group in the results of four studies evaluating FP/salmeterol to FP alone. Low heterogeneity was present. In one study evaluating BUD/formoterol combination there was a non significant improvement in the percentage of symptom free days for the reduced ICS/LABA combination at the end of the study.
Percent symptom free days change from baseline: WMD 3.71(95%CI ‐1.14 to 8.57). Chi2 = 4.35, P = 0.23, I2 = 31.1%, Analysis 1.9.
When analysed by control at randomisation there was no heterogeneity and statistical significance for participants who were controlled at randomisation. Percent symptom free days: WMD 5.76 (95%CI 0.81 to 10.7), Analysis 4.2
Two further studies, not included in the meta analysis, reported a significantly higher percentage of symptom free days for the reduced ICS/LABA treatment groups (Lalloo 2001; Pauwels 1997).
Symptom Score
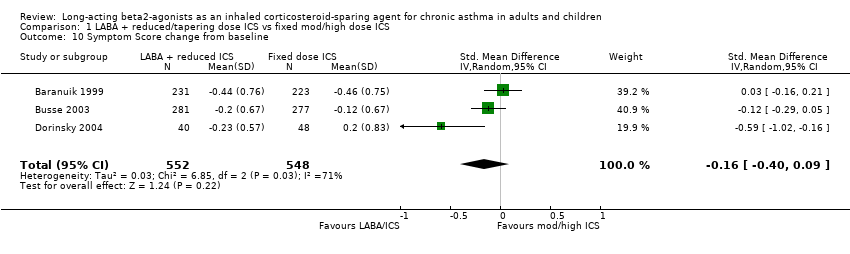
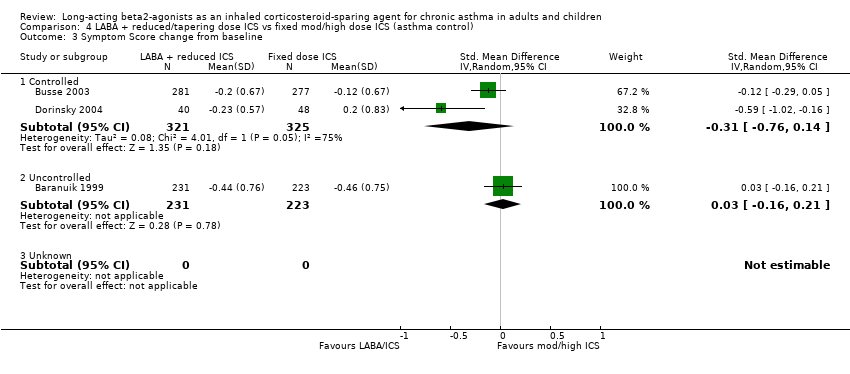
There was a non significant reduction in symptom score from baseline for the reduced ICS/LABA combination when the results of three studies, all comparing FP/Salmeterol to FP alone and using either a 0‐4 or 0‐5 scale were pooled. Significant heterogeneity was present between the studies.
Symptom score change from baseline: SMD ‐0.16 (95%CI ‐0.40 to 0.09). Chi2 = 6.85, P = 0.03, I2 = 70.8%, comparison 1.10.
Heterogeneity could not be explained by asthma control at randomisation (comparison 4.10) or delivery device (comparison 5.10). When examined by study quality (comparison 6.10), there was no heterogeneity present for studies with a Jadad score > 3.
Two other studies reported improvement in day and night symptom scores with the addition of formoterol to reduced dose BUD which was significant in one study (Pauwels 1997) and non significant in the other (Kips 2000).
Night Awakening
Night waking was reported in four studies. There was no difference in the change in mean number of night awakenings from baseline in the two FP/salmeterol studies that reported data that could be pooled. No heterogeneity was present.
Night Waking change from baseline: WMD 0.02 (95%CI ‐0.09 to 0.12), Analysis 1.11.
One study reported the mean number of awakenings per night but significance between the reduced BUD/formoterol and BUD alone group was not stated (Pauwels 1997). The remaining study reported no difference between the treatment groups (Kips 2000).
Airway Inflammation
Airway inflammation was evaluated in two studies (Kips 2000; Dorinsky 2004). Neither study reported data in a way that could be pooled for analysis. Dorinsky 2004 reported no change from baseline between treatment groups in mean collagen band thickness or inflammatory cells within the submucosa obtained from conducting bronchoalveolar lavage (BAL) and biopsy. There was no difference between treatment groups in sputum inflammatory cells including eosinophils, EG2 cells or ECP reported in the study conducted by Kips 2000.
Adverse Events
There was no significant difference in the occurrence of adverse events between the treatment groups in the pooled result of three studies (FP/salmeterol: n= 2, BUD/formoterol: n=1) reporting this outcome. There was no heterogeneity present.
Adverse Events: RR 0.92 (95%CI 0.79 to 1.07), Analysis 1.12.
Overall Withdrawals
There was no significant difference in the overall withdrawals between the treatment groups in the pooled result of three studies reporting this outcome. There was no heterogeneity present. Overall Withdrawals: RR 0.97 (95%CI 0.74 to 1.28), Analysis 1.13.
2) Reduced or tapering ICS + LABA versus reduced or tapering dose of the same ICS according to asthma control
Due to the methods of reporting of the three studies (Nielsen 1999; Self 1998; Lemanske 2001) included in this comparison only data for lung function could be pooled for meta‐analysis.
Lung Function
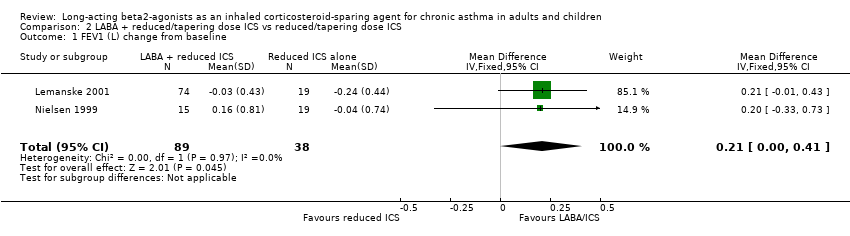
FEV1
FEV1 was reported as Litres change from baseline in two studies. There was a non significant improvement in FEV1 for the reduced LABA/ICS group. No heterogeneity was present. FEV1(L) change from baseline: WMD 0.21 (95%CI 0.0 to 0.41), Analysis 2.1.
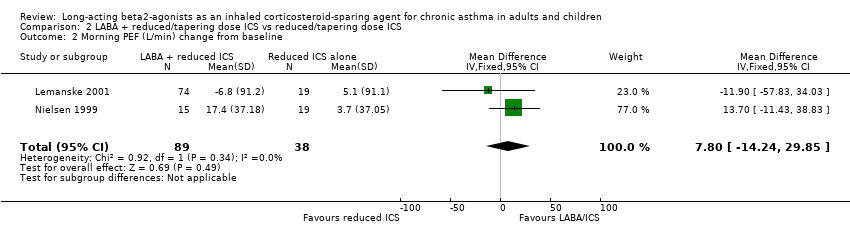
Morning PEF
There was no significant difference in morning PEF L/min in the pooled results of two studies and no heterogeneity.
Morning PEF (L/min): WMD: 7.80 (95%CI ‐14.24 to 29.85), Analysis 2.2.
Other Outcomes
Nielsen 1999 reported a significantly lower minimal acceptable ICS dose during the treatment period and a significantly greater reduction in mean (se) ICS mcg minimal acceptable dose for the LABA/ICS group (‐253 (196)mcg/day, 37% ) compared to a small increase for the group receiving ICS alone (42 (118) mcg/day) (P<0.01). A significantly greater proportion of participants in the LABA/ ICS group attained a > 50% reduction in ICS dose with no significant difference in FEV1(L), morning or evening PEF between treatment groups when compared to their baseline sensitivity period. In addition, there was a significantly greater reduction in rescue medication use, fewer daytime symptoms and more symptom free days between baseline sensitivity and treatment periods compared to reducing ICS alone and no difference in adverse events
There was no significant difference between treatment groups in the mean percent reduction of ICS dose (LABA/ICS combination, 18.7%; reduced ICS alone, 6.9%) reported by Self 1998. However more patients in the LABA/ICS group compared to ICS alone achieved a reduction in ICS. A significantly higher FEV1 percent predicted at end of the 12 month study and an improvement in asthma quality of life was reported for the group receiving LABA and a reduction in rescue medication use for both treatment groups. There was no difference in clinic PEF or adverse events for either treatment group.
Lemanske 2001concluded that reducing ICS to zero whilst taking additional LABA was not possible due to significant deterioration in asthma control but a 50% reduction of ICS was possible without loss of asthma control.
3) Reduced ICS + LABA versus ICS alone in participants who demonstrate deteriorating asthma control when ICS are reduced
Six trials randomised 1776 participants after determining their deterioration in asthma control on reduced dose ICS alone. By design a 60% (mean 510 mcg BDP equivalent) ICS dose reduction was achieved in the four studies comparing reduced ICS/LABA to a fixed moderate/high ICS dose and a 50% reduction was achieved for the two studies using a reduced/tapering ICS dose comparison whilst maintaining asthma control. The following are the results of the pooled analyses.
Withdrawals due to worsening asthma
There was no significant difference between treatment groups in the rate of withdrawal due to worsening asthma reported in one study (Busse 2003).
Lung Function
FEV1
There was a significant improvement in the change in FEV1 from baseline in favour of the reduced ICS /LABA combination in the four studies that provided sufficient data to be pooled using a WMD. There was no heterogeneity and the result remained unchanged with the sensitivity analysis. FEV1 (L) change from baseline: WMD 0.10 (95%CI 0.07 to 0.12), Analysis 3.2.
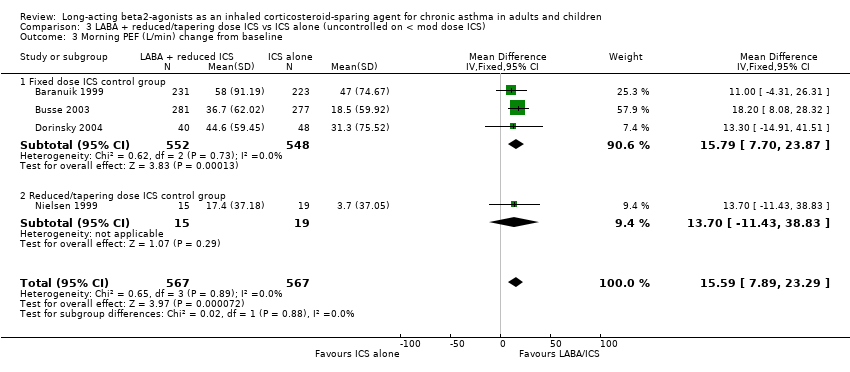
Morning Peak Expiratory Flow (PEF)
There was a significant improvement in morning PEF from baseline when the results of four studies were pooled. No heterogeneity was present and significance maintained with the sensitivity analysis. Morning PEF (L/min) change from baseline: WMD 15.59 (95%CI 7.89 to 23.29), Analysis 3.3.
Evening Peak Expiratory Flow
Four studies reported the change in evening PEF from baseline and were pooled using a WMD. There was a small but significant improvement in evening PEF with no heterogeneity present. Significance was maintained with the sensitivity analysis. Evening PEF (L/min) change from baseline: WMD 12.45 (95%CI 5.05 to 19.84), Analysis 3.4.
Rescue Medications
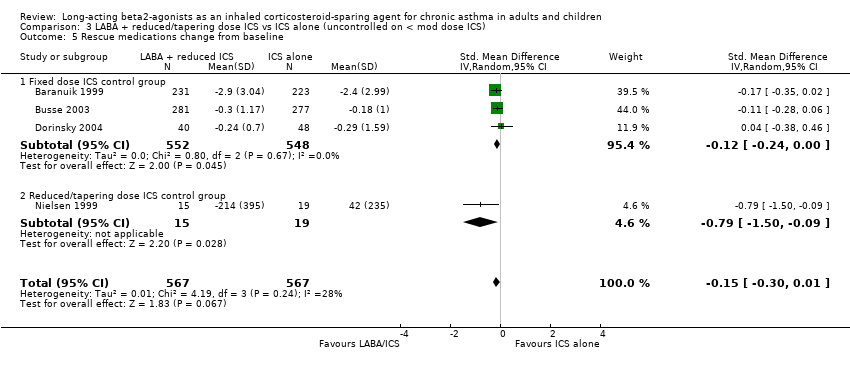
Rescue medication use was reported as the change in mean puffs per day from baseline in three studies comparing FP/salmeterol to FP alone and the change in salbutamol mcg/day in one study comparing BDP/salmeterol to BDP alone. There was a non significant reduction in rescue medication use for the reduced ICS/LABA combination. Low heterogeneity was present.
Rescue medication use (puffs/day) change from baseline: SMD ‐0.15 (95%CI ‐0.30 to 0.01). Chi 2=4.19, P= 0.24, I2 = 28.3%, Analysis 3.5.
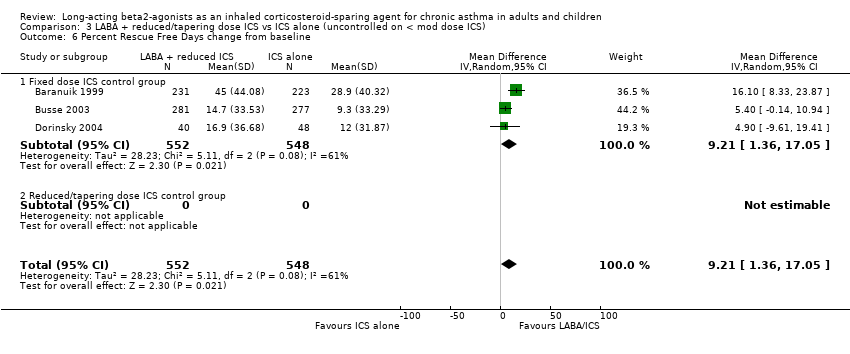
Three of these studies, all with a fixed ICS dose control group, also reported the percent rescue free days. There was a significant improvement in the percentage of days without rescue medication use for the reduced ICS/LABA group. However statistical heterogeneity was present.
Percent rescue free days: WMD 9.21 (95%CI 1.36 to 17.05). Chi2 = 5.11, P= 0.08, I2 = 60.9%, Analysis 3.7. When analysed by control at randomisation there was no inconsistency and significance maintained (Analysis 4.1).
Symptoms
Percent Symptom Free Days
There was a significant improvement in the percentage of symptom free days from baseline for the FP/salmeterol treatment group in the results of three studies evaluating FP/salmeterol to fixed dose FP alone. Percent symptom free days change from baseline: WMD 6.0 (95%CI 1.86 to 10.15), Analysis 3.6.
Symptom Score
There was a non significant reduction in symptom score from baseline for the reduced ICS/LABA combination when the results of three studies, all comparing FP/Salmeterol to FP alone and using either a 0‐4 or 0‐5 scale were pooled. Significant heterogeneity was present between the studies.
Symptom score change from baseline: SMD ‐0.16 (95%CI ‐0.40 to 0.09). Chi2 = 7.41, P= 0.03, I2 = 70.8%, Analysis 3.8. Heterogeneity could not be explained by asthma control at randomisation or delivery device. When examined by study quality low heterogeneity remained for studies with a Jadad score > 3.
Night Waking
There was no significant difference in the change in mean number of night awakenings from baseline in the two FP/salmeterol studies with a fixed dose control group that reported data that could be pooled. No heterogeneity was present.
Night Waking change from baseline: WMD 0.02 (95%CI ‐0.09 to 0.12), comparison 3.11.
Adverse Events
There was no significant difference in the occurrence of adverse events between the treatment groups in the pooled result of three studies (FP/salmeterol: n= 2, BUD/formoterol: n=1) reporting this outcome. There was no heterogeneity present and no difference with the sensitivity analysis. Adverse Events: RR 0.92 (95%CI 0.80 to 1.07), Analysis 3.10.
Overall Withdrawals
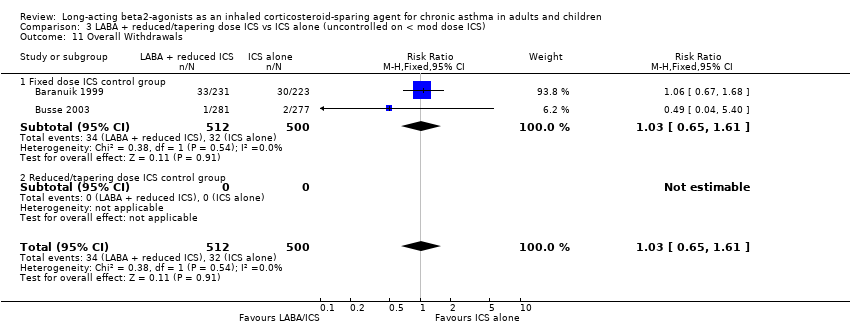
There was no significant difference in the overall withdrawals between the treatment groups in the pooled result of two studies reporting this outcome. There was no heterogeneity present. Overall Withdrawals: RR 01.03 (95%CI 0.65 to 1.61), Analysis 3.11.
Discussion
This systematic review of 10 trials suggests that in adults with asthma maintained on regular ICS it is possible to reduce maintenance ICS dose by the addition of a LABA without compromising asthma control. The results also showed that the addition of a LABA led to improved indices of airway calibre and reduced short acting beta agonist use. This is consistent with the known actions of LABA as a bronchodilator. In addition, maintenance ICS dose could be reduced without loss of asthma control or excess exacerbations. With the increasing preference for prescribed maintenance ICS/LABA combinations and the subsequent opportunities to reduce ICS doses the need to establish the efficacy of reducing ICS dose in combination with LABA whilst still maintaining asthma control is important. As there were no studies in children that met the inclusion criteria an evaluation for this group could not be conducted.
We sought to answer whether an ICS dose reduction was possible with the addition of LABA and, if so, by how much the maintenance ICS dose could be reduced. When evaluating the seven studies included in comparison 1 that compared reduced ICS doses in combination with a LABA to a fixed moderate/high ICS dose there was no significant difference between treatment groups for those experiencing exacerbations requiring OCS or withdrawing due to worsening asthma despite a reduction in their maintenance ICS dose. We defined maintenance of asthma control a priori as a change in baseline FEV1 < 200 mls. This was achieved with the reduced ICS/LABA combination treatment group also experiencing clinically small but consistent benefits in comparison to the fixed moderate/high ICS dose treatment groups. This included significant improvements in FEV1, morning and evening PEF with no heterogeneity. For FEV1 this equated to a 100 ml (95% CI 70 to 120 mls) greater improvement than those receiving ICS alone, despite receiving a lower ICS dose, which is similar to the 180 ml (95%CI 110 to 240 mls) improvement reported by Ni Chroinin 2005 for participants who received LABA in addition to their maintenance ICS. There were also significant improvements in the percent of days without rescue medications but there was moderate inconsistency among these studies. When this was explored further with a subgroup analysis based on whether their asthma was controlled at randomisation there was no inconsistency and the significance was maintained for those who were controlled at randomisation. These effects are consistent with the known bronchodilator effects of LABA.
There have been concerns that the introduction of LABA may mask airway inflammation. There were only two studies that reported this outcome. These two studies reported no differences between treatment groups in inflammatory cells when ICS was reduced in combination with LABA. These two studies, one of 12 months duration, suggest that masking of airway inflammation with the addition of LABA may not occur when ICS are continued at 200‐400 mcg day BDP equivalent. The current evidence supports that ICS dose reduction is possible when in combination with a LABA. Reducing ICS to zero (i.e.. complete cessation) whilst continuing LABA is contraindicated (Lemanske 2001) because of potential adverse effects.
The studies were varied in design. Three different study designs were examined: the effect of reducing ICS in combination with a LABA was compared to a fixed moderate high dose ICS, a reduced/tapering dose ICS and in participants whose loss of control on reduced ICS alone had been determined. In six studies the inclusion criteria included either a demonstrated deterioration in asthma control if ICS were reduced or participants had inadequate asthma control on their maintenance ICS prior to randomisation. This design provides a more accurate assessment of the degree of ICS reduction possible that is attributable to the addition of LABA. In the remaining four studies, where deterioration in asthma control was not assessed with ICS dose reduction prior to randomisation, a proportion of the ICS dose reduction may have been possible without the addition of LABA and the precise estimate of ICS reduction that could be attributed to the addition of a LABA cannot be determined.
This systematic review indicates the extent that ICS could be reduced by the addition of LABA. One study attempted to reduce ICS to zero with the addition of LABA. Lemanske 2001 reported a substantial deterioration in asthma control when ICS was reduced to zero in combination with LABA and concluded that complete ICS elimination was not achievable but that a 50% reduction in ICS dose was possible without loss of asthma control. The 6 studies in our third comparison have also demonstrated that ICS can be reduced by a mean 57% with the addition of a LABA in people whose asthma deteriorates when ICS is reduced alone. In two studies (Busse 2003; Dorinsky 2004) this was achieved for subjects requiring high dose FP (500 mcg day). We have previously reported that the dose response curve for FP reaches a plateau at 500 mcg day with minimal benefits at higher doses and a sharp increase in side effects between a moderate dose (200 mcg day) and high dose FP (500 mcg day) (Powell 2003). The addition of LABA to reduced dose ICS therefore has the potential to substantially reduce the side effects of ICS whilst maintaining asthma control.
To establish a more precise estimate of the ICS dose reduction possible we were able to evaluate the results of two studies that compared reducing ICS in combination with a LABA to reducing ICS alone. The primary outcome for these studies was the dose reduction in ICS achieved. For both studies more patients in the reduced ICS/LABA group achieved a greater reduction in ICS dose and a greater proportion attained an ICS dose reduction. However these results reached significance in only one study where Nielsen 1999 was able to reduce ICS by a mean 253 mcg day BDP. The sample size for these two studies was small leading to the possibility of a type II error in the study that did not reach significance. Due to the methods of reporting these results could not be pooled in a meta analysis. In conjunction with the attained ICS dose reduction there was no concurrent deterioration in lung function, symptoms, rescue medication use or adverse events. Overall, the results suggest that the ICS‐sparing effect of LABA is equivalent to approximately 60% of the maintenance ICS dose. In patients on high dose FP (500 mcg day) this equated to an ICS reduction of 300 mcg day FP as determined by study design.
While the improvement shown in lung function and symptoms for participants who received the reduced ICS in combination with a LABA is consistent with a bronchodilator effect of LABA. The mechanism of the ICS‐sparing effect is not defined. Possible explanations of the ICS‐sparing effect are that LABAs have anti‐inflammatory effects, that the mechanism that induces bronchodilation is the same mechanism that provides the corticosteroid‐sparing effect, or that the combination of LABA with ICS may have complementary effects on asthma.
Potential anti‐inflammatory effects of LABA are an inhibition of mast cell mediator release, and potentiation of ICS effects by increasing nuclear translocation of corticosteroid receptors. However LABA are only partially effective in asthma, since complete ICS cessation while continuing LABA is deleterious (Lemanske 2001). Potential complementary effects of LABA and ICS in asthma relate to the heterogeneity of airway inflammation in asthma.
In studying the ICS‐sparing effect of LABA there is an assumption that the asthma population is homogenous and responds to treatment in the same way. However we know that there is heterogeneity of the asthma population and that some people with asthma are not responsive to ICS, in particular people with non eosinophilic asthma. It could be argued that the ICS‐sparing qualities seen occur in this portion of the asthma population. In comparison 3 of this review however, we have demonstrated that ICS can be reduced with the addition of LABA in participants who have demonstrated deterioration in asthma control when ICS is reduced alone. This would indicate that it is not just that portion of people with asthma who do not respond to ICS that are able to reduce their ICS with the addition of LABA but also those who are ICS dependent.
This review supports the ICS‐sparing qualities of ICS/LABA combination therapy. ICS dose reduction in adults may be attained with the use of ICS/LABA combination therapy without deterioration in asthma control. However no studies have been carried out in children so the results may not be generalisable under the age of 12 years.

Comparison 1 LABA + reduced/tapering dose ICS vs fixed mod/high dose ICS, Outcome 1 Severe exacerbation requiring OCS.
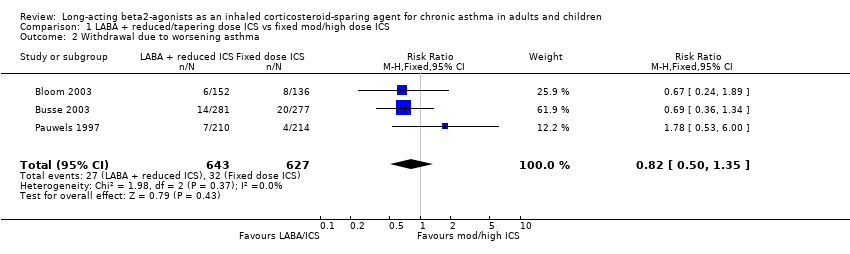
Comparison 1 LABA + reduced/tapering dose ICS vs fixed mod/high dose ICS, Outcome 2 Withdrawal due to worsening asthma.

Comparison 1 LABA + reduced/tapering dose ICS vs fixed mod/high dose ICS, Outcome 3 FEV1 (L) change from baseline.

Comparison 1 LABA + reduced/tapering dose ICS vs fixed mod/high dose ICS, Outcome 4 FEV1 (percent predicted).
Comparison 1 LABA + reduced/tapering dose ICS vs fixed mod/high dose ICS, Outcome 5 Morning PEF (L/min) change from baseline.

Comparison 1 LABA + reduced/tapering dose ICS vs fixed mod/high dose ICS, Outcome 6 Evening PEF (L/min) change from baseline.

Comparison 1 LABA + reduced/tapering dose ICS vs fixed mod/high dose ICS, Outcome 7 Rescue medications (puffs/day) change from baseline.

Comparison 1 LABA + reduced/tapering dose ICS vs fixed mod/high dose ICS, Outcome 8 Percent Rescue Free Days change from baseline.
Comparison 1 LABA + reduced/tapering dose ICS vs fixed mod/high dose ICS, Outcome 9 Percent Symptom Free Days.
Comparison 1 LABA + reduced/tapering dose ICS vs fixed mod/high dose ICS, Outcome 10 Symptom Score change from baseline.
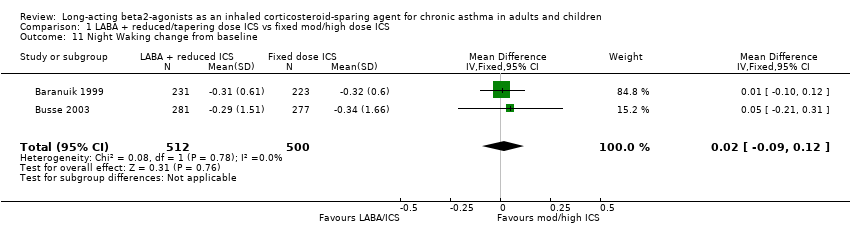
Comparison 1 LABA + reduced/tapering dose ICS vs fixed mod/high dose ICS, Outcome 11 Night Waking change from baseline.

Comparison 1 LABA + reduced/tapering dose ICS vs fixed mod/high dose ICS, Outcome 12 Adverse Events.

Comparison 1 LABA + reduced/tapering dose ICS vs fixed mod/high dose ICS, Outcome 13 Overall Withdrawals.
Comparison 2 LABA + reduced/tapering dose ICS vs reduced/tapering dose ICS, Outcome 1 FEV1 (L) change from baseline.
Comparison 2 LABA + reduced/tapering dose ICS vs reduced/tapering dose ICS, Outcome 2 Morning PEF (L/min) change from baseline.

Comparison 3 LABA + reduced/tapering dose ICS vs ICS alone (uncontrolled on < mod dose ICS), Outcome 1 Withdrawal due to worsening asthma.

Comparison 3 LABA + reduced/tapering dose ICS vs ICS alone (uncontrolled on < mod dose ICS), Outcome 2 FEV1 (L) change from baseline.
Comparison 3 LABA + reduced/tapering dose ICS vs ICS alone (uncontrolled on < mod dose ICS), Outcome 3 Morning PEF (L/min) change from baseline.

Comparison 3 LABA + reduced/tapering dose ICS vs ICS alone (uncontrolled on < mod dose ICS), Outcome 4 Evening PEF (L/min) change from baseline.
Comparison 3 LABA + reduced/tapering dose ICS vs ICS alone (uncontrolled on < mod dose ICS), Outcome 5 Rescue medications change from baseline.
Comparison 3 LABA + reduced/tapering dose ICS vs ICS alone (uncontrolled on < mod dose ICS), Outcome 6 Percent Rescue Free Days change from baseline.

Comparison 3 LABA + reduced/tapering dose ICS vs ICS alone (uncontrolled on < mod dose ICS), Outcome 7 Percent symptom free days change from baseline.

Comparison 3 LABA + reduced/tapering dose ICS vs ICS alone (uncontrolled on < mod dose ICS), Outcome 8 Symptom Score change from baseline.

Comparison 3 LABA + reduced/tapering dose ICS vs ICS alone (uncontrolled on < mod dose ICS), Outcome 9 Night Waking change from baseline.

Comparison 3 LABA + reduced/tapering dose ICS vs ICS alone (uncontrolled on < mod dose ICS), Outcome 10 Adverse Events.
Comparison 3 LABA + reduced/tapering dose ICS vs ICS alone (uncontrolled on < mod dose ICS), Outcome 11 Overall Withdrawals.

Comparison 4 LABA + reduced/tapering dose ICS vs fixed mod/high dose ICS (asthma control), Outcome 1 Percent Rescue Free Days change from baseline.

Comparison 4 LABA + reduced/tapering dose ICS vs fixed mod/high dose ICS (asthma control), Outcome 2 Percent Symptom Free Days change from baseline.
Comparison 4 LABA + reduced/tapering dose ICS vs fixed mod/high dose ICS (asthma control), Outcome 3 Symptom Score change from baseline.
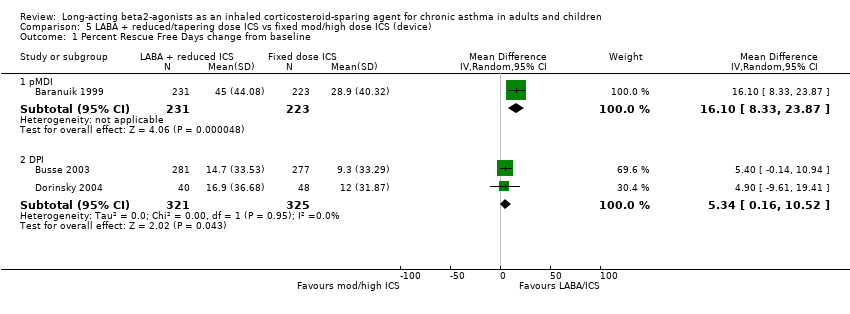
Comparison 5 LABA + reduced/tapering dose ICS vs fixed mod/high dose ICS (device), Outcome 1 Percent Rescue Free Days change from baseline.
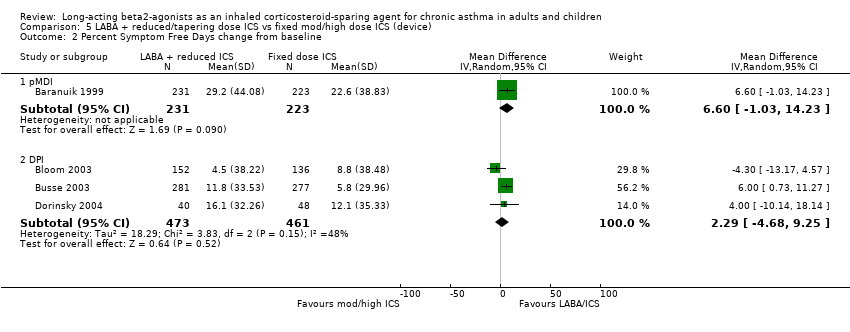
Comparison 5 LABA + reduced/tapering dose ICS vs fixed mod/high dose ICS (device), Outcome 2 Percent Symptom Free Days change from baseline.
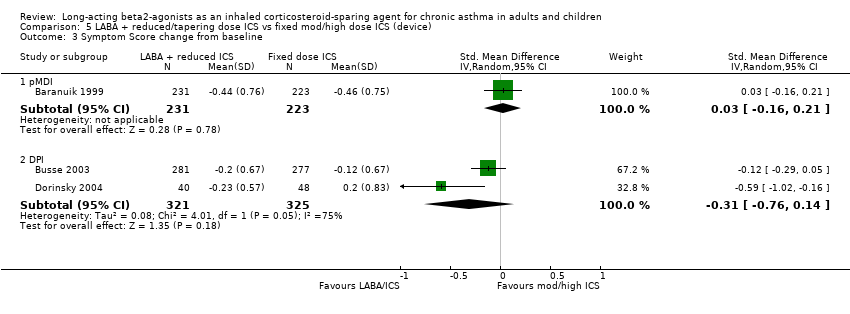
Comparison 5 LABA + reduced/tapering dose ICS vs fixed mod/high dose ICS (device), Outcome 3 Symptom Score change from baseline.
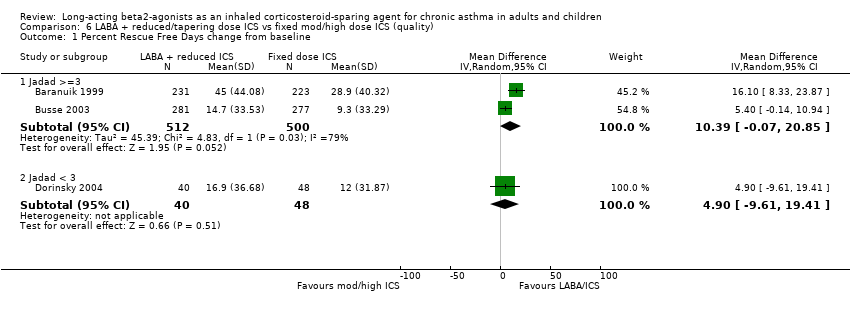
Comparison 6 LABA + reduced/tapering dose ICS vs fixed mod/high dose ICS (quality), Outcome 1 Percent Rescue Free Days change from baseline.
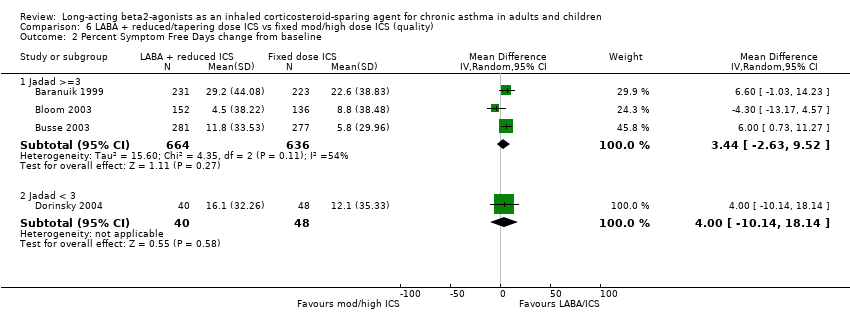
Comparison 6 LABA + reduced/tapering dose ICS vs fixed mod/high dose ICS (quality), Outcome 2 Percent Symptom Free Days change from baseline.
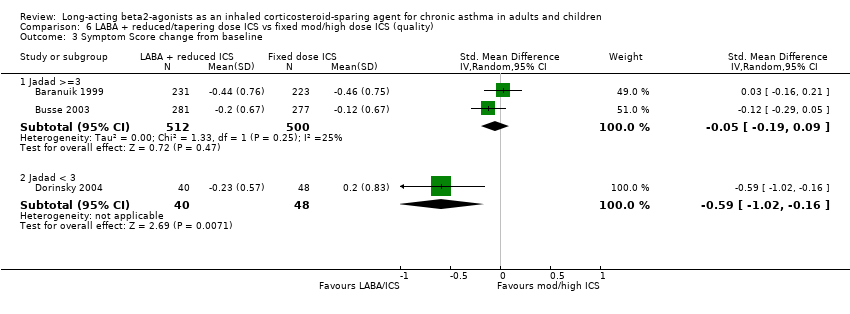
Comparison 6 LABA + reduced/tapering dose ICS vs fixed mod/high dose ICS (quality), Outcome 3 Symptom Score change from baseline.
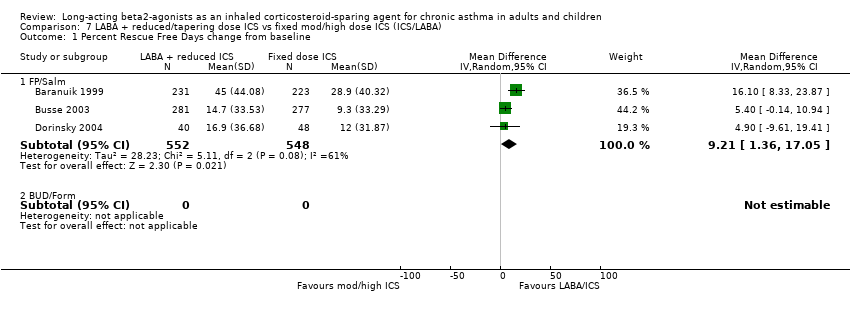
Comparison 7 LABA + reduced/tapering dose ICS vs fixed mod/high dose ICS (ICS/LABA), Outcome 1 Percent Rescue Free Days change from baseline.

Comparison 7 LABA + reduced/tapering dose ICS vs fixed mod/high dose ICS (ICS/LABA), Outcome 2 Percent Symptom Free Days change from baseline.
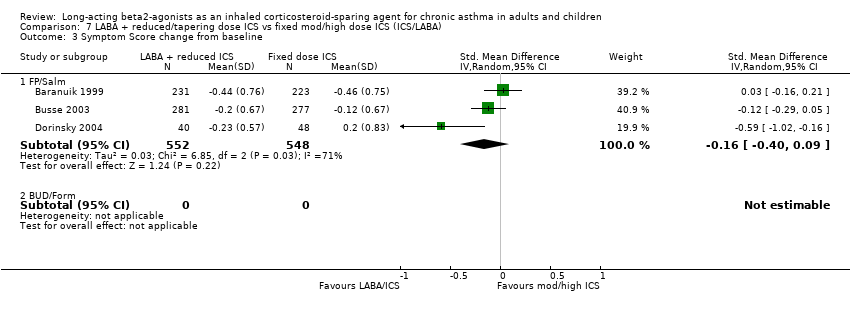
Comparison 7 LABA + reduced/tapering dose ICS vs fixed mod/high dose ICS (ICS/LABA), Outcome 3 Symptom Score change from baseline.

Comparison 8 LABA + reduced/tapering dose ICS vs fixed mod/high dose ICS (duration), Outcome 1 Percent Rescue Free Days change from baseline.
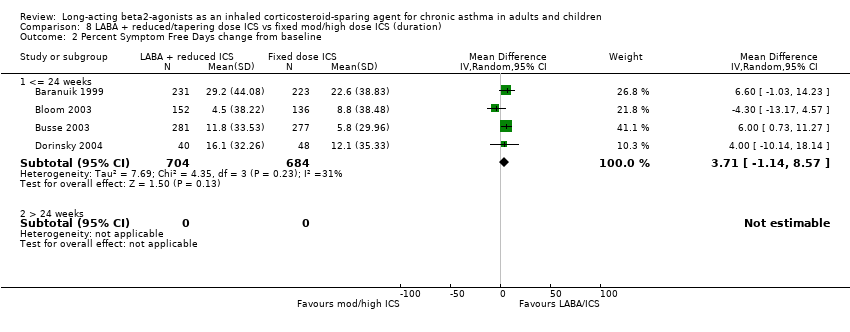
Comparison 8 LABA + reduced/tapering dose ICS vs fixed mod/high dose ICS (duration), Outcome 2 Percent Symptom Free Days change from baseline.
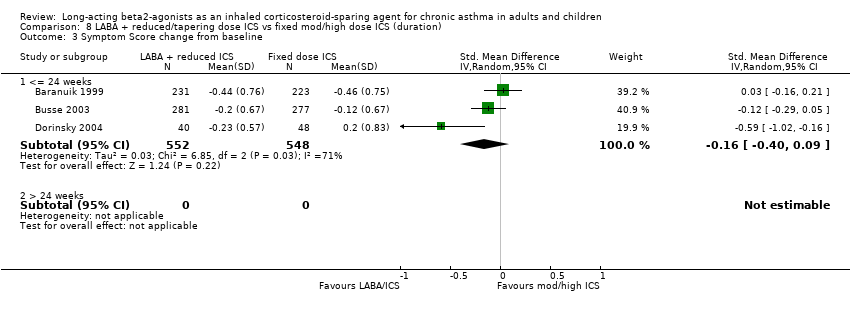
Comparison 8 LABA + reduced/tapering dose ICS vs fixed mod/high dose ICS (duration), Outcome 3 Symptom Score change from baseline.
| Outcome or subgroup title | No. of studies | No. of participants | Statistical method | Effect size |
| 1 Severe exacerbation requiring OCS Show forest plot | 2 | 484 | Risk Ratio (M‐H, Fixed, 95% CI) | 1.00 [0.76, 1.32] |
| 2 Withdrawal due to worsening asthma Show forest plot | 3 | 1270 | Risk Ratio (M‐H, Fixed, 95% CI) | 0.82 [0.50, 1.35] |
| 3 FEV1 (L) change from baseline Show forest plot | 4 | 1388 | Mean Difference (IV, Fixed, 95% CI) | 0.10 [0.07, 0.12] |
| 4 FEV1 (percent predicted) Show forest plot | 3 | Mean Difference (IV, Fixed, 95% CI) | Subtotals only | |
| 4.1 Change from baseline | 1 | 454 | Mean Difference (IV, Fixed, 95% CI) | 2.70 [0.06, 5.34] |
| 4.2 End of Study | 2 | 455 | Mean Difference (IV, Fixed, 95% CI) | 3.62 [1.65, 5.59] |
| 5 Morning PEF (L/min) change from baseline Show forest plot | 4 | 1388 | Mean Difference (IV, Fixed, 95% CI) | 16.68 [9.13, 24.24] |
| 6 Evening PEF (L/min) change from baseline Show forest plot | 3 | 1100 | Mean Difference (IV, Fixed, 95% CI) | 12.56 [4.90, 20.22] |
| 7 Rescue medications (puffs/day) change from baseline Show forest plot | 4 | 1388 | Mean Difference (IV, Fixed, 95% CI) | ‐0.11 [‐0.25, 0.03] |
| 8 Percent Rescue Free Days change from baseline Show forest plot | 3 | 1100 | Mean Difference (IV, Random, 95% CI) | 9.21 [1.36, 17.05] |
| 9 Percent Symptom Free Days Show forest plot | 5 | Mean Difference (IV, Random, 95% CI) | Subtotals only | |
| 9.1 Change from baseline | 4 | 1388 | Mean Difference (IV, Random, 95% CI) | 3.71 [‐1.14, 8.57] |
| 9.2 End of Study | 1 | 60 | Mean Difference (IV, Random, 95% CI) | 10.90 [‐7.40, 29.20] |
| 10 Symptom Score change from baseline Show forest plot | 3 | 1100 | Std. Mean Difference (IV, Random, 95% CI) | ‐0.16 [‐0.40, 0.09] |
| 11 Night Waking change from baseline Show forest plot | 2 | 1012 | Mean Difference (IV, Fixed, 95% CI) | 0.02 [‐0.09, 0.12] |
| 12 Adverse Events Show forest plot | 3 | 1436 | Risk Ratio (M‐H, Fixed, 95% CI) | 0.92 [0.79, 1.07] |
| 13 Overall Withdrawals Show forest plot | 3 | 1436 | Risk Ratio (M‐H, Fixed, 95% CI) | 0.97 [0.74, 1.28] |
| Outcome or subgroup title | No. of studies | No. of participants | Statistical method | Effect size |
| 1 FEV1 (L) change from baseline Show forest plot | 2 | 127 | Mean Difference (IV, Fixed, 95% CI) | 0.21 [0.00, 0.41] |
| 2 Morning PEF (L/min) change from baseline Show forest plot | 2 | 127 | Mean Difference (IV, Fixed, 95% CI) | 7.80 [‐14.24, 29.85] |
| Outcome or subgroup title | No. of studies | No. of participants | Statistical method | Effect size |
| 1 Withdrawal due to worsening asthma Show forest plot | 1 | 558 | Risk Ratio (M‐H, Fixed, 95% CI) | 0.69 [0.36, 1.34] |
| 1.1 Fixed dose ICS control group | 1 | 558 | Risk Ratio (M‐H, Fixed, 95% CI) | 0.69 [0.36, 1.34] |
| 1.2 Reduced/tapering dose ICS control group | 0 | 0 | Risk Ratio (M‐H, Fixed, 95% CI) | 0.0 [0.0, 0.0] |
| 2 FEV1 (L) change from baseline Show forest plot | 4 | 1134 | Mean Difference (IV, Fixed, 95% CI) | 0.10 [0.07, 0.12] |
| 2.1 Fixed dose ICS control group | 3 | 1100 | Mean Difference (IV, Fixed, 95% CI) | 0.10 [0.07, 0.12] |
| 2.2 Reduced/tapering dose ICS control group | 1 | 34 | Mean Difference (IV, Fixed, 95% CI) | 0.2 [‐0.33, 0.73] |
| 3 Morning PEF (L/min) change from baseline Show forest plot | 4 | 1134 | Mean Difference (IV, Fixed, 95% CI) | 15.59 [7.89, 23.29] |
| 3.1 Fixed dose ICS control group | 3 | 1100 | Mean Difference (IV, Fixed, 95% CI) | 15.79 [7.70, 23.87] |
| 3.2 Reduced/tapering dose ICS control group | 1 | 34 | Mean Difference (IV, Fixed, 95% CI) | 13.7 [‐11.43, 38.83] |
| 4 Evening PEF (L/min) change from baseline Show forest plot | 4 | 1134 | Mean Difference (IV, Fixed, 95% CI) | 12.45 [5.05, 19.84] |
| 4.1 Fixed dose ICS control group | 3 | 1100 | Mean Difference (IV, Fixed, 95% CI) | 12.56 [4.90, 20.22] |
| 4.2 Reduced/tapering dose ICS control group | 1 | 34 | Mean Difference (IV, Fixed, 95% CI) | 10.90 [‐17.28, 39.08] |
| 5 Rescue medications change from baseline Show forest plot | 4 | 1134 | Std. Mean Difference (IV, Random, 95% CI) | ‐0.15 [‐0.30, 0.01] |
| 5.1 Fixed dose ICS control group | 3 | 1100 | Std. Mean Difference (IV, Random, 95% CI) | ‐0.12 [‐0.24, ‐0.00] |
| 5.2 Reduced/tapering dose ICS control group | 1 | 34 | Std. Mean Difference (IV, Random, 95% CI) | ‐0.79 [‐1.50, ‐0.09] |
| 6 Percent Rescue Free Days change from baseline Show forest plot | 3 | 1100 | Mean Difference (IV, Random, 95% CI) | 9.21 [1.36, 17.05] |
| 6.1 Fixed dose ICS control group | 3 | 1100 | Mean Difference (IV, Random, 95% CI) | 9.21 [1.36, 17.05] |
| 6.2 Reduced/tapering dose ICS control group | 0 | 0 | Mean Difference (IV, Random, 95% CI) | 0.0 [0.0, 0.0] |
| 7 Percent symptom free days change from baseline Show forest plot | 3 | 1100 | Mean Difference (IV, Fixed, 95% CI) | 6.00 [1.86, 10.15] |
| 7.1 Fixed dose ICS control group | 3 | 1100 | Mean Difference (IV, Fixed, 95% CI) | 6.00 [1.86, 10.15] |
| 7.2 Reduced/tapering dose ICS control group | 0 | 0 | Mean Difference (IV, Fixed, 95% CI) | 0.0 [0.0, 0.0] |
| 8 Symptom Score change from baseline Show forest plot | 3 | 1100 | Std. Mean Difference (IV, Random, 95% CI) | ‐0.16 [‐0.40, 0.09] |
| 8.1 Fixed dose ICS control group | 3 | 1100 | Std. Mean Difference (IV, Random, 95% CI) | ‐0.16 [‐0.40, 0.09] |
| 8.2 Reduced/tapering dose ICS control group | 0 | 0 | Std. Mean Difference (IV, Random, 95% CI) | 0.0 [0.0, 0.0] |
| 9 Night Waking change from baseline Show forest plot | 2 | 1012 | Mean Difference (IV, Fixed, 95% CI) | 0.02 [‐0.09, 0.12] |
| 9.1 Fixed dose ICS control group | 2 | 1012 | Mean Difference (IV, Fixed, 95% CI) | 0.02 [‐0.09, 0.12] |
| 9.2 Reduced/tapering dose ICS control group | 0 | 0 | Mean Difference (IV, Fixed, 95% CI) | 0.0 [0.0, 0.0] |
| 10 Adverse Events Show forest plot | 3 | 1046 | Risk Ratio (M‐H, Fixed, 95% CI) | 0.92 [0.80, 1.07] |
| 10.1 Fixed dose ICS control group | 2 | 1012 | Risk Ratio (M‐H, Fixed, 95% CI) | 0.92 [0.79, 1.08] |
| 10.2 Reduced/tapering dose ICS control group | 1 | 34 | Risk Ratio (M‐H, Fixed, 95% CI) | 0.93 [0.63, 1.36] |
| 11 Overall Withdrawals Show forest plot | 2 | 1012 | Risk Ratio (M‐H, Fixed, 95% CI) | 1.03 [0.65, 1.61] |
| 11.1 Fixed dose ICS control group | 2 | 1012 | Risk Ratio (M‐H, Fixed, 95% CI) | 1.03 [0.65, 1.61] |
| 11.2 Reduced/tapering dose ICS control group | 0 | 0 | Risk Ratio (M‐H, Fixed, 95% CI) | 0.0 [0.0, 0.0] |
| Outcome or subgroup title | No. of studies | No. of participants | Statistical method | Effect size |
| 1 Percent Rescue Free Days change from baseline Show forest plot | 3 | Mean Difference (IV, Random, 95% CI) | Subtotals only | |
| 1.1 Controlled | 2 | 646 | Mean Difference (IV, Random, 95% CI) | 5.34 [0.16, 10.52] |
| 1.2 Uncontrolled | 1 | 454 | Mean Difference (IV, Random, 95% CI) | 16.1 [8.33, 23.87] |
| 1.3 Unknown | 0 | 0 | Mean Difference (IV, Random, 95% CI) | 0.0 [0.0, 0.0] |
| 2 Percent Symptom Free Days change from baseline Show forest plot | 4 | Mean Difference (IV, Random, 95% CI) | Subtotals only | |
| 2.1 Controlled | 2 | 646 | Mean Difference (IV, Random, 95% CI) | 5.76 [0.81, 10.70] |
| 2.2 Uncontrolled | 1 | 454 | Mean Difference (IV, Random, 95% CI) | 6.60 [‐1.03, 14.23] |
| 2.3 Unknown | 1 | 288 | Mean Difference (IV, Random, 95% CI) | ‐4.30 [‐13.17, 4.57] |
| 3 Symptom Score change from baseline Show forest plot | 3 | Std. Mean Difference (IV, Random, 95% CI) | Subtotals only | |
| 3.1 Controlled | 2 | 646 | Std. Mean Difference (IV, Random, 95% CI) | ‐0.31 [‐0.76, 0.14] |
| 3.2 Uncontrolled | 1 | 454 | Std. Mean Difference (IV, Random, 95% CI) | 0.03 [‐0.16, 0.21] |
| 3.3 Unknown | 0 | 0 | Std. Mean Difference (IV, Random, 95% CI) | 0.0 [0.0, 0.0] |
| Outcome or subgroup title | No. of studies | No. of participants | Statistical method | Effect size |
| 1 Percent Rescue Free Days change from baseline Show forest plot | 3 | Mean Difference (IV, Random, 95% CI) | Subtotals only | |
| 1.1 pMDI | 1 | 454 | Mean Difference (IV, Random, 95% CI) | 16.1 [8.33, 23.87] |
| 1.2 DPI | 2 | 646 | Mean Difference (IV, Random, 95% CI) | 5.34 [0.16, 10.52] |
| 2 Percent Symptom Free Days change from baseline Show forest plot | 4 | Mean Difference (IV, Random, 95% CI) | Subtotals only | |
| 2.1 pMDI | 1 | 454 | Mean Difference (IV, Random, 95% CI) | 6.60 [‐1.03, 14.23] |
| 2.2 DPI | 3 | 934 | Mean Difference (IV, Random, 95% CI) | 2.29 [‐4.68, 9.25] |
| 3 Symptom Score change from baseline Show forest plot | 3 | Std. Mean Difference (IV, Random, 95% CI) | Subtotals only | |
| 3.1 pMDI | 1 | 454 | Std. Mean Difference (IV, Random, 95% CI) | 0.03 [‐0.16, 0.21] |
| 3.2 DPI | 2 | 646 | Std. Mean Difference (IV, Random, 95% CI) | ‐0.31 [‐0.76, 0.14] |
| Outcome or subgroup title | No. of studies | No. of participants | Statistical method | Effect size |
| 1 Percent Rescue Free Days change from baseline Show forest plot | 3 | Mean Difference (IV, Random, 95% CI) | Subtotals only | |
| 1.1 Jadad >=3 | 2 | 1012 | Mean Difference (IV, Random, 95% CI) | 10.39 [‐0.07, 20.85] |
| 1.2 Jadad < 3 | 1 | 88 | Mean Difference (IV, Random, 95% CI) | 4.90 [‐9.61, 19.41] |
| 2 Percent Symptom Free Days change from baseline Show forest plot | 4 | Mean Difference (IV, Random, 95% CI) | Subtotals only | |
| 2.1 Jadad >=3 | 3 | 1300 | Mean Difference (IV, Random, 95% CI) | 3.44 [‐2.63, 9.52] |
| 2.2 Jadad < 3 | 1 | 88 | Mean Difference (IV, Random, 95% CI) | 4.00 [‐10.14, 18.14] |
| 3 Symptom Score change from baseline Show forest plot | 3 | Std. Mean Difference (IV, Random, 95% CI) | Subtotals only | |
| 3.1 Jadad >=3 | 2 | 1012 | Std. Mean Difference (IV, Random, 95% CI) | ‐0.05 [‐0.19, 0.09] |
| 3.2 Jadad < 3 | 1 | 88 | Std. Mean Difference (IV, Random, 95% CI) | ‐0.59 [‐1.02, ‐0.16] |
| Outcome or subgroup title | No. of studies | No. of participants | Statistical method | Effect size |
| 1 Percent Rescue Free Days change from baseline Show forest plot | 3 | Mean Difference (IV, Random, 95% CI) | Subtotals only | |
| 1.1 FP/Salm | 3 | 1100 | Mean Difference (IV, Random, 95% CI) | 9.21 [1.36, 17.05] |
| 1.2 BUD/Form | 0 | 0 | Mean Difference (IV, Random, 95% CI) | 0.0 [0.0, 0.0] |
| 2 Percent Symptom Free Days change from baseline Show forest plot | 4 | Mean Difference (IV, Random, 95% CI) | Subtotals only | |
| 2.1 FP/Salm | 4 | 1388 | Mean Difference (IV, Random, 95% CI) | 3.71 [‐1.14, 8.57] |
| 2.2 BUD/Form | 0 | 0 | Mean Difference (IV, Random, 95% CI) | 0.0 [0.0, 0.0] |
| 3 Symptom Score change from baseline Show forest plot | 3 | Std. Mean Difference (IV, Random, 95% CI) | Subtotals only | |
| 3.1 FP/Salm | 3 | 1100 | Std. Mean Difference (IV, Random, 95% CI) | ‐0.16 [‐0.40, 0.09] |
| 3.2 BUD/Form | 0 | 0 | Std. Mean Difference (IV, Random, 95% CI) | 0.0 [0.0, 0.0] |
| Outcome or subgroup title | No. of studies | No. of participants | Statistical method | Effect size |
| 1 Percent Rescue Free Days change from baseline Show forest plot | 3 | Mean Difference (IV, Random, 95% CI) | Subtotals only | |
| 1.1 <= 24 weeks | 3 | 1100 | Mean Difference (IV, Random, 95% CI) | 9.21 [1.36, 17.05] |
| 1.2 > 24 weeks | 0 | 0 | Mean Difference (IV, Random, 95% CI) | 0.0 [0.0, 0.0] |
| 2 Percent Symptom Free Days change from baseline Show forest plot | 4 | Mean Difference (IV, Random, 95% CI) | Subtotals only | |
| 2.1 <= 24 weeks | 4 | 1388 | Mean Difference (IV, Random, 95% CI) | 3.71 [‐1.14, 8.57] |
| 2.2 > 24 weeks | 0 | 0 | Mean Difference (IV, Random, 95% CI) | 0.0 [0.0, 0.0] |
| 3 Symptom Score change from baseline Show forest plot | 3 | Std. Mean Difference (IV, Random, 95% CI) | Subtotals only | |
| 3.1 <= 24 weeks | 3 | 1100 | Std. Mean Difference (IV, Random, 95% CI) | ‐0.16 [‐0.40, 0.09] |
| 3.2 > 24 weeks | 0 | 0 | Std. Mean Difference (IV, Random, 95% CI) | 0.0 [0.0, 0.0] |