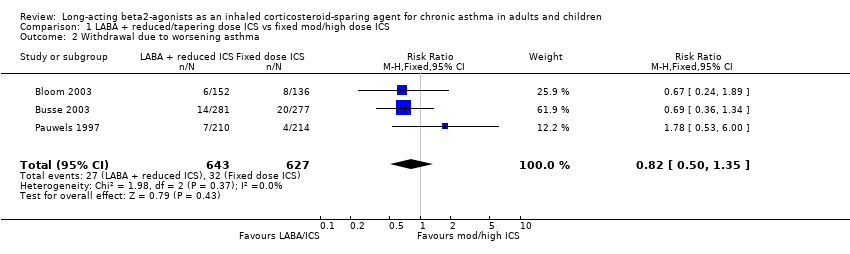
| 1 Withdrawal due to worsening asthma Show forest plot | 1 | 558 | Risk Ratio (M‐H, Fixed, 95% CI) | 0.69 [0.36, 1.34] |
|
| 1.1 Fixed dose ICS control group | 1 | 558 | Risk Ratio (M‐H, Fixed, 95% CI) | 0.69 [0.36, 1.34] |
| 1.2 Reduced/tapering dose ICS control group | 0 | 0 | Risk Ratio (M‐H, Fixed, 95% CI) | 0.0 [0.0, 0.0] |
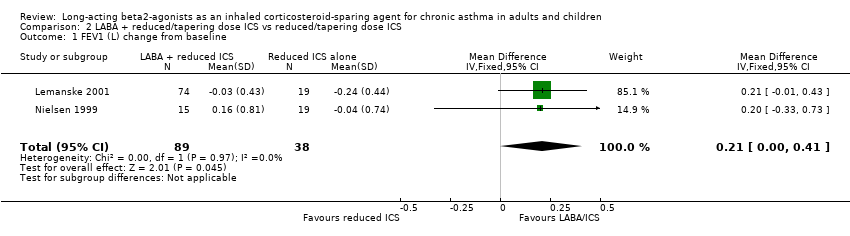
| 2 FEV1 (L) change from baseline Show forest plot | 4 | 1134 | Mean Difference (IV, Fixed, 95% CI) | 0.10 [0.07, 0.12] |
|
| 2.1 Fixed dose ICS control group | 3 | 1100 | Mean Difference (IV, Fixed, 95% CI) | 0.10 [0.07, 0.12] |
| 2.2 Reduced/tapering dose ICS control group | 1 | 34 | Mean Difference (IV, Fixed, 95% CI) | 0.2 [‐0.33, 0.73] |
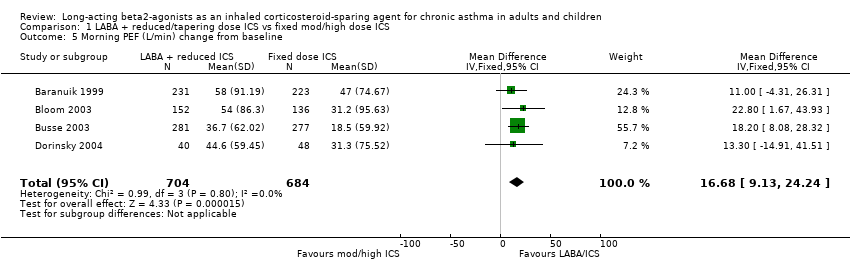
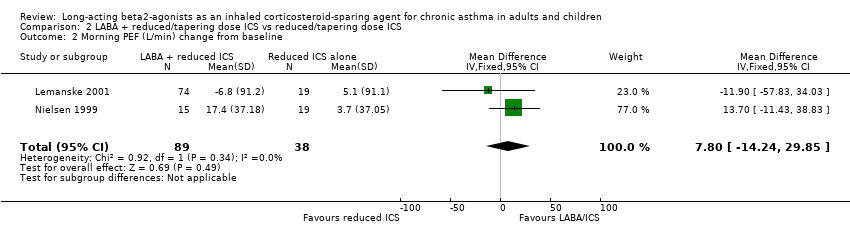
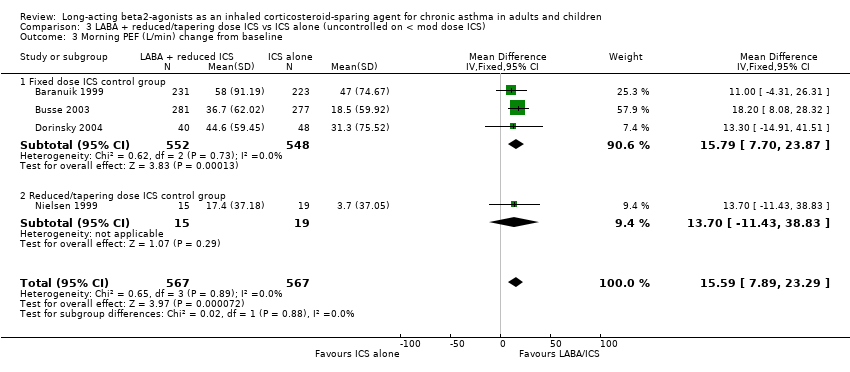
| 3 Morning PEF (L/min) change from baseline Show forest plot | 4 | 1134 | Mean Difference (IV, Fixed, 95% CI) | 15.59 [7.89, 23.29] |
|
| 3.1 Fixed dose ICS control group | 3 | 1100 | Mean Difference (IV, Fixed, 95% CI) | 15.79 [7.70, 23.87] |
| 3.2 Reduced/tapering dose ICS control group | 1 | 34 | Mean Difference (IV, Fixed, 95% CI) | 13.7 [‐11.43, 38.83] |
| 4 Evening PEF (L/min) change from baseline Show forest plot | 4 | 1134 | Mean Difference (IV, Fixed, 95% CI) | 12.45 [5.05, 19.84] |
|
| 4.1 Fixed dose ICS control group | 3 | 1100 | Mean Difference (IV, Fixed, 95% CI) | 12.56 [4.90, 20.22] |
| 4.2 Reduced/tapering dose ICS control group | 1 | 34 | Mean Difference (IV, Fixed, 95% CI) | 10.90 [‐17.28, 39.08] |
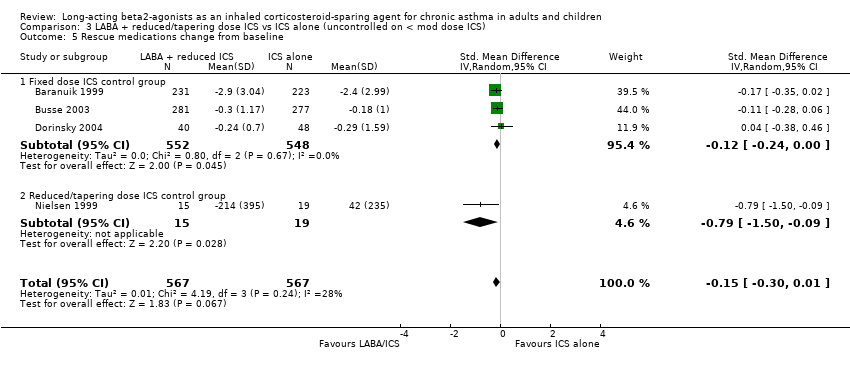
| 5 Rescue medications change from baseline Show forest plot | 4 | 1134 | Std. Mean Difference (IV, Random, 95% CI) | ‐0.15 [‐0.30, 0.01] |
|
| 5.1 Fixed dose ICS control group | 3 | 1100 | Std. Mean Difference (IV, Random, 95% CI) | ‐0.12 [‐0.24, ‐0.00] |
| 5.2 Reduced/tapering dose ICS control group | 1 | 34 | Std. Mean Difference (IV, Random, 95% CI) | ‐0.79 [‐1.50, ‐0.09] |
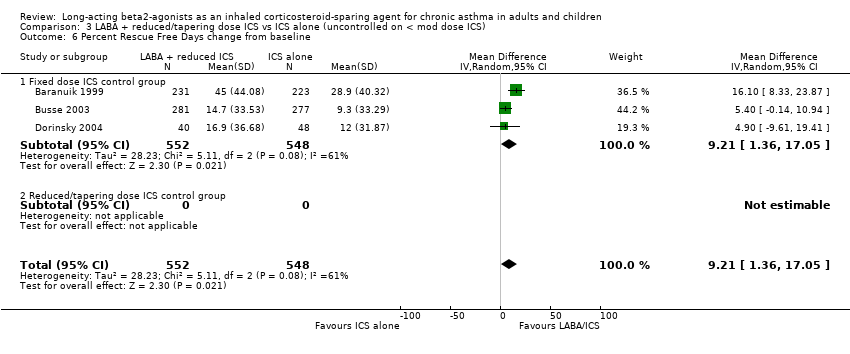
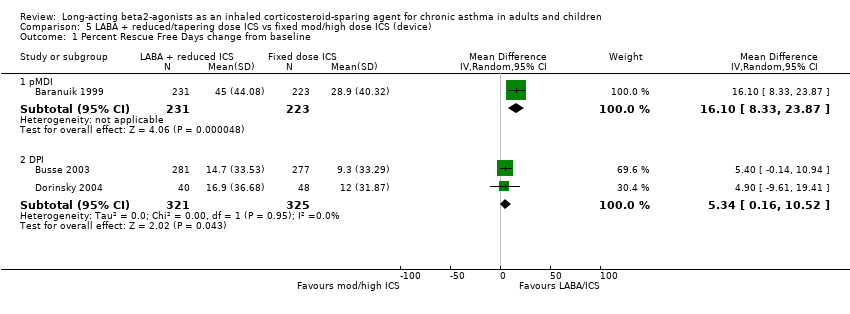
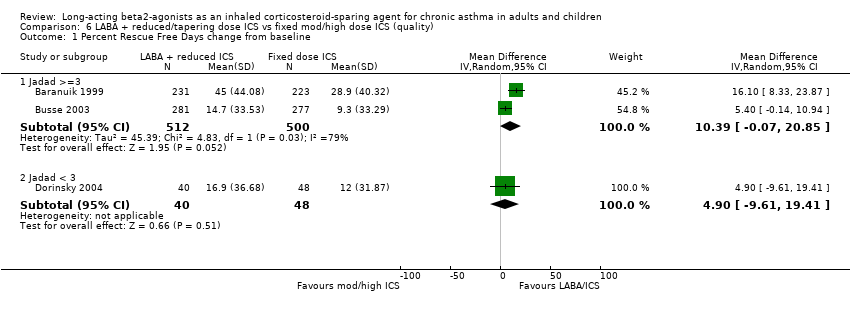
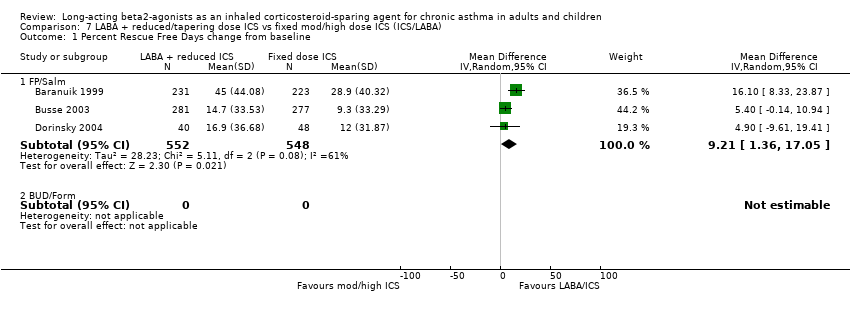
| 6 Percent Rescue Free Days change from baseline Show forest plot | 3 | 1100 | Mean Difference (IV, Random, 95% CI) | 9.21 [1.36, 17.05] |
|
| 6.1 Fixed dose ICS control group | 3 | 1100 | Mean Difference (IV, Random, 95% CI) | 9.21 [1.36, 17.05] |
| 6.2 Reduced/tapering dose ICS control group | 0 | 0 | Mean Difference (IV, Random, 95% CI) | 0.0 [0.0, 0.0] |
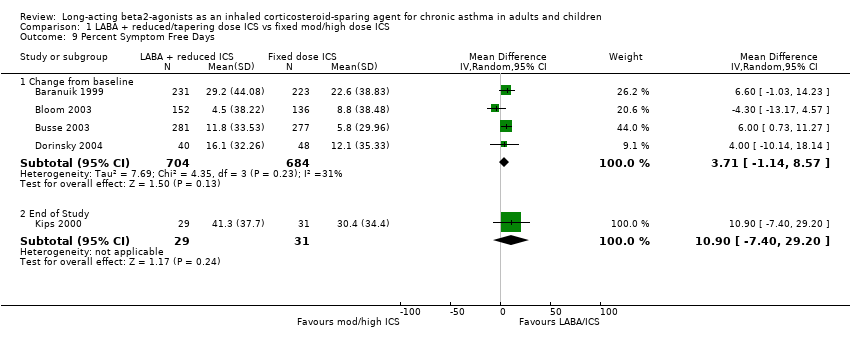
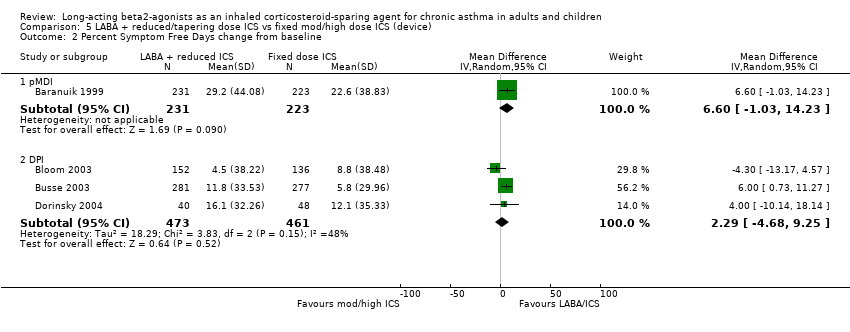
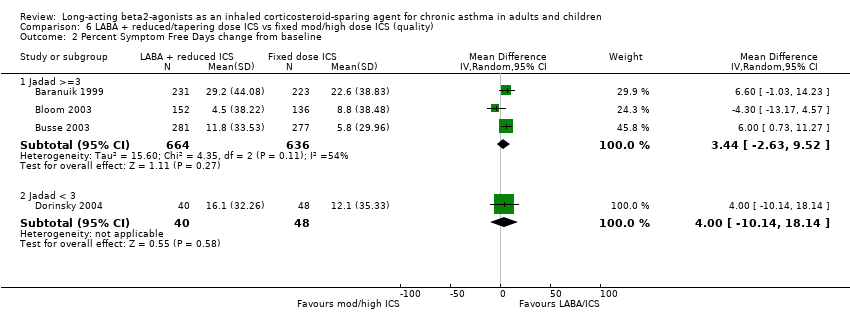
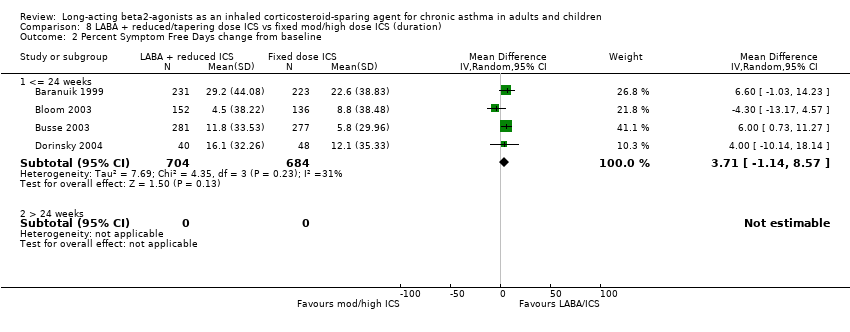
| 7 Percent symptom free days change from baseline Show forest plot | 3 | 1100 | Mean Difference (IV, Fixed, 95% CI) | 6.00 [1.86, 10.15] |
|
| 7.1 Fixed dose ICS control group | 3 | 1100 | Mean Difference (IV, Fixed, 95% CI) | 6.00 [1.86, 10.15] |
| 7.2 Reduced/tapering dose ICS control group | 0 | 0 | Mean Difference (IV, Fixed, 95% CI) | 0.0 [0.0, 0.0] |
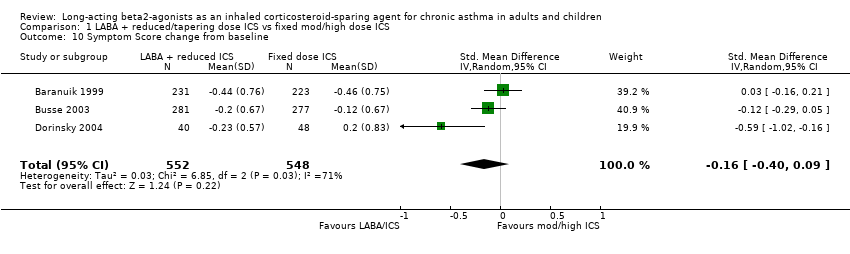
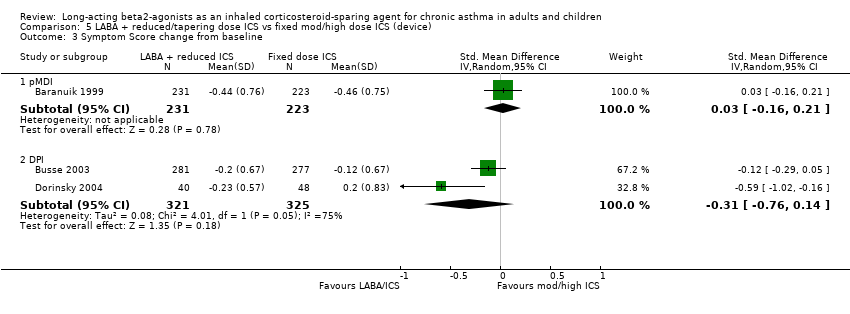
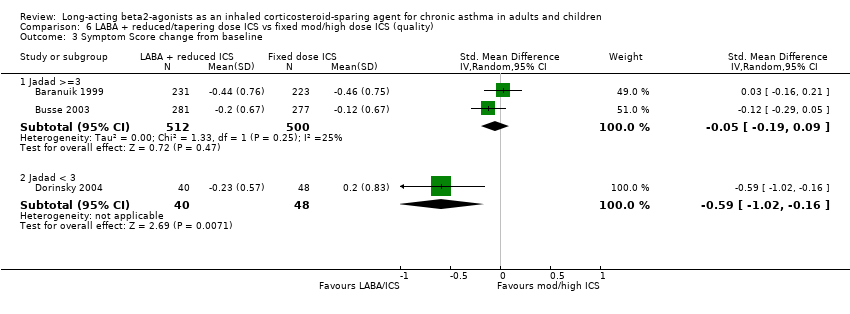
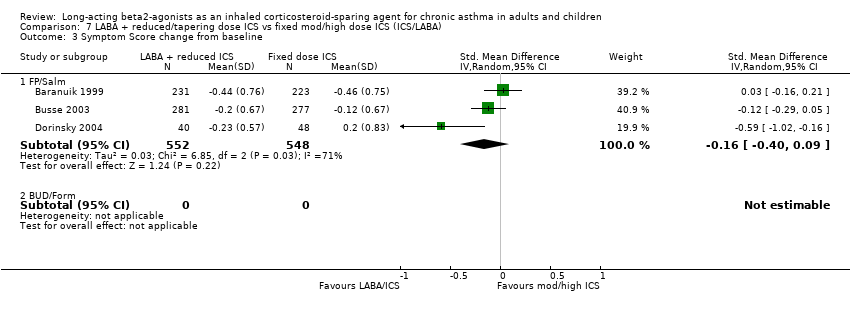
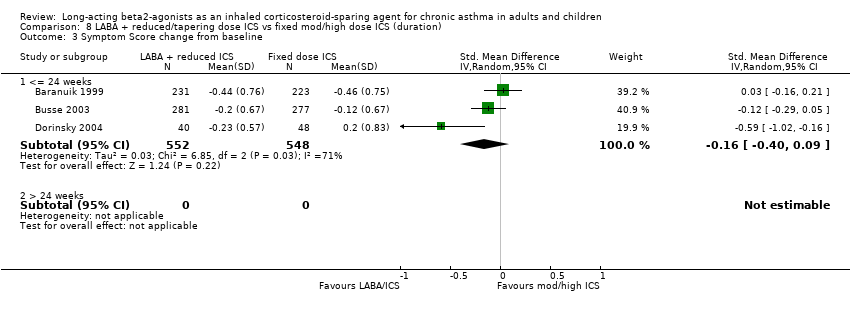
| 8 Symptom Score change from baseline Show forest plot | 3 | 1100 | Std. Mean Difference (IV, Random, 95% CI) | ‐0.16 [‐0.40, 0.09] |
|
| 8.1 Fixed dose ICS control group | 3 | 1100 | Std. Mean Difference (IV, Random, 95% CI) | ‐0.16 [‐0.40, 0.09] |
| 8.2 Reduced/tapering dose ICS control group | 0 | 0 | Std. Mean Difference (IV, Random, 95% CI) | 0.0 [0.0, 0.0] |
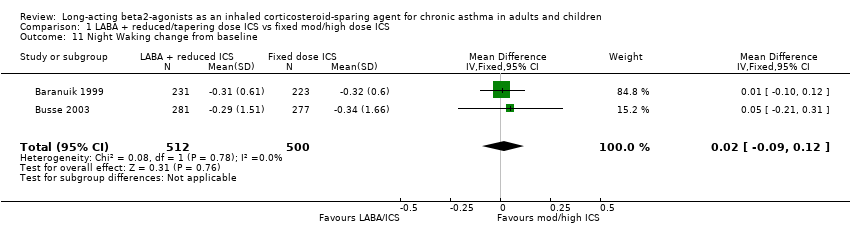
| 9 Night Waking change from baseline Show forest plot | 2 | 1012 | Mean Difference (IV, Fixed, 95% CI) | 0.02 [‐0.09, 0.12] |
|
| 9.1 Fixed dose ICS control group | 2 | 1012 | Mean Difference (IV, Fixed, 95% CI) | 0.02 [‐0.09, 0.12] |
| 9.2 Reduced/tapering dose ICS control group | 0 | 0 | Mean Difference (IV, Fixed, 95% CI) | 0.0 [0.0, 0.0] |
| 10 Adverse Events Show forest plot | 3 | 1046 | Risk Ratio (M‐H, Fixed, 95% CI) | 0.92 [0.80, 1.07] |
|
| 10.1 Fixed dose ICS control group | 2 | 1012 | Risk Ratio (M‐H, Fixed, 95% CI) | 0.92 [0.79, 1.08] |
| 10.2 Reduced/tapering dose ICS control group | 1 | 34 | Risk Ratio (M‐H, Fixed, 95% CI) | 0.93 [0.63, 1.36] |
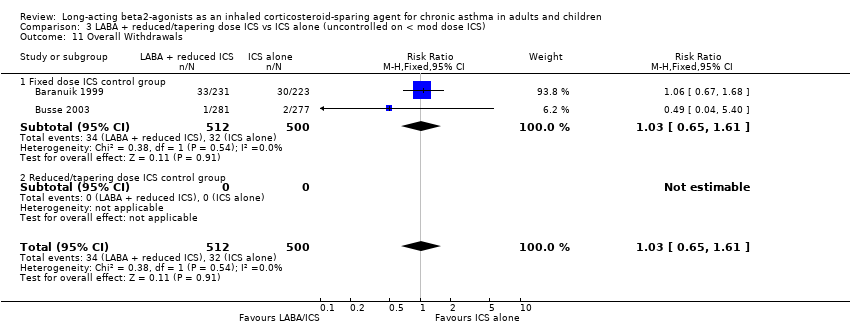
| 11 Overall Withdrawals Show forest plot | 2 | 1012 | Risk Ratio (M‐H, Fixed, 95% CI) | 1.03 [0.65, 1.61] |
|
| 11.1 Fixed dose ICS control group | 2 | 1012 | Risk Ratio (M‐H, Fixed, 95% CI) | 1.03 [0.65, 1.61] |
| 11.2 Reduced/tapering dose ICS control group | 0 | 0 | Risk Ratio (M‐H, Fixed, 95% CI) | 0.0 [0.0, 0.0] |